0072
Semi-Automated Whole Body Neonatal Regional Fat Quantification Using Dixon Chemical Shift (CSI) MRI at 3.0 Tesla1Radiology, Weill Cornell Medicine, New York, NY, United States, 2Pediatrics, Weill Cornell Medicine, New York, NY, United States, 3Pediatrics, Mount Sinai School of Medicine, New York, NY, United States
Synopsis
Whole body fat fraction was previously published by our group in term and preterm infants using Dixon CSI MRI. Advanced semi-automated regional fat quantification was performed yielding: subcutaneous adipose tissue(SAT), visceral adipose tissue(VAT), brown adipose tissue (BAT) volumes and hepatic fat fraction (HFF). Whole body VAT volume (cc) was increased in preterm infants (3.4%±1.5%) compared to term (2.4%±0.9%) (p=0.079) when normalized to total body volume (cc). HFF and BAT did not differ between term and preterm infants (p>0.25). CSI MRI allows quantification of regional fat depots in preterm infants which may potentially help optimize nutritional management and monitor growth.
Introduction
Preterm birth and body composition have demonstrable effects on growth and later health outcomes.[1] Previously, we reported that preterm infants at term corrected age (TCA) have a lower proportion of lean body mass than their term counterparts.[2] Weight and length do not give an accurate assessment of body composition. Tracking body composition rather than just weight is a fundamental part of improving nutritional outcomes. Body composition and hepatic fat correlate with future risk for metabolic syndrome.[3] In children, many conventional techniques for quantifying body composition and hepatic fat have limitations. MRI is a noninvasive research tool to study body composition and hepatic fat in infants. In the present study, we used chemical shift MRI, a rapid, detailed, and robust method of body composition analysis that can be feasibly implemented into the routine clinical care of newborns. Further, we aimed to show that chemical shift MRI has the sensitivity to detect differential growth patterns in preterms at TCA versus term controls by semiautomatic quantification of regional fat depots.Methods
Patient Demographics: Twenty-five infants were enrolled in the study [10 Males/15 Females, median (range) postnatal age 69 (1-138) days, median (range) corrected gestational age 39.4 (36.4-44.7) weeks] with 15 former preterm and 10 term infants. 5 of the 10 term infants were infants of diabetic mothers and were excluded from this analysis. Infants were prepared for the MRI examination using a “feed and wrap” technique.MRI Acquisition Methods: High resolution (1 mm3 isotropic) whole body fat and water images [Figure 1] were acquired on a 3.0 Tesla MRI scanner (GE Healthcare) using the adult Head/Neck 48-Channel Array coil and the Liver Acquisition with Volume Acceleration flex (LAVA-Flex) pulse sequence. A coronal 3D slab was acquired during free-breathing with 160 images using: TR/TE 4.0ms/1.7ms, flip angle of 12°, 48 cm (FOV), a 288x288 matrix reconstructed to 512x512 yielding a scan time of only 42 seconds.
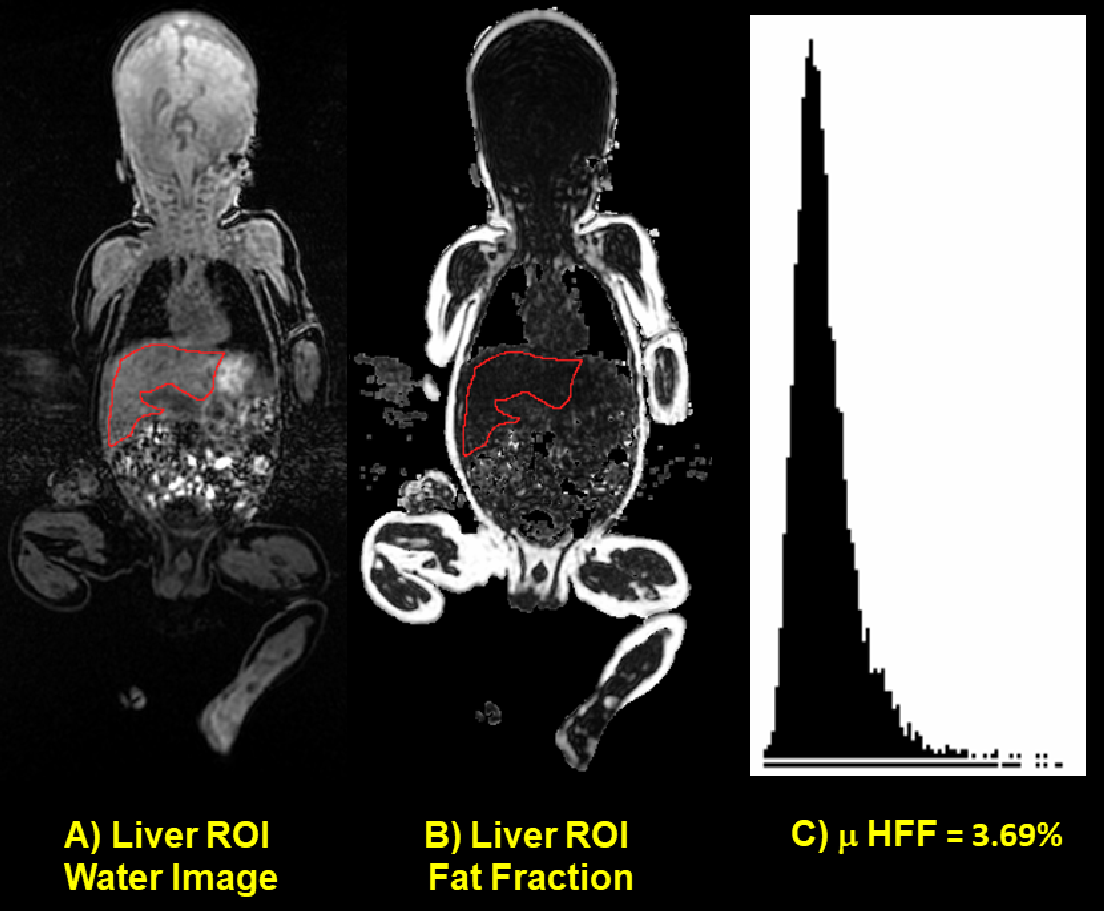
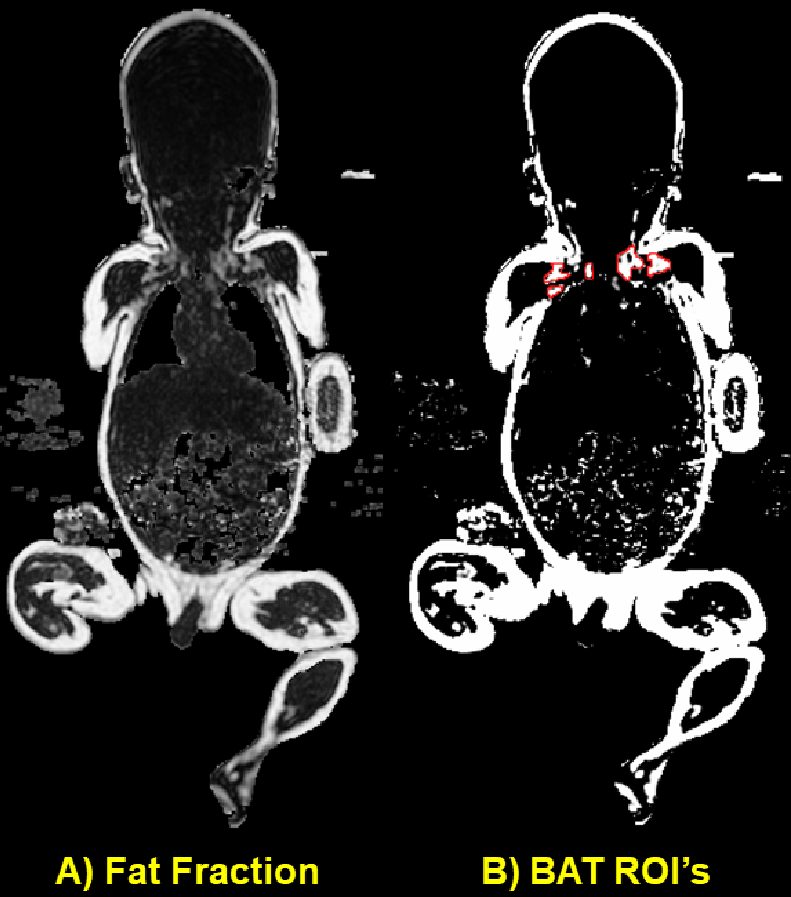
MRI Analysis Methods: SAT/VAT: A fully automated ImageJ Macro produced a preliminary SAT map for each coronal slice in the whole body [Figure 1]. Manual elimination of minor VAT deposits such as those in the perirenal areas that were connected to the SAT were removed. An inverse mask of the SAT was multiplied by the fat fraction map which resulted in the VAT map. Voxels > 50% fat fraction were categorized as VAT. HFF: An ROI was drawn on the Dixon water only image which allowed the best anatomic delineation of the liver structure at the level of the portal hilum avoiding vasculature and ducts [Figure 2]. The same ROI was overlaid onto the fat fraction image and the process repeated in three consecutive slices. A fat fraction histogram was calculated for all voxels in the three ROI’s and the mean HFF of the typically asymmetric distribution reported. BAT: Segmentation of the brown adipose tissue (BAT) was determined by fixing the level of the fat fraction map at 35% with a window of 10% [Figure 3]. ROI’s were drawn on three consecutive slices outlining the supraclavicular and axillary BAT clusters which were more readily identified in the VAT maps.
Statistics Methods: A two-tailed t-test was used assuming unequal variances (heteroscedastic) and significance levels of p<0.05.
Results
Whole body VAT volume (cc) was mildly increased in preterm infants (3.4%±1.5%) compared to term (2.4%±0.9%) when normalized to total volume (cc) (p=0.079). HFF did not significantly differ between term (2.9%±1.4%) and preterm (3.3%±1.0%) infants (p=0.60) as measured in three consecutive slices. Likewise, BAT normalized to total volume was also similar between term (0.08%±0.01%) and preterm (0.09%±0.03%) infants (p=0.25) as measured in three consecutive slices.Discussion
Chemical shift MRI is a rapid, accurate and repeatable method of body composition analysis that may be feasible for implementation in routine nutritional management of preterm infants. In seeking to better understand the differential growth of preterm versus full-term infants, it may be important to track not just whole body fat accumulation but also the fat distribution in different compartments.Conclusion
In summary, semiautomated regional fat quantification using chemical shift MRI represents a safe, rapid, robust method which may potentially help optimize nutritional management of preterm infants and monitor their growth.Acknowledgements
No acknowledgement found.References
1) Andrews ET, Beattie RM, Johnson MJ. Measuring body composition in the preterm infant: Evidence base and practicalities. Clin Nutr 2019:38:2521-2530.
2) Dyke JP, Garfinkel AC, Groves AM, Kovanlikaya A. High-resolution rapid neonatal whole-body composition using 3.0 Tesla chemical shift magnetic resonance imaging. Pediatr Res. 2018;83:638-644.
3) Armstrong T, Ly VL, Ghahremani S, Calkins KL, Wu HH. Free breathing 3-D quantification of infant body composition and hepatic fat using a stack-of-radial magnetic resonance imaging technique. Ped Radiol 2019;49:876-888.
Figures