0067
Transcranial direct current stimulation for multiple sclerosis: real time and cumulative effects on functional connectivity1Department of Radiology, New York University School of Medicine, New York, NY, United States, 2Department of Neurology, New York University School of Medicine, New York, NY, United States
Synopsis
Transcranial direct current stimulation (tDCS) is an innovative, non-invasive, brain stimulation technique that modulates cortical excitability by applying weak electrical currents. Despite cognitive improvements in multiple sclerosis (MS) subjects have been recently reported, the underlying in-vivo physiological mechanism of tDCS remains largely unclear. The purpose of this study is therefore to firstly address the real time tDCS effect (with simultaneous MRI scans) on the functional connectivity of both controls and MS patients. Secondly, we want to investigate whether such changes are altered in MS subjects following 20 tDCS treatment sessions.
Introduction
Transcranial direct current stimulation (tDCS) is a safe, well-tolerated, and non-invasive brain stimulation technique that modulates cortical excitability by applying weak electrical currents1. Preliminary studies have found that tDCS treatments can lead to increase in cognitive abilities of subjects with multiple sclerosis (MS)2,3. Despite its positive clinical findings in MS4,5, the underlying in-vivo physiological mechanism of tDCS remains largely unclear. In current literature, there is a gap of knowledge regarding how externally applied tDCS modifies brain activity and connectivity and what is the cumulative effect on functional connectivity after a number of sessions of tDCS treatments.The purpose of this study is therefore to firstly address the real time tDCS effect (with simultaneous MRI scans) of changes in functional connectivity in both controls and MS patients. Secondly, we want to investigate whether such changes are altered in MS subjects following 20 tDCS treatment sessions.Methods
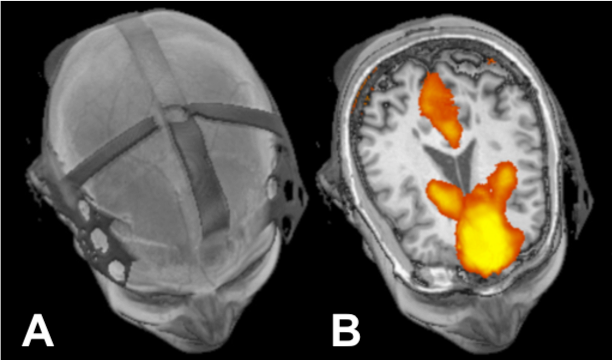
21 healthy controls (HC) (age=38±16.7, 9 males) and 22 diagnosed MS patients (age=49±10.4, 8 males) were recruited and all studies were performed by following protocols approved by the institutional review board. MRI was performed on 3T scan with a 64 channels head coil. To test the real time tDCS effects, a MR-compatible tDCS device (Soterix Medical) was used to acquire simultaneous MRI before and during stimulation (2.0 mA) in both controls and MS patients (Figure 1). Only MS patients were asked to come back after 4 weeks for a follow-up scanning. During this period, MS subjects were treated with 20 sessions of tDCS (2.0 mA) lasting 20 minutes, to then investigate the cumulative treatment effects. Only 15 MS subjects of the initial 22 came back for the follow-up visit. This imaging session was carried out with the same protocol of the first one to enable data comparison.During a MRI scanning session subjects received left anodal dorsolateral prefrontal cortex stimulation for 15 minutes at current 2.0 mA. Brain structural data was acquired with T2 FLAIR imaging for lesions and 3D T1 MPRAGE for anatomical images. Resting state functional data (RS-fMRI) was acquired using a 2D GRE echo planar imaging sequence (TR=2s; TE=25ms; 3x3x3 mm slices) collecting 35 slices. These functional images were collected before and during t-DCS. To minimize the ramp up tDCS effect, the RS-fMRI was performed 9 minutes after tDCS was turned on, during which FLAIR and MPRAGE were scanned.
Neuroimaging data was analyzed under the General Linear Model (GLM) using SPM12 implemented in Matlab; specifically using the available CONN6 toolbox. Functional connectivity strength (Fs) of the default mode network (DMN) was investigated using seed-to-voxel correlation analysis. ROI-to-ROI analysis was carried out to investigate the medial prefrontal cortex (mPFC) to posterior cingulate cortex (PCC) connectivity for within-DMN analysis. Additionally, whole brain connectivity analysis was performed using seeds in each of the DMN’s substructures to evaluate connectivity of DMN to the rest of the brain.
Results and Discussion
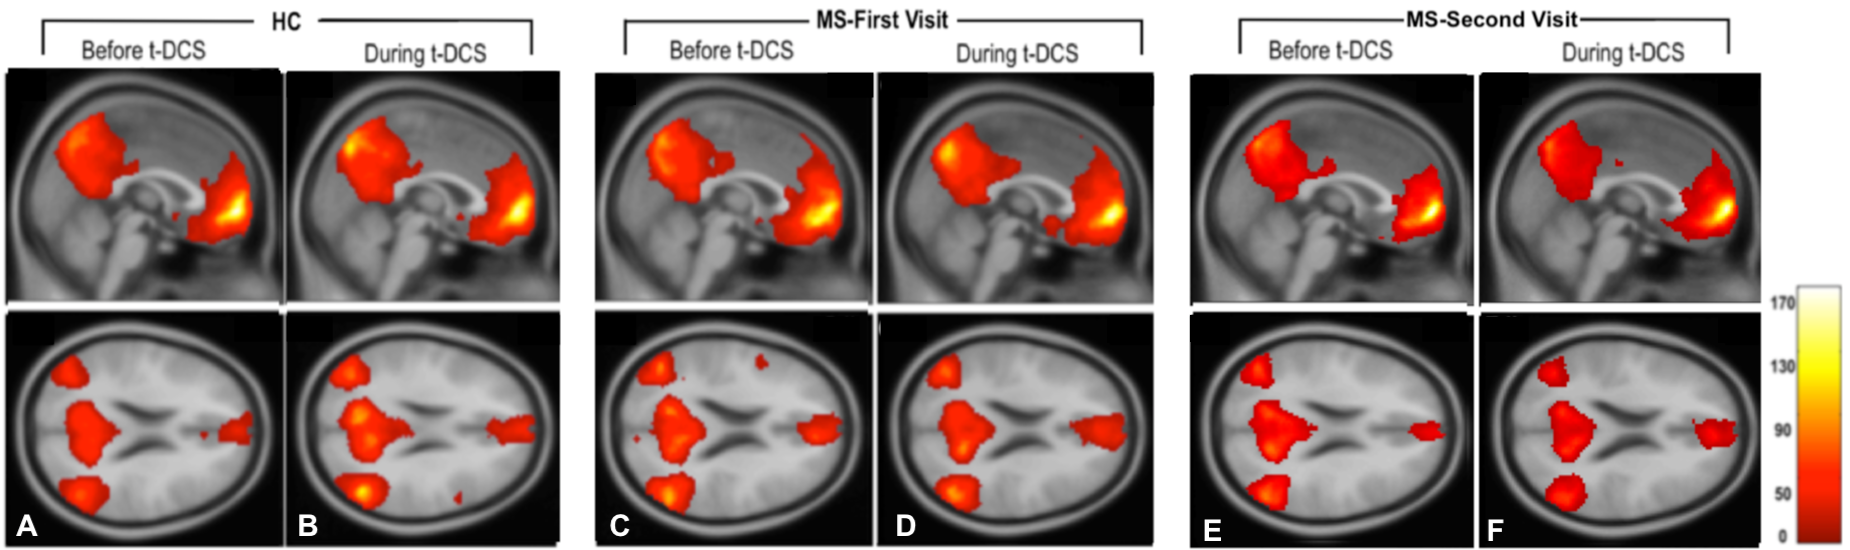
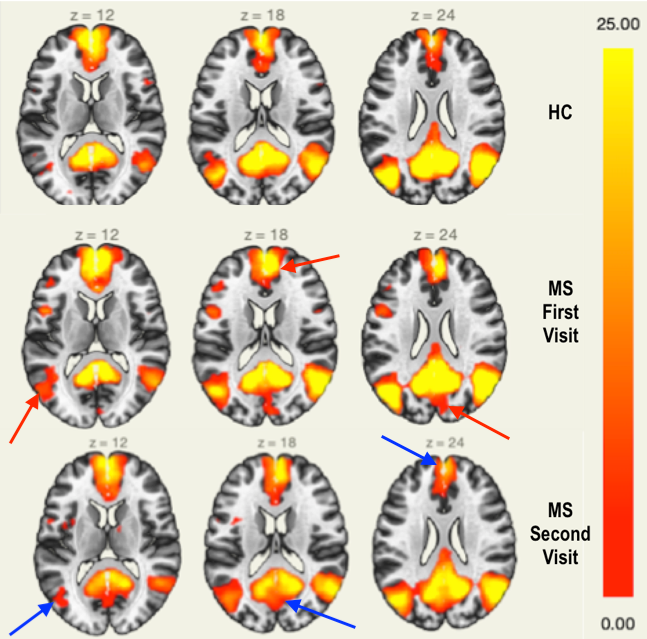
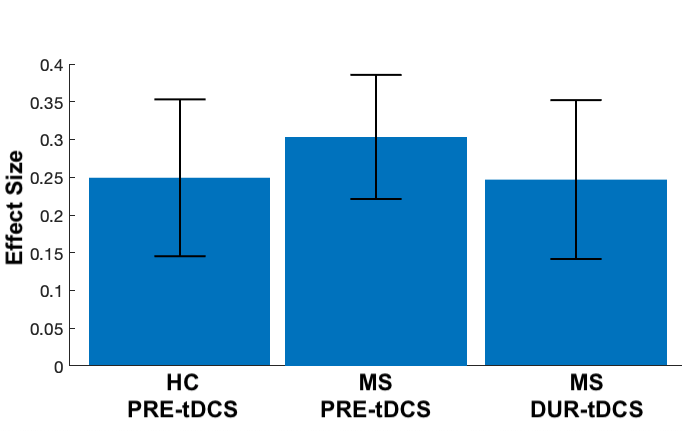
Firstly, for real time in-scanner tDCS effects, one sample t-test (p<0.05, FDR) was carried out. An increase in DMN (all regions) connectivity was found in HCs during stimulation, or tDCS-on (Fs=21.59±4.94) compared to baseline, or tDCS-off (Fs=19.23± 4.10) (Figure 2. Left). However, the opposite was observed in MS patients, where t-DCS decreased overall DMN strength (Fs=17.67±6.20) compared to baseline (Fs=21.74±3.35) (Figure 2. Middle). On the other hand, results from MS patients’ follow-up visit, after receiving daily t-DCS treatment for 4 weeks, showed no remarkable difference in functional connectivity between baseline (Fs=16.00±4.34) and during stimulation (Fs=15.88±4.34) (Figure 2. Right), suggesting a “saturation” point to the real time stimulation. Figure 3 shows the comparisons of baseline DMN subregional connectivity between each group. The higher connectivity strength in MS first visit is in contrast with what we expected, however, similar results have been reported in previous literature7-9. Reduced connectivity of the DMN, after 20-tDCS treatment sessions on patients’ follow up visit, indicates the long-lasting (i.e., cumulative) and compensating effect for the abnormally high connectivity at baseline.Since tDCS was placed in the forehead, we are interested in specific DMN subregion connectivity changes between mPFC and PCC. As shown in Figure 4, there was a decreased MPFC-PCC connectivity strength in MS patients during tDCS (Fs=4.04; beta=0.25; p=0.0032, FDR) compared to baseline (Fs=6.35; beta=0.30; p=0.000056, FDR), and an significant increase in strength in HCs during stimulation (Fs=4.23; beta=0.25; p=0.0027, FDR) compared to baseline (Fs=4.14;beta=0.22; p =0.0032, FDR).
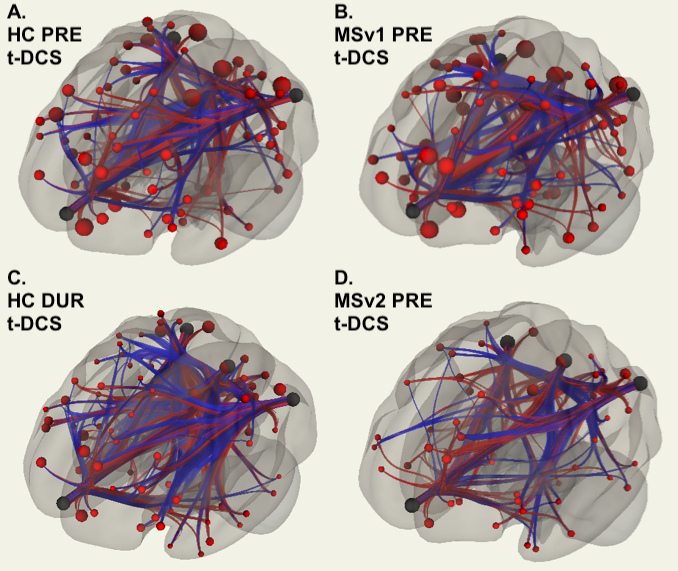
The findings of whole brain graph analysis addressing the number and intensity of connection between DMN’s ROIs and other brain regions (Figure 5) also support the results of within-DMN subregional connectivity analysis.
Conclusion
From the results of real time and cumulative effects of tDCS, it is evident that tDCS has an effect on modulating brain functional connectivity. It can be seen that, whilst a disproportional increase network strength can be considered a hallmark for MS, tDCS has therapeutic potential to bring such abnormally high synchronicity towards intensities closer to the connectivity level observed in HCs. However, further studies are warranted to correlate the imaging findings with cognitive effects and provide more information for its clinical applications.Acknowledgements
This study was funded by National Institute of Health (NIH) grant R21 HD094424.References
1. Nitsche, M.A., Cohen, L.G., Wassermann, E.M., Priori, A., Lang, N., Antal, A., Paulus, W., Hummel, F., Boggio, P.S., Fregni, F. and Pascual-Leone, A., 2008. Transcranial direct current stimulation: state of the art 2008. Brain stimulation, 1(3), pp.206-223.
2. Hanken, K., Bosse, M., Möhrke, K., Eling, P., Kastrup, A., Antal, A. and Hildebrandt, H., 2016. Counteracting fatigue in multiple sclerosis with right parietal anodal transcranial direct current stimulation. Frontiers in neurology, 7, p.154.
3. Charvet, L.E., Shaw, M.T., Haider, L., Melville, P. and Krupp, L.B., 2015. Remotely-delivered cognitive remediation in multiple sclerosis (MS): protocol and results from a pilot study. Multiple Sclerosis Journal–Experimental, Translational and Clinical, 1.
4. Charvet LE, K.M., Bikson M, Datta A, Knotkova H, Stevens MC, Alonzo A, Loo C, Krull K, Haider L., 2015. Remotely-Supervised Transcranial Direct Current Stimulation (tDCS). in NYC Neuromodulation Conference. New York, NY.
5. Cuypers, K., Leenus, D.J., Van Wijmeersch, B., Thijs, H., Levin, O., Swinnen, S.P. and Meesen, R.L., 2013. Anodal tDCS increases corticospinal output and projection strength in multiple sclerosis. Neuroscience letters, 554, pp.151-155.
6. Whitfield-Gabrieli, S., and Nieto-Castanon, A., 2012. Conn: A functional connectivity toolbox for correlated and anticorrelated brain networks. Brain Connectivity. doi:10.1089/brain.2012.0073
7. Koenig, K.A., Lowe, M.J., Lin, J., Sakaie, K.E., Stone, L., Bermel, R.A., Beall, E.B., Rao, S.M., Trapp, B.D. and Phillips, M.D., 2013. Sex differences in resting-state functional connectivity in multiple sclerosis. American Journal of Neuroradiology. 34(12): p.2304-2311.
8. Basile, B., Castelli, M., Monteleone, F., Nocentini, U., Caltagirone, C., Centonze, D., Cercignani, M. and Bozzali, M., 2014. Functional connectivity changes within specific networks parallel the clinical evolution of multiple sclerosis. Multiple Sclerosis Journal. 20(8): p.1050-1057.
9. Hawellek, D.J., Hipp, J.F., Lewis, C.M., Corbetta, M. and Engel, A.K., 2011 . Increased functional connectivity indicates the severity of cognitive impairment in multiple sclerosis. Proceedings of the National Academy of Sciences. 108(47): p.19066-19071.
Figures