0065
Virtual hypoxia and structural network alterations in multiple sclerosis: a combined 23Na and diffusion MRI study1Aix-Marseille Université, CNRS, CRMBM, Marseille, France, 2APHM, Hôpital de la Timone, Pôle de Neurosciences Cliniques, Service de Neurologie, Marseille, France, 3APHM, Hôpital de la Timone, Pôle d’Imagerie Médicale, CEMEREM, Marseille, France
Synopsis
Virtual hypoxia is a key factor in the induction of pathological processes in multiple sclerosis. 23Na-MRI is an emerging technique in virtual hypoxia exploration, with previous studies showing relevance of grey matter sodium accumulation in MS. In the present study, we showed that grey matter sodium accumulation is mainly driven by accumulation in the most connected cortical regions (called hubs) and correlate with disability. This study provides an insight in several processes of energy failure and brain reorganization in MS.
INTRODUCTION
Recent data indicate that mitochondrial dysfunction and subsequent energy failure are key factors in the induction of pathological processes in multiple sclerosis (MS), at the same time as parallel processes place additional demands on the brain’s energy supply. Mitochondrial energy failure results in axonal sodium accumulation, which leads to axonal injury1. Recent works applying 23Na-MRI in MS have shown sodium accumulation in MS patients that correlate with physical and cognitive disability2–4. Importantly, the topography of total sodium accumulations in grey matter (GM) includes brain regions that are well known to have a central role as integrative hubs within the human brain network. Such hubs are also known to be energetically costly. However, the association between the integrity or reorganization of the brain structural network and energy failure reflected by sodium accumulation has never been analyzed. The first aim of the present study is to determine if sodium accumulation predominates in these integrative hubs’ GM regions.METHODS
Subjects39 patients and 24 controls were enrolled. All patients had an early stage of relapsing-remitting MS. Patients’ disability was rated using the EDSS and the MSFC.
MRI acquisition
MR exams were performed at 3T (Verio, Siemens).23Na-MRI was performed using a 23Na–1H volume head-coil and a density-adapted 3D radial sequence (TE/TR=0.2/120ms, 17000 projections and 369 samples/projection, 3.6mm isotropic resolution). Two reference tubes (50 mmol/l) were used for quantification. 1H-MRI protocol was performed using a 32-channel phased-array head coil and a 3D-MPRAGE (TR/TE/TI=2300/3/900ms, 160 slices, 1mm isotropic resolution) and a diffusion-weighted single-shot EPI sequence (TE/TR=95/10700ms, 60 sections, 2mm isotropic resolution, 64 gradient-encoded directions with b=1000 s/mm2).
Post-processing
Quantitative sodium maps
Reconstruction of the denoised total sodium concentration (TSC) maps was performed3. TSC were expressed as Z-score:
$$ Z-score TSC (nodei patients) = (TSC (nodei patients) – TSC (mean nodei controls))/standard-deviation TSC (mean nodei controls)) $$
were nodes being GM regions (below).
Structural network analysis (Figure1)
GM regions of each subject were parcellated on 3D-MPRAGE using the Destrieux atlas (Freesurfer). White matter tracts were reconstructed adopting a whole-brain probabilistic fibertracking approach (MRtrix)5. We modelled the structural undirected brain network using the reconstructed white matter tracts and the parcellated brain regions (each region used to define a node). Edges weights were determined by mean FA values of tracts between any pair of nodes. Network metrics were computed using the Brain Connectivity Toolbox. We investigated measures of network architecture of each subject with the weighted degree and betweenness centrality of each region. Hubs are described as highly connected nodes, connection defined by their centrality. To assess if the topologic reorganization was more prevalent in hubs, we also calculated the hub-disruption index6.
Between-groups comparisons for degree and centrality were assessed using Wilcoxon-test. Correlation analyses between Z-score TSC, structural connectivity and clinical parameters were assessed using Spearman-rank test (JMP9).
RESULTS
Subjects: The patients’ group (12M/27F) had a median age of 32.5years [21–62], median disease duration of 2years [0.5–8] and median EDSS of 1 [0–4.5]. The control group (13M/11F) had a median age of 32years [21–61].Structural connectivity: Among structural network parameters, the degree was significantly lower in patients compared to controls (p=0.0002). There was no difference for betweenness centrality (p=0.37). The hub-disruption index was not different from zero (p=0.38). Figure2 represents the betweenness centrality of each node for patients and controls. Two components are individualized, a slow increase of the node centrality until the 75th-percentile followed by a higher increase, defining the hubs. Hubs in controls and patients are represented in Figure3,4. In controls, among hubs, the most connected regions are right caudate, right thalamus, left caudate, left medial occipito-temporal gyrus, left precuneus, and left thalamus. In patients, the most connected regions are right and left caudate, right thalamus, left precuneus, right nucleus accumbens and left medial occipito-temporal gyrus. In patients, left subcentral gyrus and left calcarine were no longer part of the hubs category and were replaced by the right superior parietal gyrus and left sub-callosal gyrus.
Sodium accumulation: There is a global significant sodium accumulation in patients compared to controls in all nodes with a TSC Z-score =0.153 (p <0.0001). In hubs, TSC Z-score was positively correlated to betweenness centrality (Spearman's rho=0.563; p=0.0001) whereas it was not significant in non-hubs (rho=-0.14; p=0.123) nor in all nodes (rho=-0.12; p=0.125), Figure5. The TSC Z-score was positively correlated to the disease duration (rho=0.317; p=0.049) and negatively correlated to the MSFC score (rho=-0.38; p=0.0171).
DISCUSSION
At early stage of MS (2 years), patients present a stable global brain network with a preserved hierarchical organization. Nevertheless, we observed a significant sodium accumulation in hubs. Moreover, higher centrality of these nodes, indicating higher energy consumptions due to higher connectivity in the network, was associated with higher sodium accumulation, reflecting a putative energy failure. These nodes defined as hubs in the present study are known to be subject to pathological processes in MS7,8 and are fundamental for neuronal network organization9,10.CONCLUSION
Investigating energy metabolism in the structural network of MS patients links two emerging but fundamental concepts for MS pathology. This study provides an insight in putative energy related alterations of the fundamental organization of the brain network.Acknowledgements
ARSEPReferences
1. Waxman SG. Mechanisms of Disease: sodium channels and neuroprotection in multiple sclerosis—current status. Nature Clinical Practice Neurology. 2008;4:159–169.
2. Zaaraoui W, Konstandin S, Audoin B, et al. Distribution of brain sodium accumulation correlates with disability in multiple sclerosis: a cross-sectional 23Na MR imaging study. Radiology. 2012;264:859–867.
3. Maarouf A, Audoin B, Pariollaud F, et al. Increased total sodium concentration in gray matter better explains cognition than atrophy in MS. Neurology. 2017;88:289–295.
4. Brownlee WJ, Solanky B, Prados F, et al. Cortical grey matter sodium accumulation is associated with disability and secondary progressive disease course in relapse-onset multiple sclerosis. J Neurol Neurosurg Psychiatry. 2019;90:755–760.
5. Besson P, Lopes R, Leclerc X, Derambure P, Tyvaert L. Intra-subject reliability of the high-resolution whole-brain structural connectome. Neuroimage. 2014;102 Pt 2:283–293.
6. Achard S. A Resilient, Low-Frequency, Small-World Human Brain Functional Network with Highly Connected Association Cortical Hubs. Journal of Neuroscience. 2006;26:63–72.
7. Freeman L, Garcia-Lorenzo D, Bottin L, et al. The neuronal component of gray matter damage in multiple sclerosis: A [(11) C]flumazenil positron emission tomography study. Ann Neurol. 2015;78:554–567.
8. Rocca MA, Valsasina P, Leavitt VM, et al. Functional network connectivity abnormalities in multiple sclerosis: Correlations with disability and cognitive impairment. Multiple Sclerosis Journal. Epub 2017.:1352458517699875.
9. Hagmann P, Cammoun L, Gigandet X, et al. Mapping the structural core of human cerebral cortex. PLoS Biol. 2008;6:e159.
10. Sporns O. Contributions and challenges for network models in cognitive neuroscience. Nat Neurosci. 2014;17:652–660.
Figures
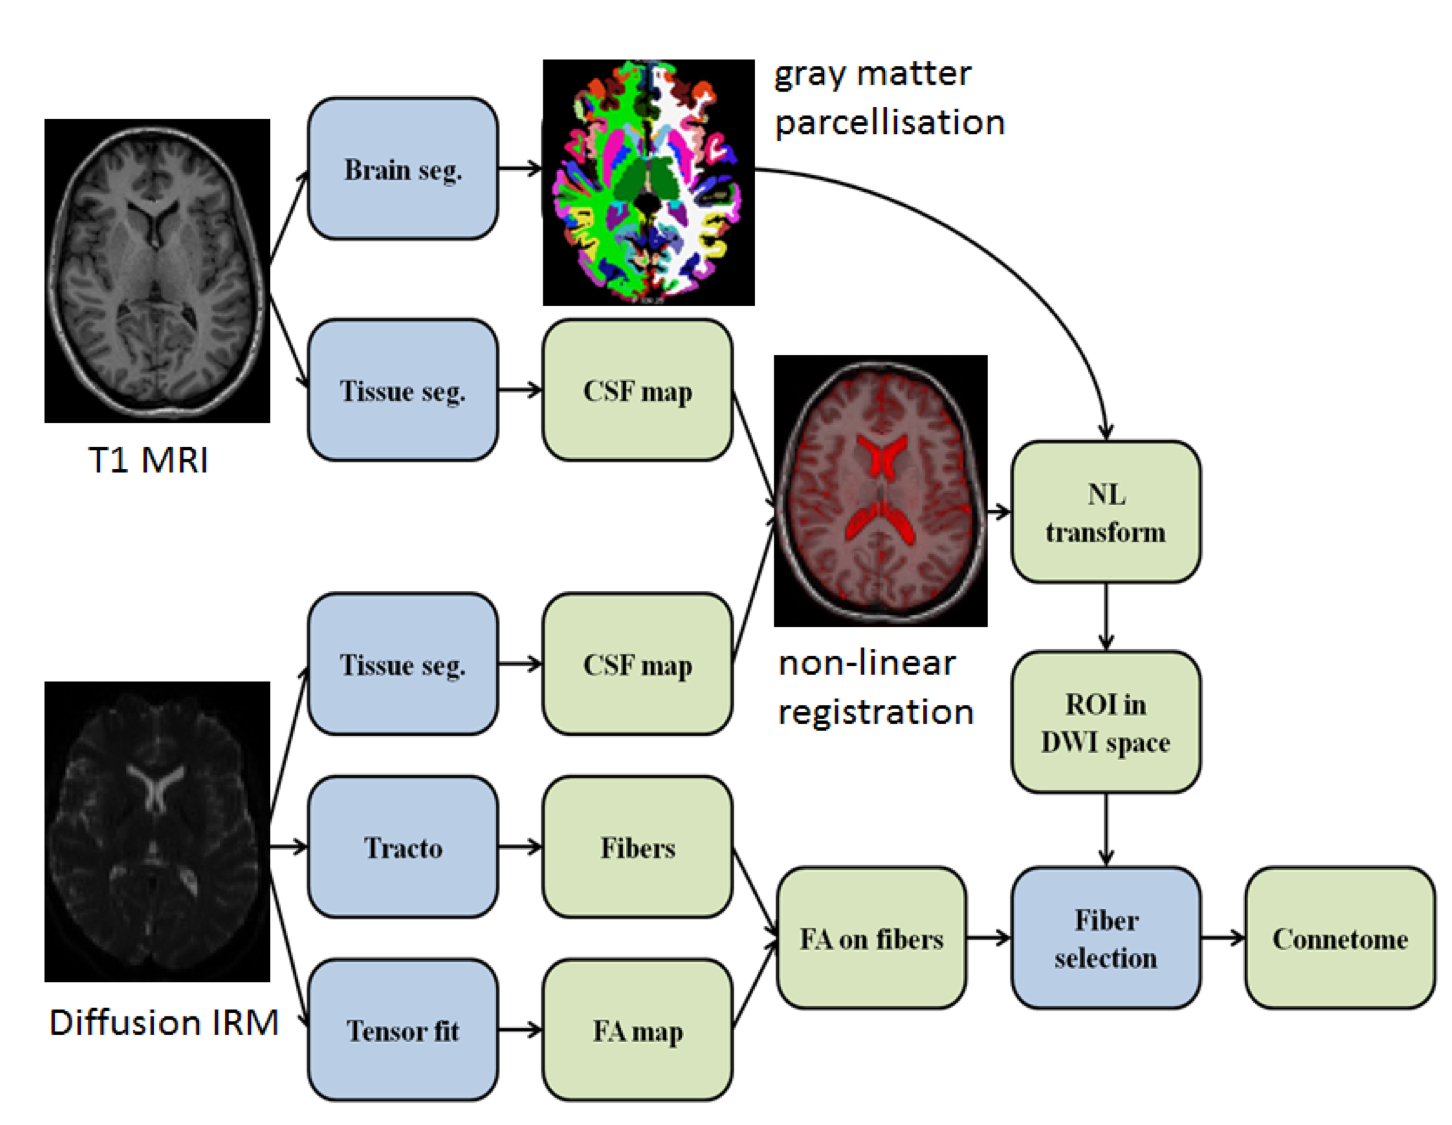
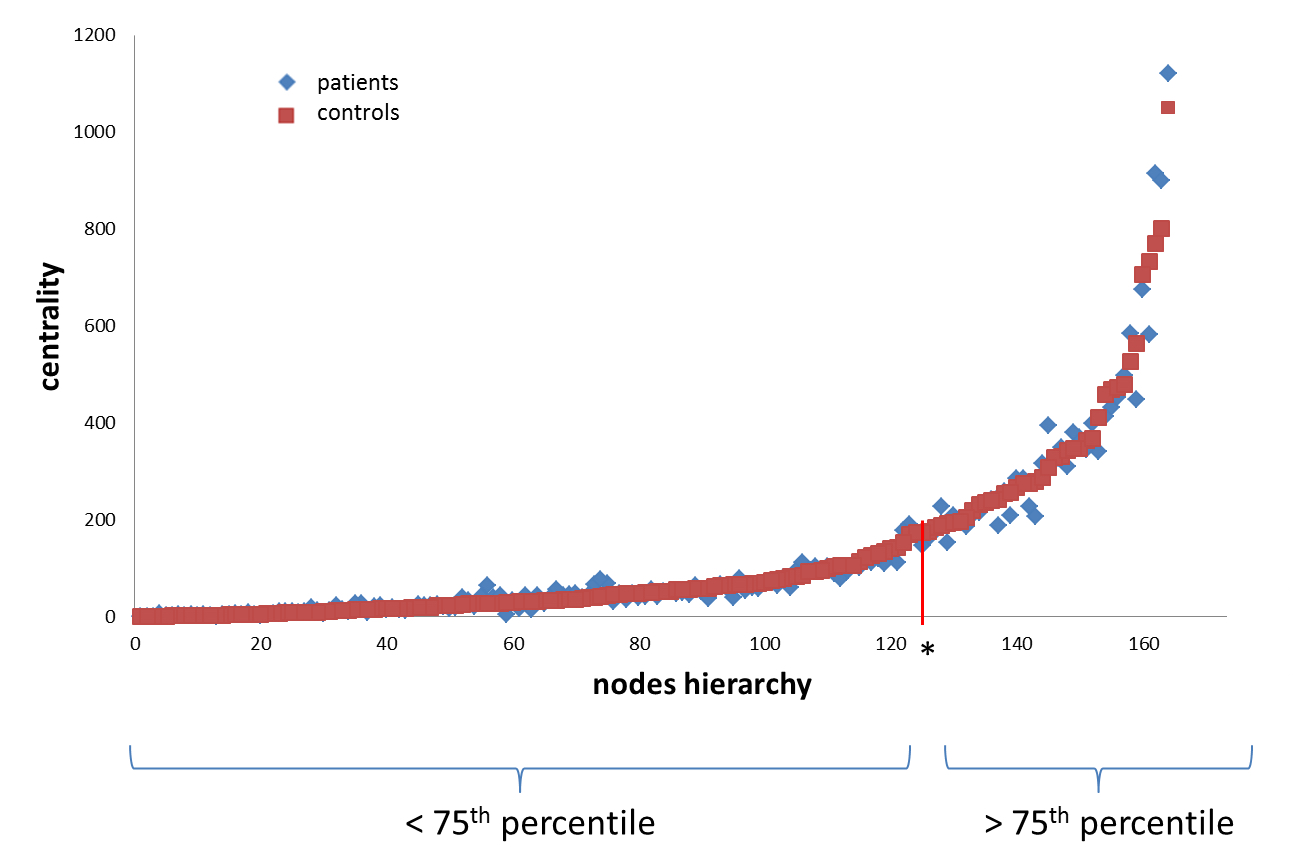
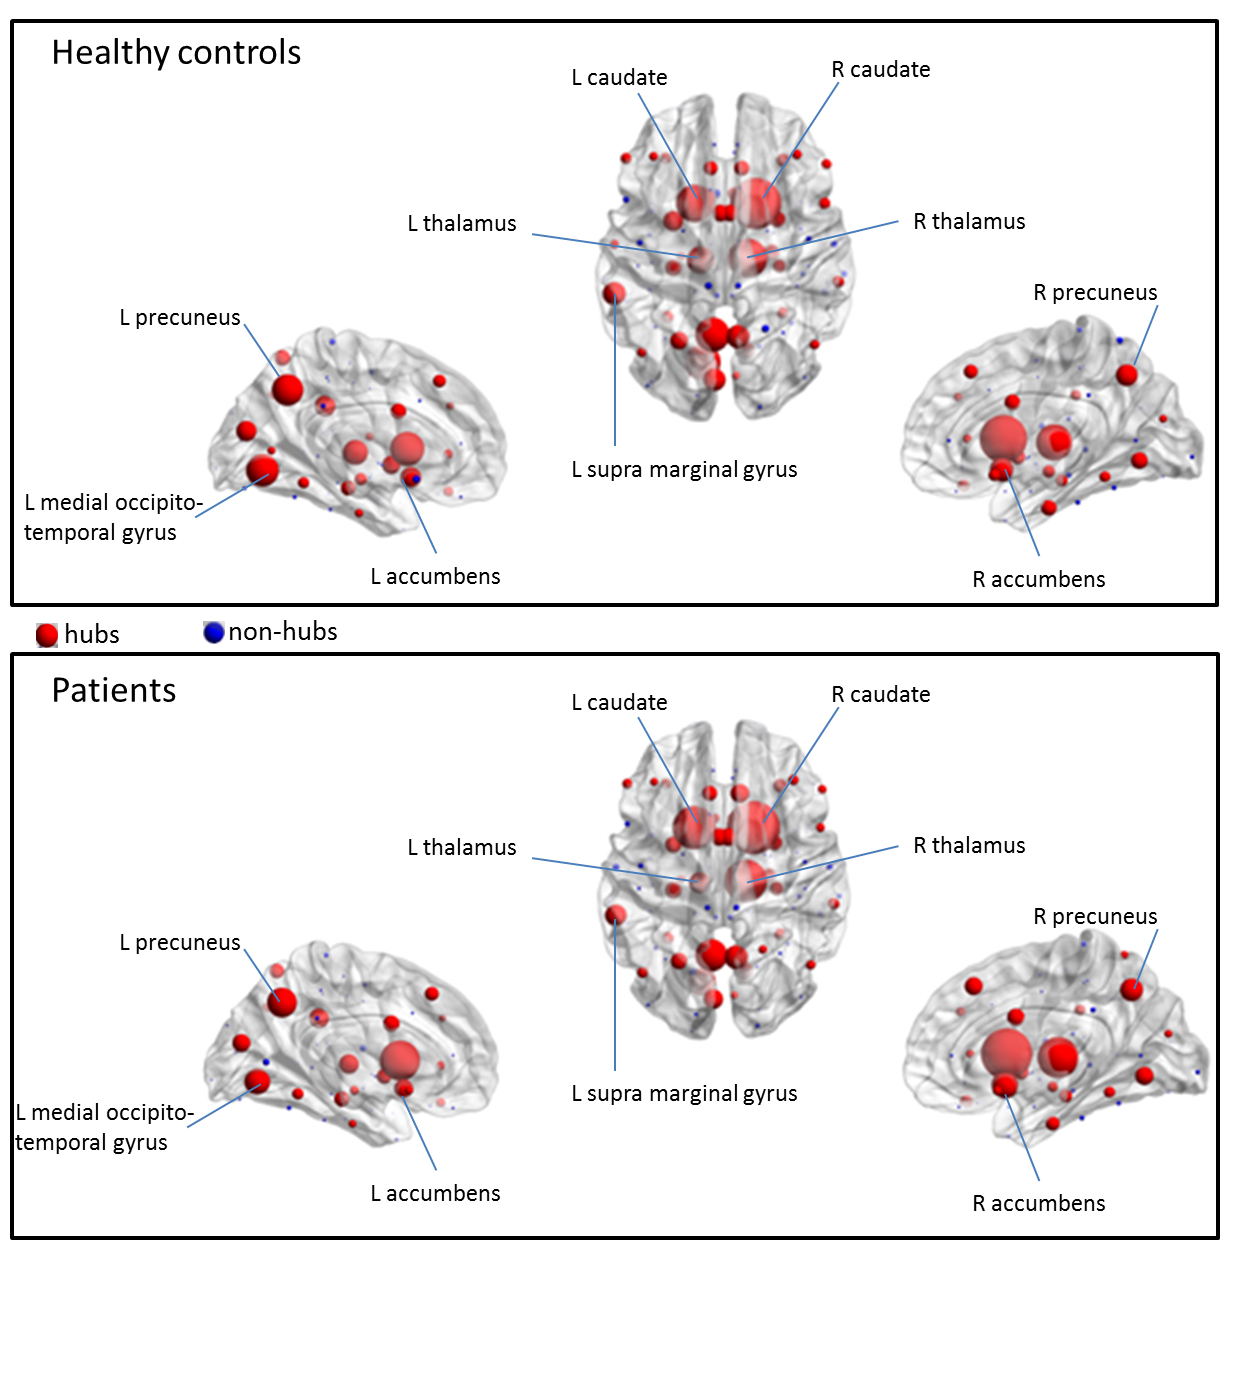
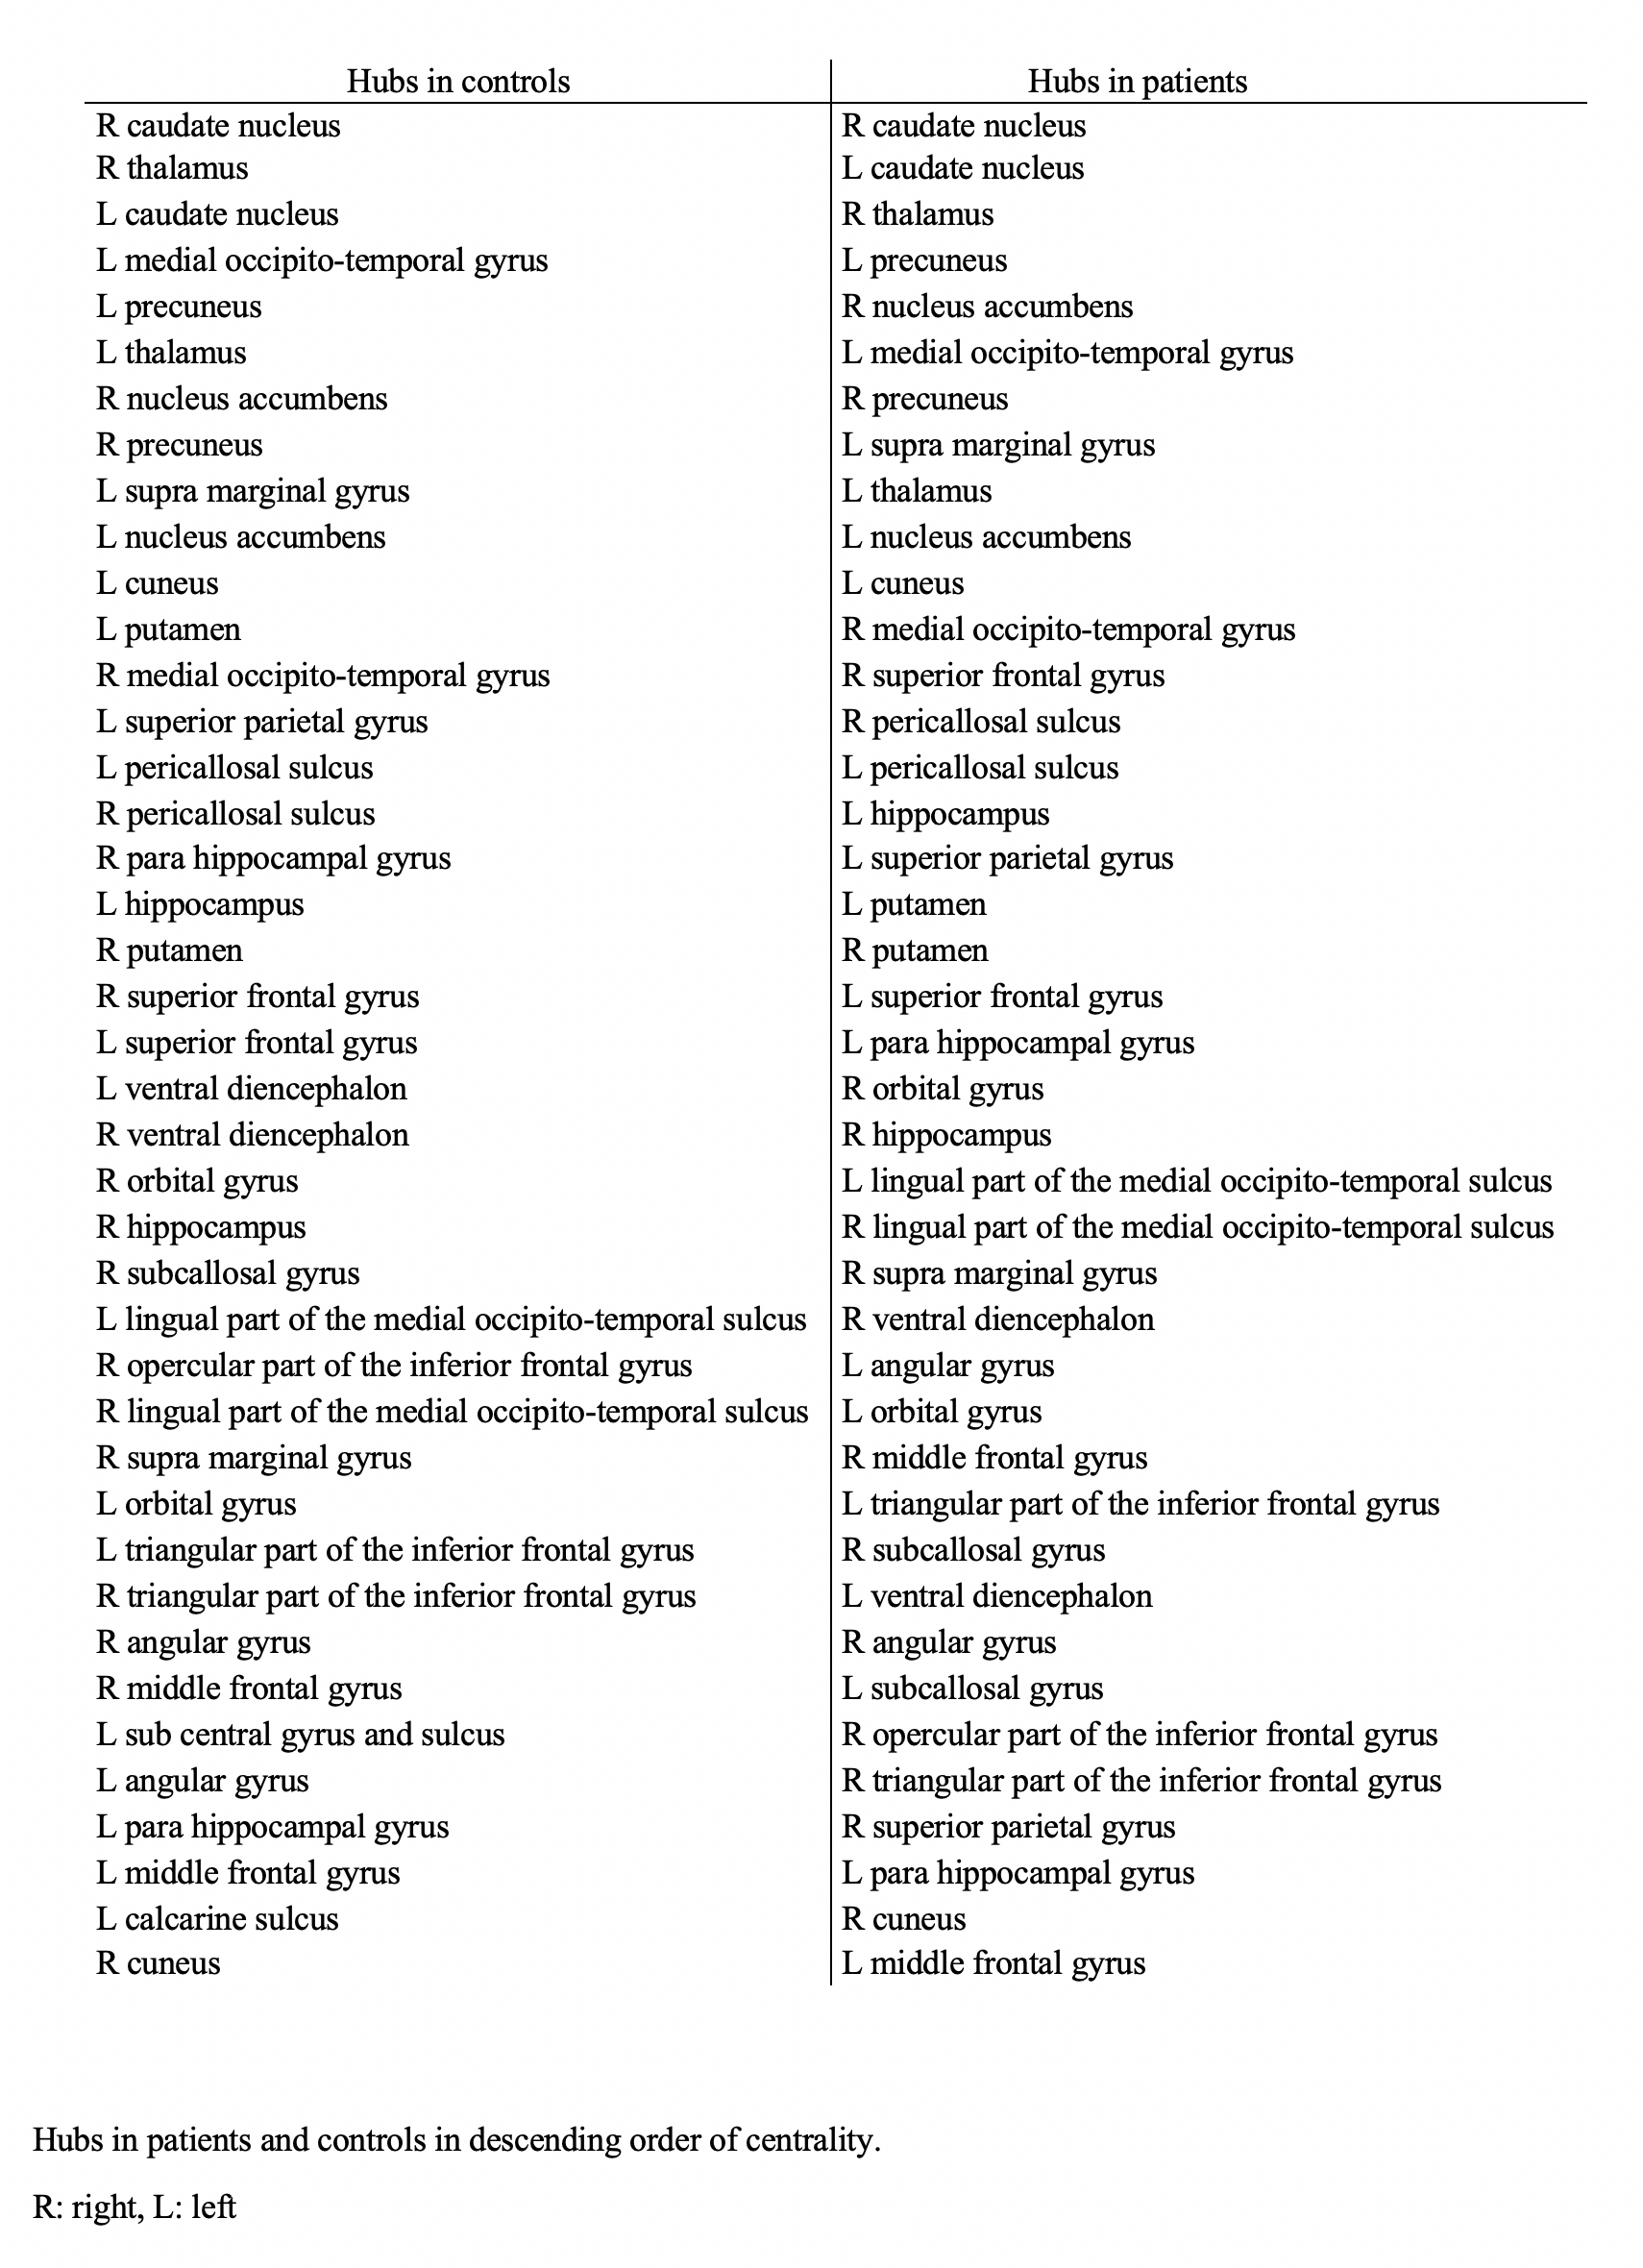
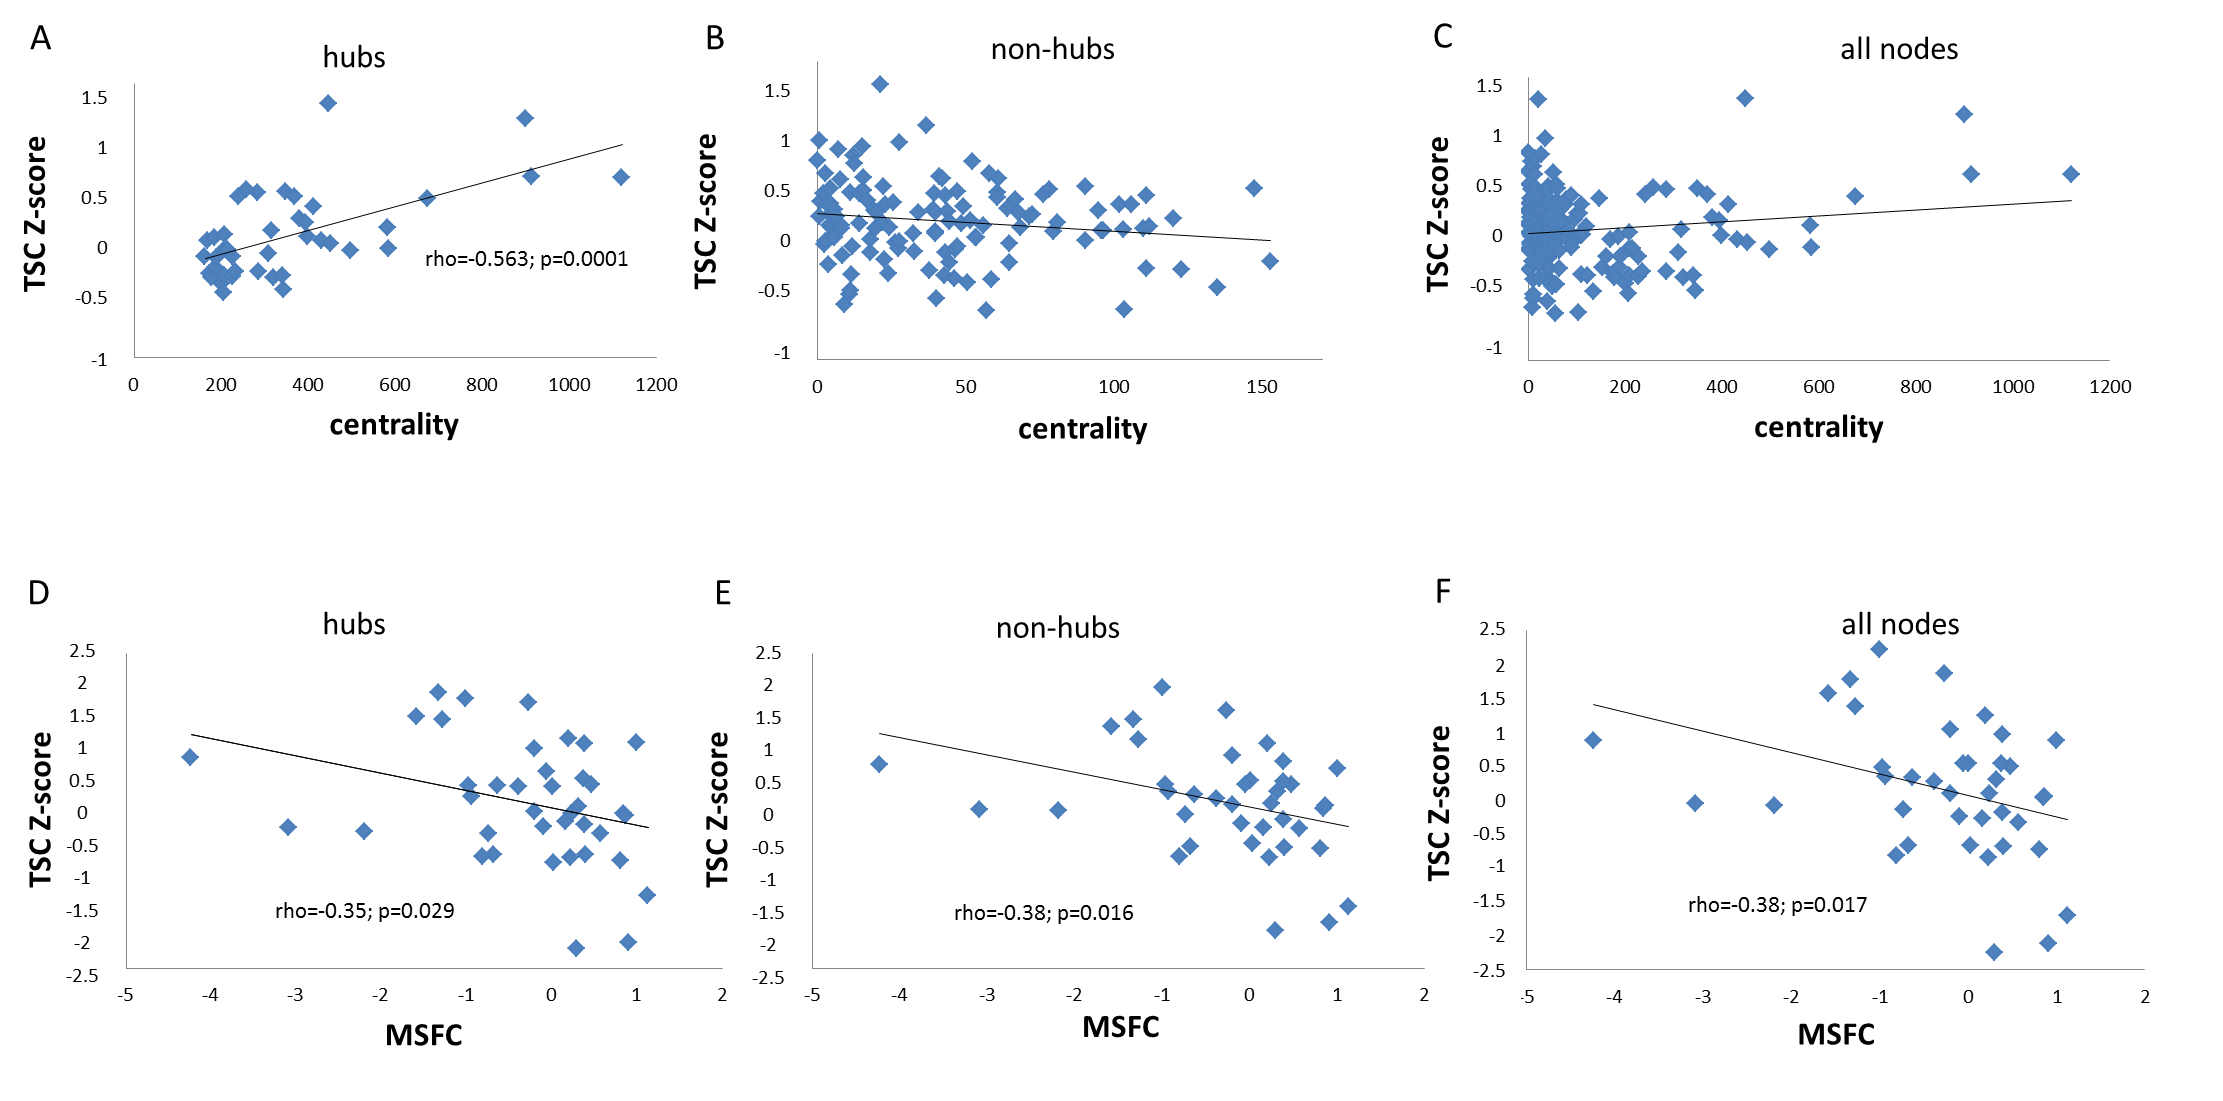
Figure 5. First line: Correlations between Z-Score TSC and betweenness centrality for (a) hubs (b) non-hubs and (c) all nodes.
Second line: Correlations between Z-Score TSC and MSFC (clinical score of disability) for (a) hubs (b) non-hubs and (c) all nodes.