0060
Advanced MRI measures reveal sex differences in the Normal Appearing and Diffusely Abnormal White Matter of Multiple Sclerosis Brain1Radiology, University of British Columbia, Vancouver, BC, Canada, 2International Collaboration on Repair Discoveries (ICORD), University of British Columbia, Vancouver, BC, Canada, 3Physics and Astronomy, University of British Columbia, Vancouver, BC, Canada, 4Medicine (Neurology), University of British Columbia, Vancouver, BC, Canada, 5MS/MRI Research Group, University of British Columbia, Vancouver, BC, Canada, 6Radiology, Washington University, St. Louis, MO, United States, 7Pathology and Laboratory Medicine, University of British Columbia, Vancouver, BC, Canada
Synopsis
Diffusely abnormal white matter (DAWM) is a non-focal area of mildly increased signal on proton density and T2-weighted images. Advanced imaging techniques (T1 and T2 relaxation and diffusion basis spectrum imaging) compared measures of myelin, axons, oedema and inflammation between males and females with multiple sclerosis in normal appearing white matter (NAWM) and areas of DAWM. In NAWM, males had higher axial diffusivity indicative of axonal damage. In DAWM, MRI measures suggested demyelination in females whereas axonal damage was suggested in males. Both sexes show increased T1, GMT2 and water content in DAWM likely related to oedema.
Introduction
Although the normal appearing white matter (NAWM) in multiple sclerosis (MS) appears normal on conventional MRI, subtle changes in tissue structure including demyelination, axonal loss and gliosis are present histologically1,2,3. Myelin changes and axonal loss, as well as blood-brain barrier breakdown, are also reported in diffusely abnormal white matter (DAWM), non-focal areas of mildly increased signal on proton density and T2-weighted images, which is found in the brain of some people with MS4,5,6,7,8.A number of advanced MRI techniques are sensitive to changes in myelin, axons, oedema and inflammation and may give more information about the underlying tissue pathology in NAWM and DAWM. The fraction of water within the myelin bilayers (myelin water fraction, MWF9) has been histopathologically validated as a marker for myelin10. T1 relaxation is closely related to water content (WC)11 and geometric mean T2 (GMT2) relaxation is related to tissue structure. Diffusion basis spectrum imaging (DBSI) models myelinated and demyelinated axons as anisotropic diffusion tensors, and models cells and extracellular space as isotropic diffusion tensors to simultaneously quantify axonal injury, myelination, inflammation and oedema12. Numerous measurements can be derived from the DBSI data including: axial diffusivity (related to axonal integrity), radial diffusivity (modulated by myelin13), fibre fraction (a measure of the axon density14), isotropic restricted diffusion fraction (changes in cellularity resulting from inflammation) and the isotropic hindered diffusion fraction (increases with vasogenic oedema14). These quantitative approaches can be used to study tissue damage in people with MS with different demographic characteristics, potentially providing insight into disease mechanisms.
Sex is an important demographic variable in MS with the disease affecting approximately 3 times as many women as men, although men may have a faster rate of disability progression15. Previous smaller studies have shown that men tend to have fewer enhancing lesions but more lesions evolving into black holes16 and a trend for males to have a higher lesion load17. However, more recent larger studies report no sex-based differences for lesion load and number of enhancing lesions18. Sex differences between normalised white and grey matter volumes were described in relapsing remitting MS (RRMS) but no differences were found for normalised brain volume (NBV), magnetization transfer ratio or diffusion tensor imaging measures for a large MS cohort19. In this study, we used advanced imaging techniques to compare measures of myelin, axons, oedema and inflammation in NAWM and areas of DAWM between males and females.
Objective
To compare MWF, T1, GMT2, WC and DBSI-derived metrics in NAWM and DAWM between males and females with MS.Methods
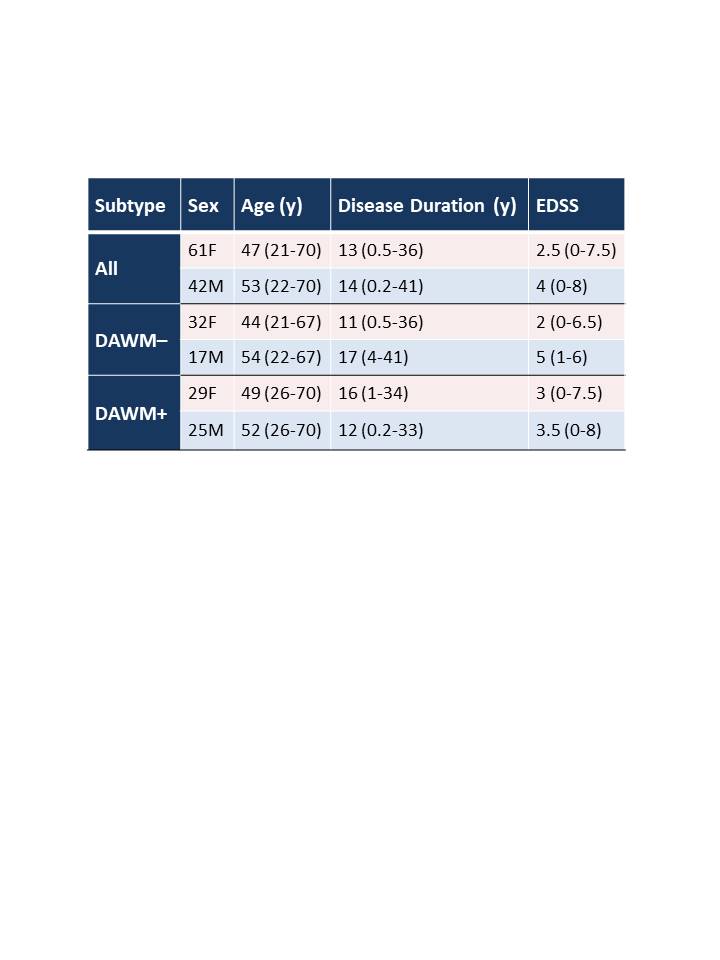
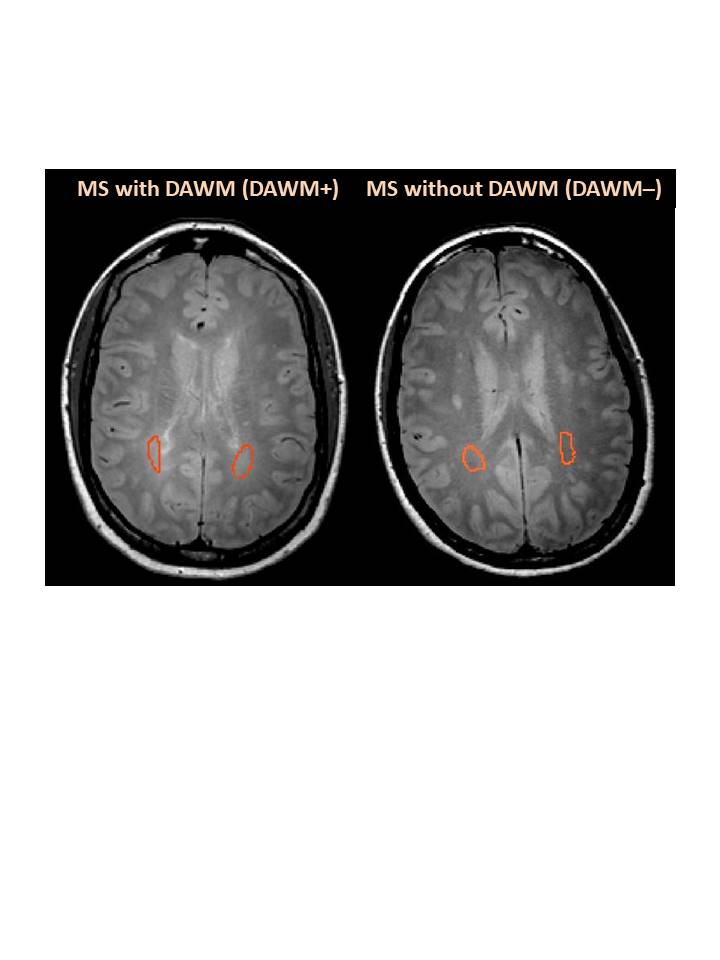
Subjects and MR Experiments: 103 MS participants were scanned on a 3T Philips Achieva scanner (patient demographics in Table 1). Scanning sequences included 48-echo GRASE T2 relaxation (TR/TE=1073/8ms, 1x1x2.5mm3, 40 slices)20, inversion recovery T1 (TIs=150,400,750,1200,2100ms, TR=3000ms, 1x1x2.5mm3, 40 slices), DBSI (99 directions, range of b values=0-1500, TR/TE=4798/79ms, 2x2x2mm3, 40 slices)14, structural proton-density (PD)/T2-weighted (TR/TE1/TE2=2900/8.42/80ms, 1x1x3mm3), and 3DT1-MPRAGE (TR/TE/TI=3000/3.5/926ms, 1x1x1mm3).Data Analysis: Voxel-wise T2 distributions were calculated using a modified Extended Phase Graph algorithm combined with regularized non-negative least squares and flip angle optimization21,22. MWF was defined as the fraction of signal with T2<40ms and GMT2 of the intra/extracellular water pool was calculated for T2s between 40 and 200ms. T1 was fit to a single exponential using in-house software. DBSI data was analysed to calculate diffusivities, fibre fraction, hindered isotropic diffusion fraction and restricted isotropic diffusion fraction maps14. WC was calculated using the reference method23. MWF, GMT2, T1, DBSI-derived metrics, WC and 3DT1 images were registered to PD images using FLIRT (FSL toolbox)24. NAWM masks were created using FAST25 on the registered 3DT1. Participants with DAWM (DAWM+) and without DAWM (DAWM–) were identified. DAWM and similarly located NAWM areas in the DAWM– subjects were delineated (Figure 1). Masks were overlaid onto registered MWF, GMT2, T1, WC and DBSI-derived maps to obtain mean measurements. NBV was calculated using in-house software26. Cortical thickness was determined with Advanced Normalization Tools (ANTs)27. Thalamic volumes were calculated with FIRST28. After normality confirmation, comparisons were done using an unpaired t-test.
Results
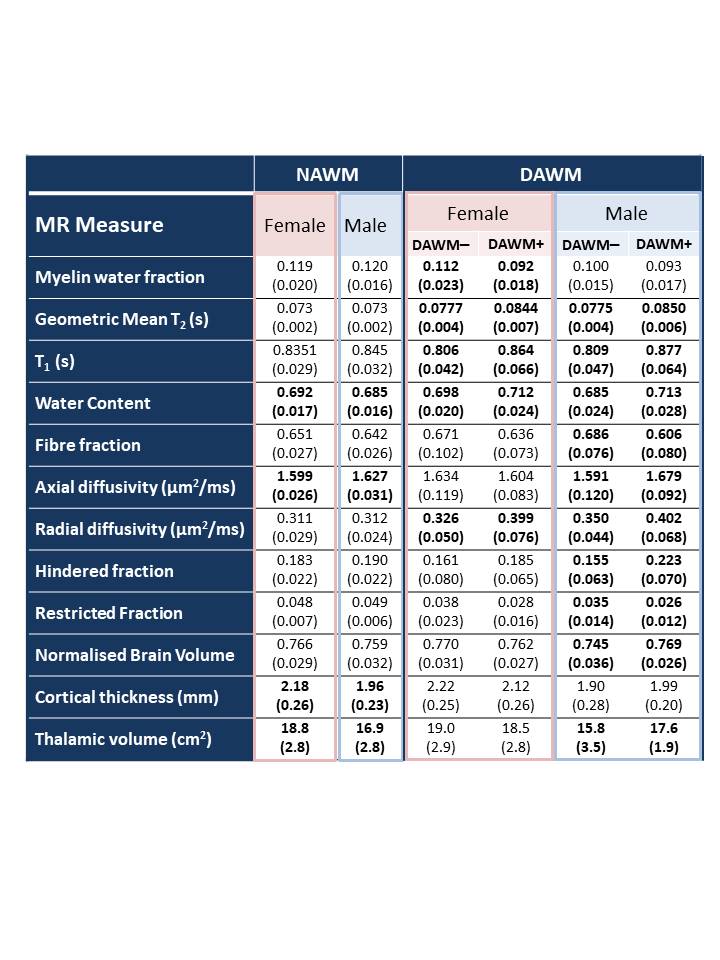
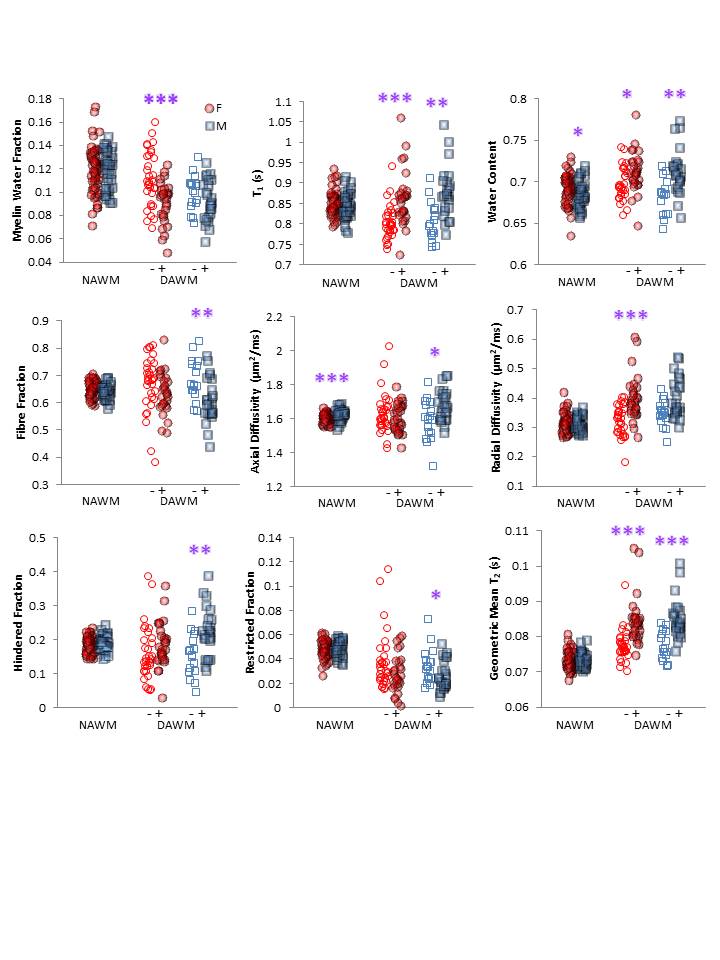
Relative to females, males had significantly higher NAWM axial diffusivity (+1.75%, p<0.0001), lower NAWM water content (-1.0%, p=0.04), smaller cortical thickness (-10%, p<0.0001) and smaller thalamic volume (-10%, p=0.001) (Table 2). Figure 2 shows comparison of regions of DAWM (DAWM+) and similarly located NAWM (DAWM–). Females showed significantly lower MWF (-17.9%) and higher T1 (+7.2%), WC (+2.0%), radial diffusivity (+22.4%) and GMT2 (+8.6%), while males showed higher T1 (+8.4%), WC (+4.1%), axial diffusivity (+5.5%), radial diffusivity (+14.9%), hindered fraction (43.9%), GMT2 (9.7%) and lower fibre fraction (-11.7%), restricted fraction (-25.7%), normalised brain volume (-3.2%) and thalamic volume (-11.4%).Conclusions
Our findings show that males have a higher axial diffusivity in global NAWM indicative of axonal damage. In DAWM, females appear to have changes in MRI measures consistent with demyelination whereas males have changes suggestive of axonal damage. Both females and males show increased T1, GMT2 and water content in areas of DAWM likely related to oedema. Knowledge about sex-based differences in NAWM and DAWM tissue damage could provide insight into differences in disease mechanisms between males and females with MS, as well as be important for future therapeutic trial design.Acknowledgements
We would like to thank the MS volunteers and the staff at the UBC MRI Research Centre. This study was funded by the Multiple Sclerosis Society of Canada.References
1. Allen IV and McKeown SR. A histological, histochemical and biochemical study of the macroscopically normal white matter in multiple sclerosis. J Neurol Sci. 1979; 41: 81-91.
2. Moore GRW and Stadelmann-Nessler C. Demyelinating diseases. In: Love S, Perry A, Ironside J and Budka H eds. Greenfield's Neuropathology. 9th ed.. Boca Raton, FL: Taylor &Francis/CRC Press, 2015, pp.1297-1412.
3. Evangelou N, Esiri MM, Smith S, et al. Quantitative pathological evidence for axonal loss in normal appearing white matter in multiple sclerosis. Ann Neurol. 2000; 47: 391–395.
4. Laule C, Pavlova V, Leung E, Zhao G, MacKay AL, Kozlowski P, Traboulsee AL, Li DK, Moore GR. Diffusely abnormal white matter in multiple sclerosis: further histologic studies provide evidence for a primary lipid abnormality with neurodegeneration. J Neuropathol Exp Neurol. 2013; 72: 42-52.
5. Moore GR, Laule C, Mackay A, Leung E, Li DK, Zhao G, Traboulsee AL, Paty DW. Dirty-appearing white matter in multiple sclerosis: preliminary observations of myelin phospholipid and axonal loss. J Neurol. 2008; 255: 1802-11.
6. Vos CM, Geurts JJ, Montagne L, van Haastert ES, Bö L, van der Valk P, Barkhof F, de Vries HE. Blood-brain barrier alterations in both focal and diffuse abnormalities on postmortem MRI in multiple sclerosis. Neurobiol Dis. 2005; 20: 953-60.
7. Vertinsky AT, Li DKB, Vavasour IM, Miropolsky V, Zhao G, Zhao Y, Riddehough A, Moore GRW, Traboulsee A, Laule C. Diffusely Abnormal White Matter, T2 Burden of Disease, and Brain Volume in Relapsing-Remitting Multiple Sclerosis. J Neuroimaging. 2019; 29: 151-159.
8. Vrenken H, Seewann A, Knol DL, Polman CH, Barkhof F, Geurts JJ. Diffusely abnormal white matter in progressive multiple sclerosis: in vivo quantitative MR imaging characterization and comparison between disease types. AJNR Am J Neuroradiol. 2010; 31: 541-8.
9. MacKay A, Whittall K, Adler J, et al. In vivo visualization of myelin water in brain by magnetic resonance. Magn Reson Med. 1994; 31(6): 673-677.
10. Laule C, Kozlowski P, Leung E, et al. Myelin water imaging of multiple sclerosis at 7 T: correlations with histopathology. Neuroimage. 2008; 40(4): 1575-1580.
11. Fatouros PP, Marmarou A, Kraft KA, et al. In Vivo Brain Water Determination by T1 Measurements: Effect of Total Water Content, Hydration Fraction, and Field Strength. Magn Reson Med. 1991; 17(2): 402-413.
12. Wang Y, Wang Q, Haldar JP, et al. Quantification of increased cellularity during inflammatory demyelination. Brain. 2011; 134: 3590–3601.
13. Song SK, Sun SW, Ju WK, et al. Diffusion tensor imaging detects and differentiates axon and myelin degeneration in mouse optic nerve after retinal ischemia. Neuroimage. 2003; 20: 1714–22.
14. Wang Y, Sun P, Wang Q, et al. Differentiation and quantification of inflammation, demyelination and axon injury or loss in multiple sclerosis. Brain. 2015; 138: 1223–1238.
15. Golden LC and Voskuhl R. The importance of studying sex differences in disease: The example of multiple sclerosis. J Neurosci Res. 2017; 95: 633-643.
16. Pozzilli, C, Tomassini, V, Marinelli, F, Paolillo, A, Gasperini, C, Bastianello, S. ‘Gender gap’ in multiple sclerosis: magnetic resonance imaging evidence. Eur J Neurol. 2003; 10: 95–97.
17. van Walderveen, MA, Lycklama, ANGJ, Ader, HJ, et al. Hypointense lesions on T1-weighted spin-echo magnetic resonance imaging: relation to clinical characteristics in subgroups of patients with multiple sclerosis. Arch Neurol. 2001; 58: 76–81.
18. Fazekas F, Enzinger C, Wallner-Blazek M, Ropele S, Pluta-Fuerst A, Fuchs S. Gender differences in MRI studies on multiple sclerosis. Journal of the Neurological Sciences. 2009; 286: 28–30.
19. AntulovR, Weinstock-Guttman B, Cox JL, Hussein S, Durfee J, Caiola C, Dwyer MG, Bergsland N, Abdelrahman N, Stosic M, Hojnacki D, Munschauer FE, Miletic D, Zivadinov R. Gender-related differences in MS: a study of conventional and nonconventional MRI measures. Multiple Sclerosis. 2009; 15: 345–354.
20. Zhang J, Vavasour I, Kolind S, et al. Advanced Myelin Water Imaging Techniques for Rapid Data Acquisition and Long T2 Component Measurements. ISMRM. 2015; p824.
21. Prasloski T, Mädler B, Xiang Q-S, et al. Applications of stimulated echo correction to multicomponent T2 analysis. Magn Reson Med. 2012; 67: 1803–1814.
22. Whittall KP and MacKay AL. Quantitative interpretation of NMR relaxation data. J Magn Reson. 1989; 84: 134–152.
23. Meyers SM, Kolind SH, MacKay AL. Simultaneous measurement of total water content and myelin water fraction in brain at 3T using a T2 relaxation based method. Magn Reson Imaging. 2017;37:187-194.
24. Jenkinson M, Bannister PR, Brady JM, and Smith SM. Improved optimisation for the robust and accurate linear registration and motion correction of brain images. NeuroImage. 2002; 17(2):825-841.
25. Zhang Y, Brady M, Smith S. Segmentation of brain MR images through a hidden Markov random field model and the expectation-maximization algorithm. IEEE Trans Med Imag. 2001; 20(1):45-57, 2001.
26. Wicks E, Chiu JPC, Tang LYW, Lam K, Riddehough A, Li DKB, Traboulsee A, Tam R. Automatic Computation of Normalized Brain Volume on 3D T1-Weighted MRI Scans Without Registration to Standard Space, ISMRM. 2015, 3750.
27. Das SR, Avants BB, Grossman M, Gee JC. Registration based cortical thickness measurement. Neuroimage. 2009; 45: 867-79.
28. Patenaude B, Smith SM, Kennedy D, Jenkinson M. A Bayesian Model of Shape and Appearance for Subcortical Brain NeuroImage. 2011; 56: 907-922.
Figures