0059
Mapping temporal changes in myelin properties of newly formed Multiple Sclerosis lesions1Advanced Imaging Research Center, Oregon Health & Science University, Portland, OR, United States, 2Department of Neurology, Oregon Health & Science University, Portland, OR, United States, 3Kaiser Sunnyside Medical Center, Clackamas, OR, United States, 4Oregon Health & Science University, Portland, OR, United States, 5Myelin Repair Foundation, Saratoga, CA, United States, 6Department of Behavioral Neuroscience, Oregon Health & Science University, Portland, OR, United States, 7Knight Cardiovascular Institute, Oregon Health & Science University, Portland, OR, United States
Synopsis
A novel MRI T1 relaxometry technique is used to monitor myelin water fraction (MWF) in normal appearing white matter and multiple sclerosis lesions in subjects with newly formed white matter lesions at baseline and a follow-up study after six months. MWF was consistently low in new lesions at baseline and recovery over 6 months was highly variable. T1 relaxometry provides a promising quantitative and non-invasive tool for studying myelin repair in human brain.
Introduction
Myelin restoration holds significant promise in the treatment of multiple sclerosis (MS).1 Non-invasive techniques that provide a sensitive and specific measure of brain myelin are important to better understand the natural history of lesion characteristics and allow more rapid assessment of therapeutic effect. The MRI 1H2O longitudinal relaxation time constant (T1) is sensitive to the local chemical environment and can provide a sensitive and specific non-invasive measure of white matter myelin properties. The goals of this study were to use a novel MRI T1 relaxometry technique to: (1) compare MWF between control white mater (WM) and MS normal appearing WM (NAWM), and (2) determine MWF in newly formed MS lesions, and the extent to which these lesions remyelinate within 6 months.Methods
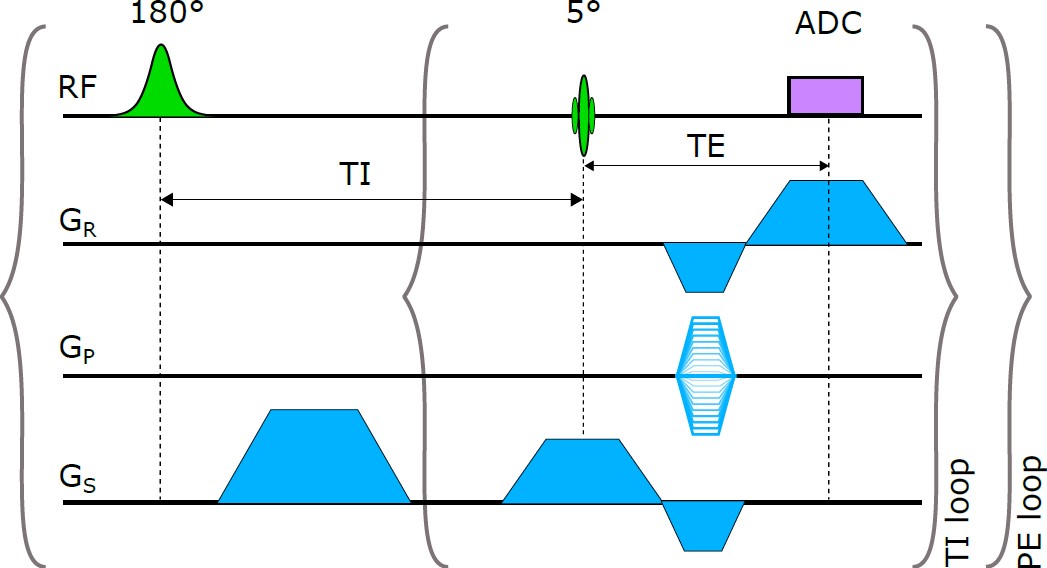
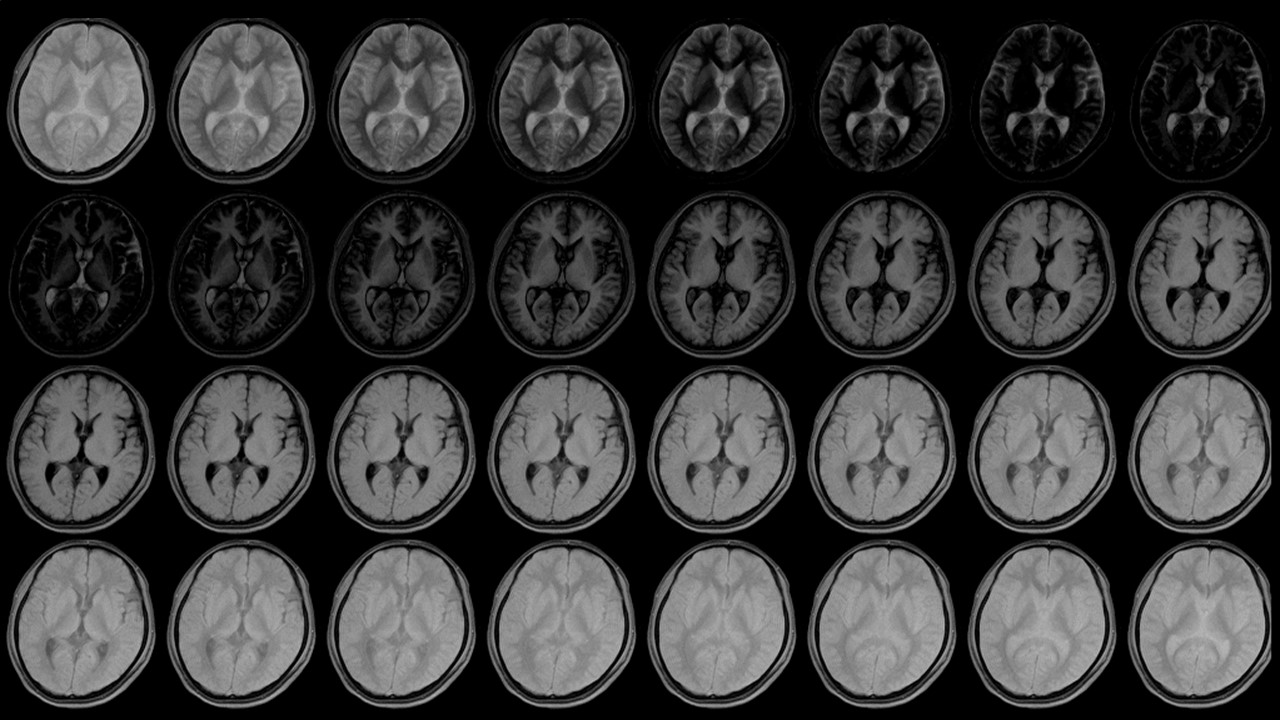
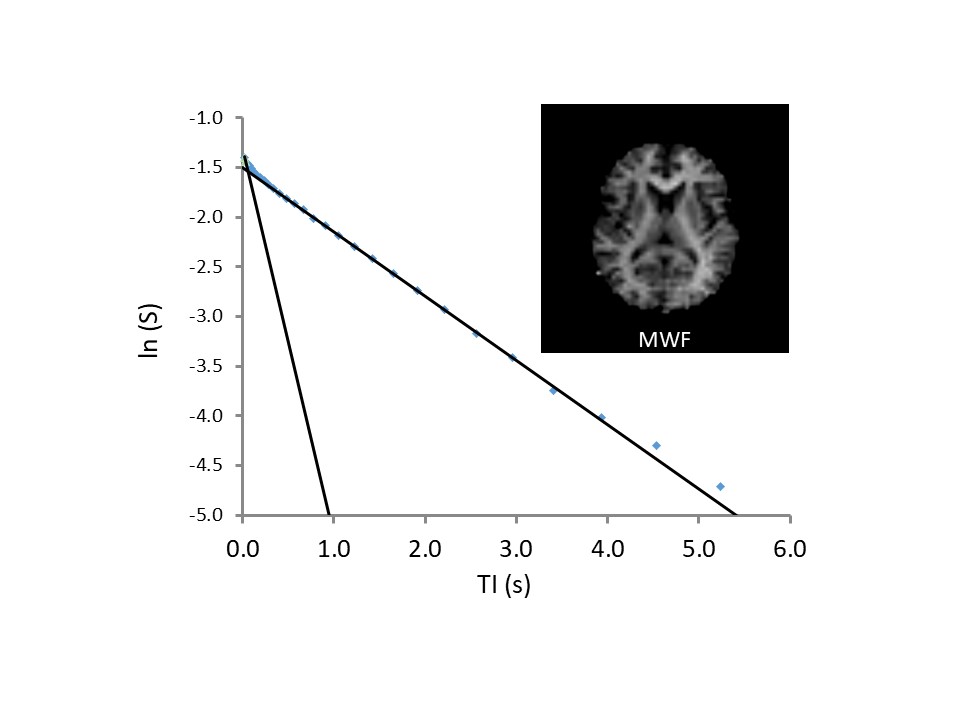
Five MS (21-43 y; 3F) and five control healthy human (30-40 y; 3F) subjects participated under IRB approved prospective observational study. MS subjects with one or more newly detected WM lesions - observed with gadolinium contrast enhanced T1- and T2-weighted clinical scans - were referred from local MS clinics and participated within two weeks of the initial observation of the lesion(s). Whole brain MPRAGE images were acquired on a 7T MAGNETOM system (Siemens, Erlangen, Germany) using a 24-channel array RF coil (Nova Medical, Wilmington, MA) for co-registration and planning purposes (TI/TE/TR/α/data matrix/res/TA = 1.05 s/3.1 ms/2.2 s/7°/320x320x240/0.7 mm isotropic/6.6 min). For MS subjects, clinical scans were co-registered to MPRAGE set and used to plan 1 or 2 slice(s) containing enhancing lesions for T1-relaxometry measurements. A highly sampled inversion recovery (IR) technique – progressively unsaturated relaxation during perturbed recovery from inversion (PURR) sequence (Figure 1) with 32 inversion time points was implemented to acquire 5 mm thick slice (TI/TE/TR/α/data matrix/res/TA = 0.017‑8.0 s/7 ms/14.0 s/5°/168x192/(1.5 mm)2/19.6 min).2,3 For control subjects, PURR data was acquired for two slices positioned parallel to AC-PC line: a) superior to lateral ventricles and b) containing deep gray matter structures.A multi-exponential fitting procedure was used on a voxel-wise basis to decompose IR recovery curves into short and long T1 components (Figures 2 and 3). The short T1 component was assigned to myelin associated water, and its amplitude was used to calculate MWF (Figure 3). Tissue water content was quantified and used to correct MWF. MS subjects had a follow-up repeat study 6 months (Gd+6) after the baseline visit.
Results
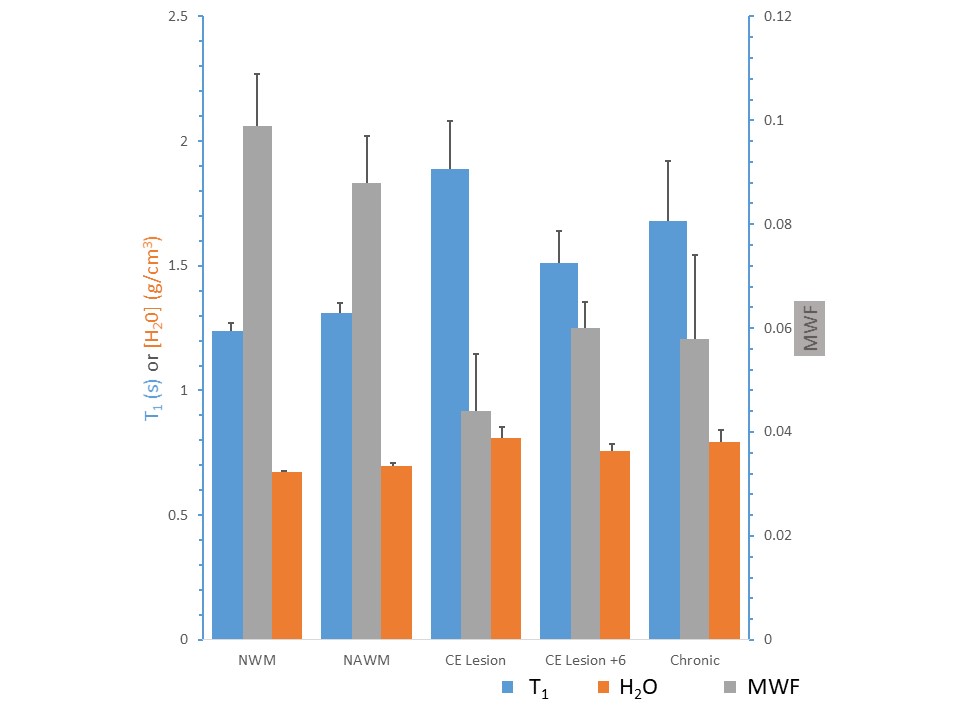
Five MS participants completed the study with a total of 12 contrast enhanced lesions identified at baseline. Five age and sex matched control subjects were enrolled for comparative data. MWF results were the following [mean (SD)]: control WM: 0.099 (0.010); NAWM 0.091 (0.010); Gd+ lesions: 0.044 (0.012); Gd+6: 0.060 (0.005); chronic lesions: 0.058 (0.016).Discussion and Conclusions
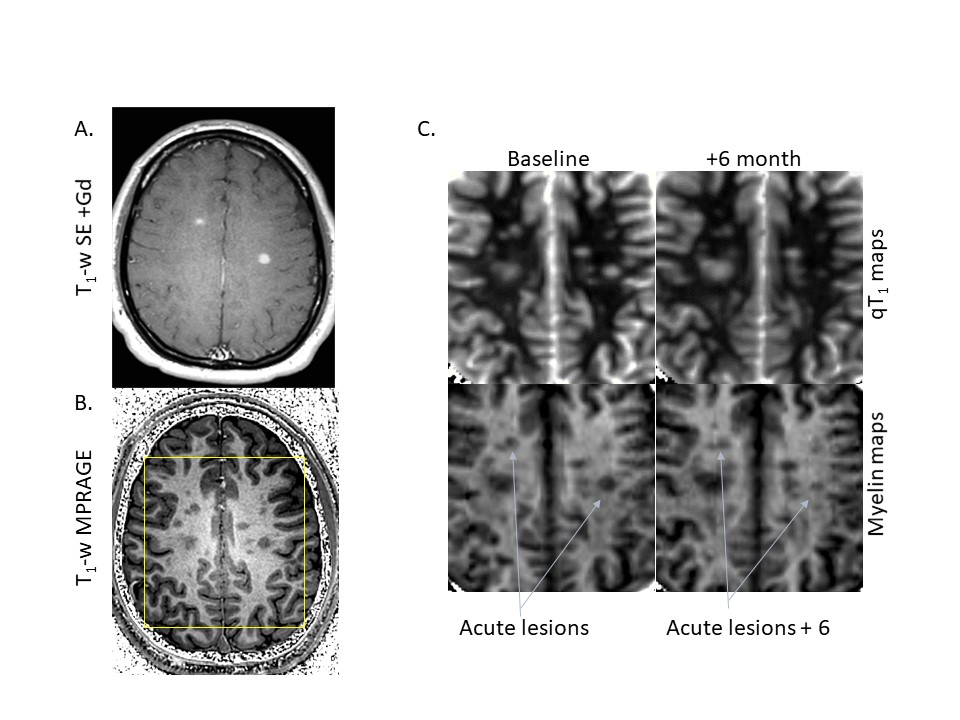
7T T1 relaxometry provides reliable quantification of myelin associated H2O in brain. MWF was decreased in MS compared to control WM; 8% in NAWM (P <0.02); 56% in Gd+ lesions (P<0.0001); and 40% in chronic lesions (P <0.0001). Gd+ lesions reported an increase in MWF at 6 months compared to baseline (range: 2.5-40% increase; P < 0.005, Figures 4 and 5). On average, by 6 months new MS lesions were found to remyelinate by 20%, with marked variability between lesions. This novel technique can effectively monitor water content as well as myelin water fraction. It can be a useful non-invasive and quantitative method to investigate myelin repair in human brain.Acknowledgements
Grant support: Myelin Repair FoundationReferences
1. Chang A, Staugaitis SM, Dutta R, Batt CE, Easley KE, Chomyk AM, Yong VW, Fox RJ, Kidd GJ, Trapp BD. Cortical remyelination: A new target for repair therapies in multiple sclerosis. Ann. Neuro. 2012;72:918-926.
2. Labadie C, Lee J-H, Vetek G, Springer CS. Relaxographic imaging. J Magn Reson B. 1994;105:99–112.
3. Labadie C, Lee J-H, Rooney WD, Jarchow S, Aubert-Frecon M, Springer CS, Moller HE. Myelin Water Mapping by Spatially Regularized Longitudinal Relaxographic Imaging at High Magnetic Fields. Magn Reson Med. 2014;71:375-387.
Figures