0056
Improved T2*-weighted MRI of multiple sclerosis through joint motion and B0 correction1National Institute of Neurological Disorders and Stroke, National Institutes of Health, Bethesda, MD, United States
Synopsis
T2*-weighted MRI at high field is a promising tool to detect and characterize multiple sclerosis (MS) lesions. However, its high sensitivity to motion-induced B0 field changes limits the successful application of this technique in routine clinical use. In this study, we evaluated our recently developed motion and B0 correction method using a navigator-based 3D GRE acquisition for imaging MS lesions at 7 T.
INTRODUCTION
T2*-weighted (T2*w) MRI is a promising technique to detect multiple sclerosis (MS) lesions because of the magnetic field (B0) effect caused by demyelination and changes in iron content1–3. The enhanced contrast-to-noise ratio of T2*w MRI at 7 T can potentially lead to better understanding about the cortical MS lesion and improved treatment outcome4. However, application of T2*w MRI is challenged by its sensitivity to B0 changes from other sources, including head motion and respiration. In a previous study5,6, a time-resolved volumetric EPI (echo-planar imaging) navigator and a retrospective correction algorithm were developed for correcting the T2*w MRI affected by motion and motion-induced B0 changes. Here, we performed an initial study to demonstrate the value of this navigator-based method in MS imaging.METHODS
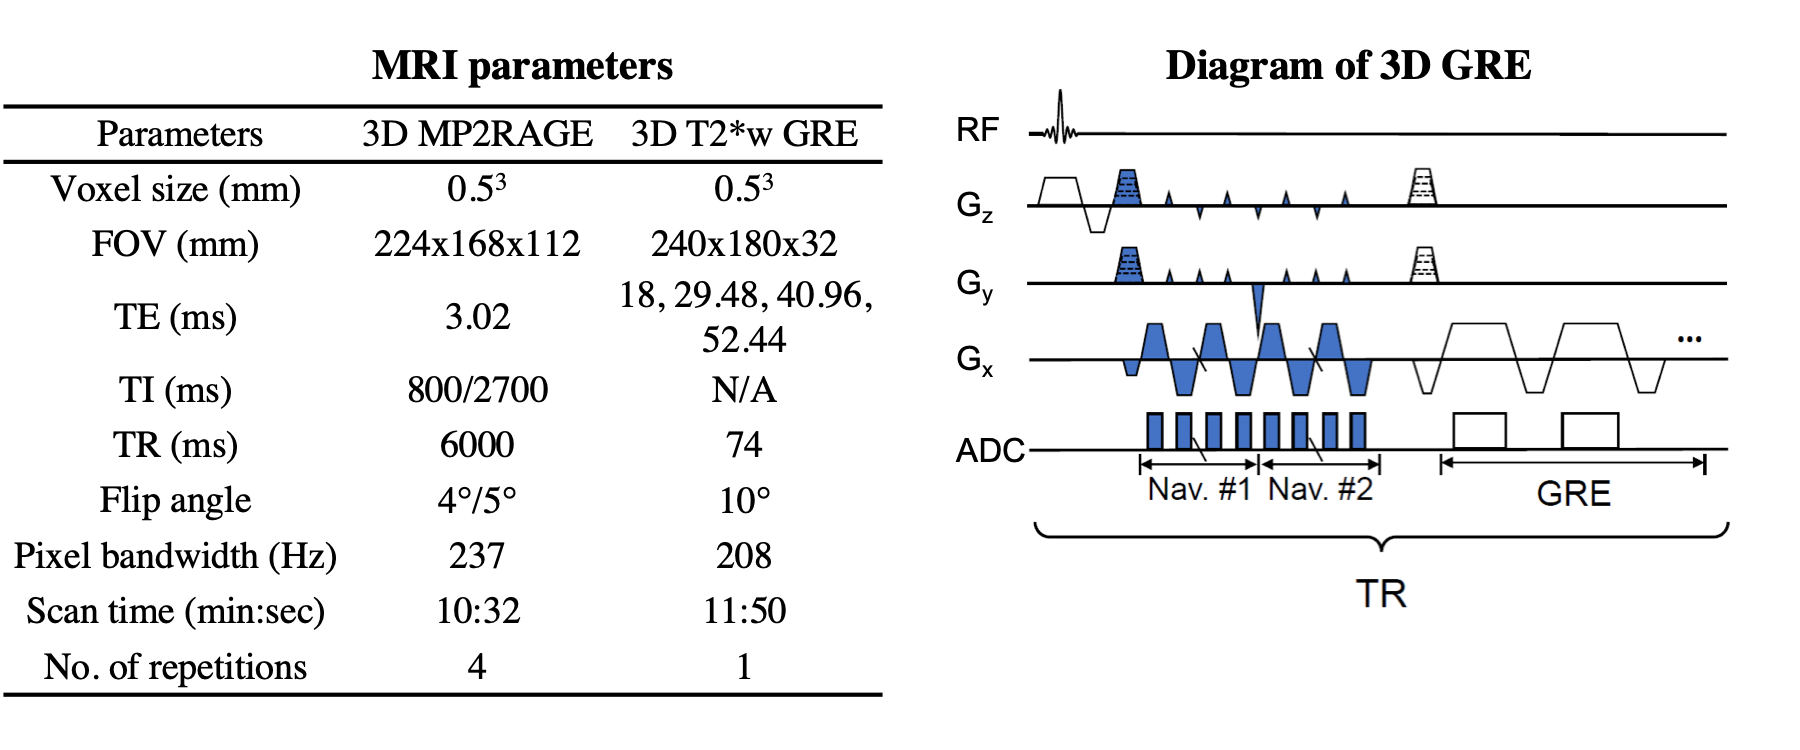
MRI scans Nine adults with MS [3 men; 52 (mean) ± 12 (standard deviation) years old] were scanned on a 7 T MRI (Siemens) equipped with a 32-channel head-only radiofrequency coil (Nova Medical). The navigator-based 3D T2*w gradient echo (GRE) MRI sequence was applied at an isotropic 0.5 mm resolution. Fig. 1 illustrates the acquisition of the 3D EPI navigator and high-resolution GRE data in this sequence. Up to 3 slabs (top, middle, and bottom along the head-foot direction) of T2*w images with 32 mm slab thickness were acquired in each patient to cover the brain. A total of 18 T2*w scans were obtained. In addition, a T1-weighted (T1w) 3D MP2RAGE (Magnetization Prepared 2 Rapid Acquisition Gradient Echoes) sequence7,8 at 0.5 mm isotropic resolution was used to cover the whole brain. Parameters of these two MRI methods are shown in Fig. 1. The navigator was acquired at a spatial resolution of 6x5.625x2.5 mm3 and temporal resolution of 0.6 s (8 TRs).Image reconstruction The T1w MP2RAGE was reconstructed using the Siemens research sequence package (Work-in-Progress Package #900B). The T1w images in four repetitions were aligned, and the median intensity was assigned to each voxel. The T2*w images were reconstructed using an in-house Matlab-based program to correct for rigid-body motion and linear B0 changes (zeroth and first order), which were estimated from the navigator images. Because of the small extent of motion during the scans in this study, as derived from the navigator, nonlinear B0 correction was not required, saving image reconstruction time. Two different levels of correction were carried out: (1) motion and linear B0 correction (MoCo+B0Co), (2) global B0 correction (gB0Co, only zeroth order). T2*w magnitude images were averaged across echoes, aligned and resampled to match the processed T1w images.
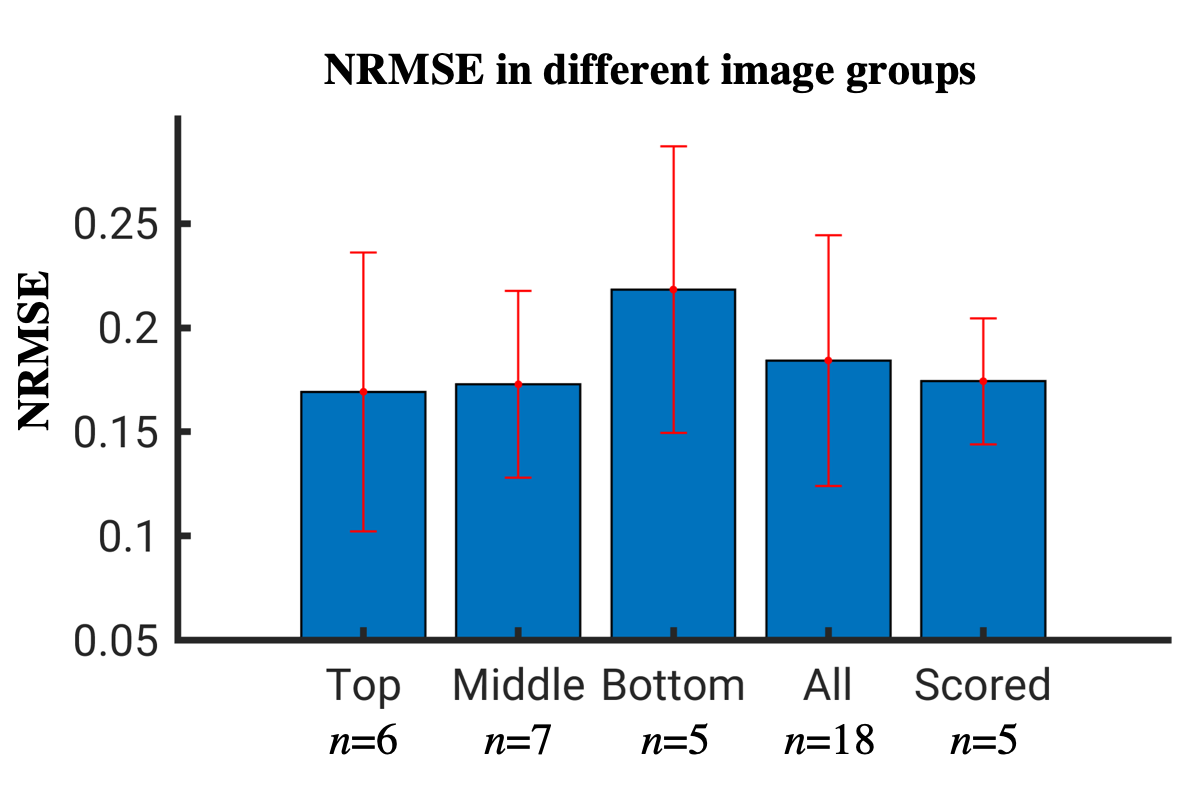
Image analysis The T2*w image quality was evaluated by two experienced, blinded MRI raters. One set of T2*w MoCo+B0Co and gB0Co images per patient, 5 patients were chosen for the evaluation. These images were selected for the gB0Co images to cover the range of quality levels. All 10 image slabs (2 correction modes and 5 patients) were randomized and rated on a scoring scale from 1 (minimal artifact) to 4 (severe artifact). In addition, the image intensity difference between the MoCo+B0Co and gB0Co modes was calculated as the normalized root mean square error (NRMSE) in all 18 scans.
RESULTS
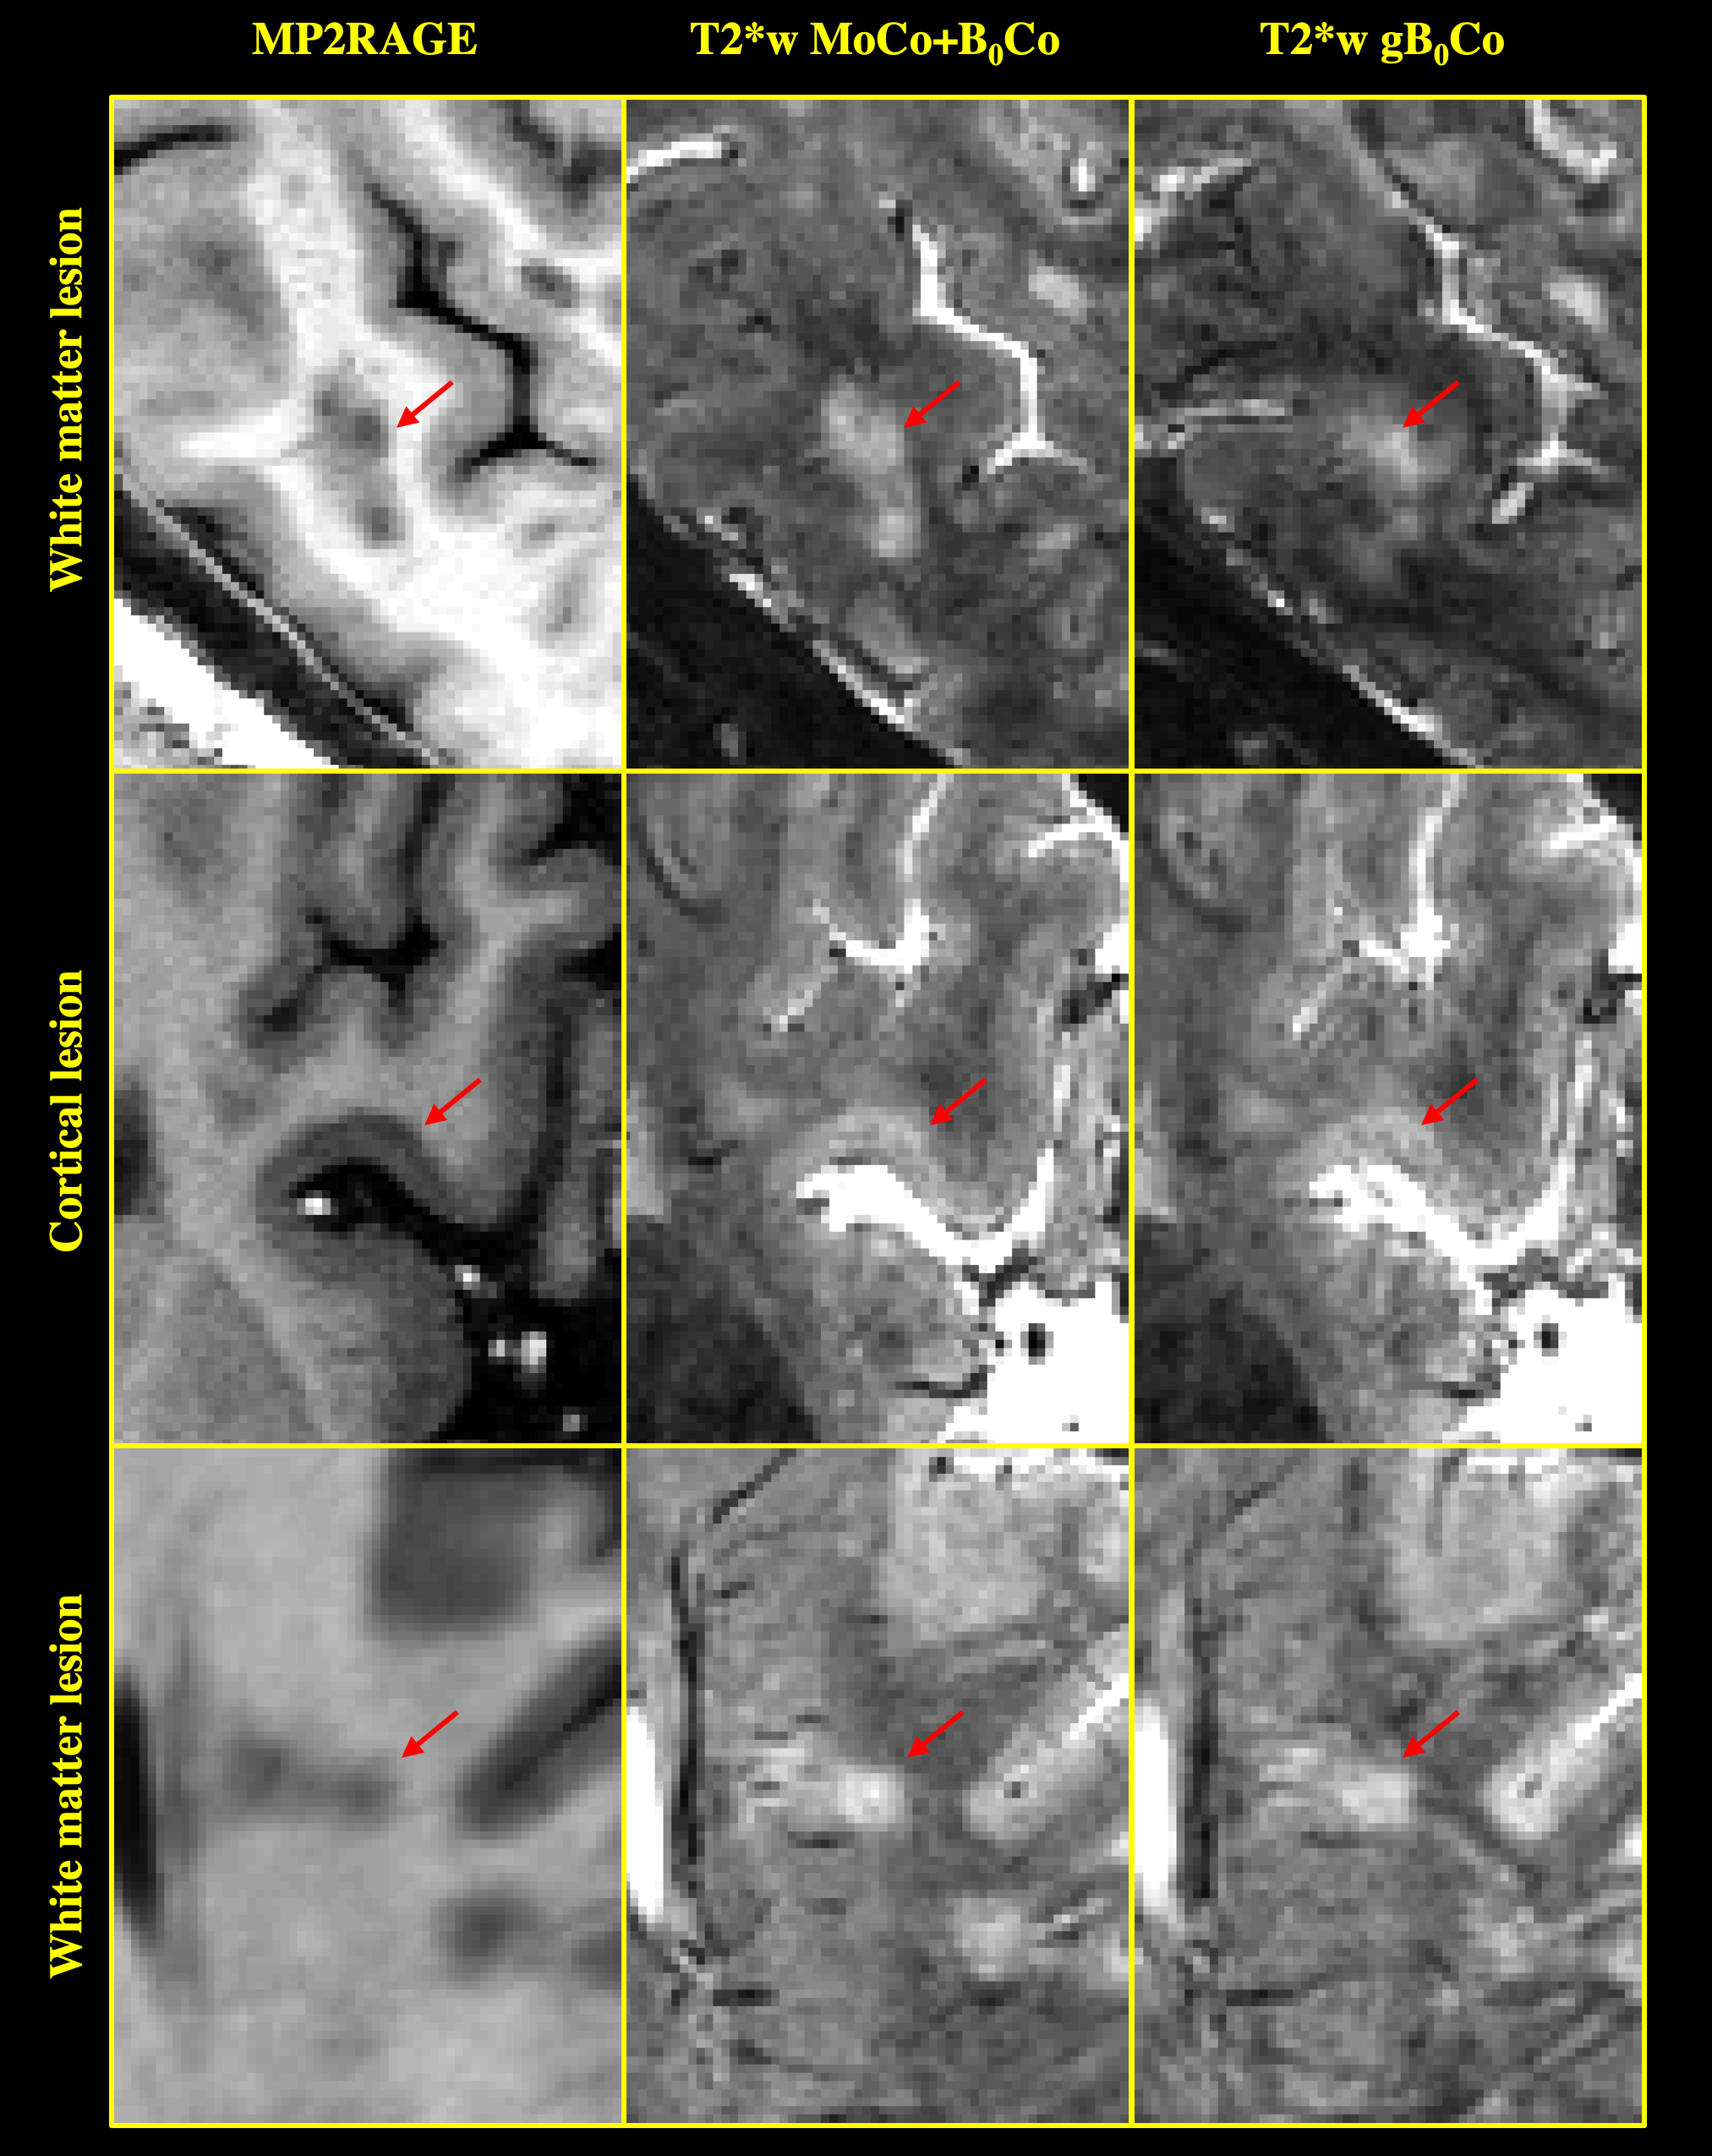
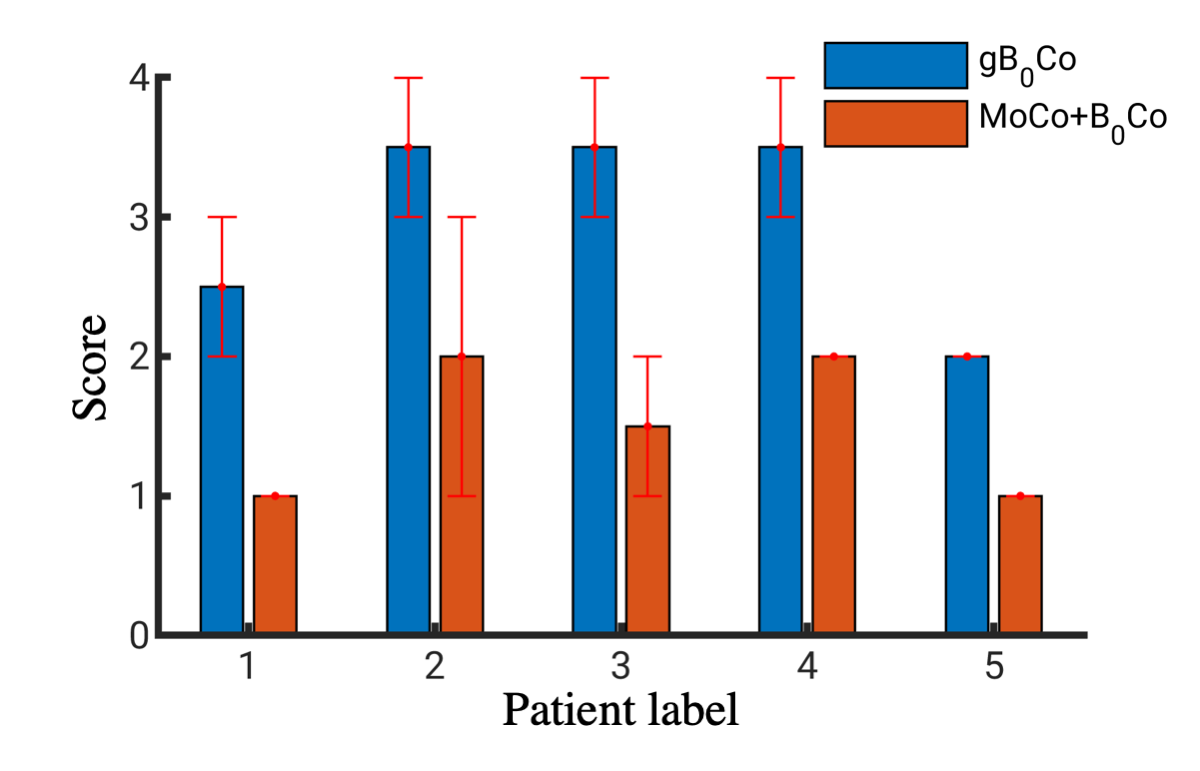
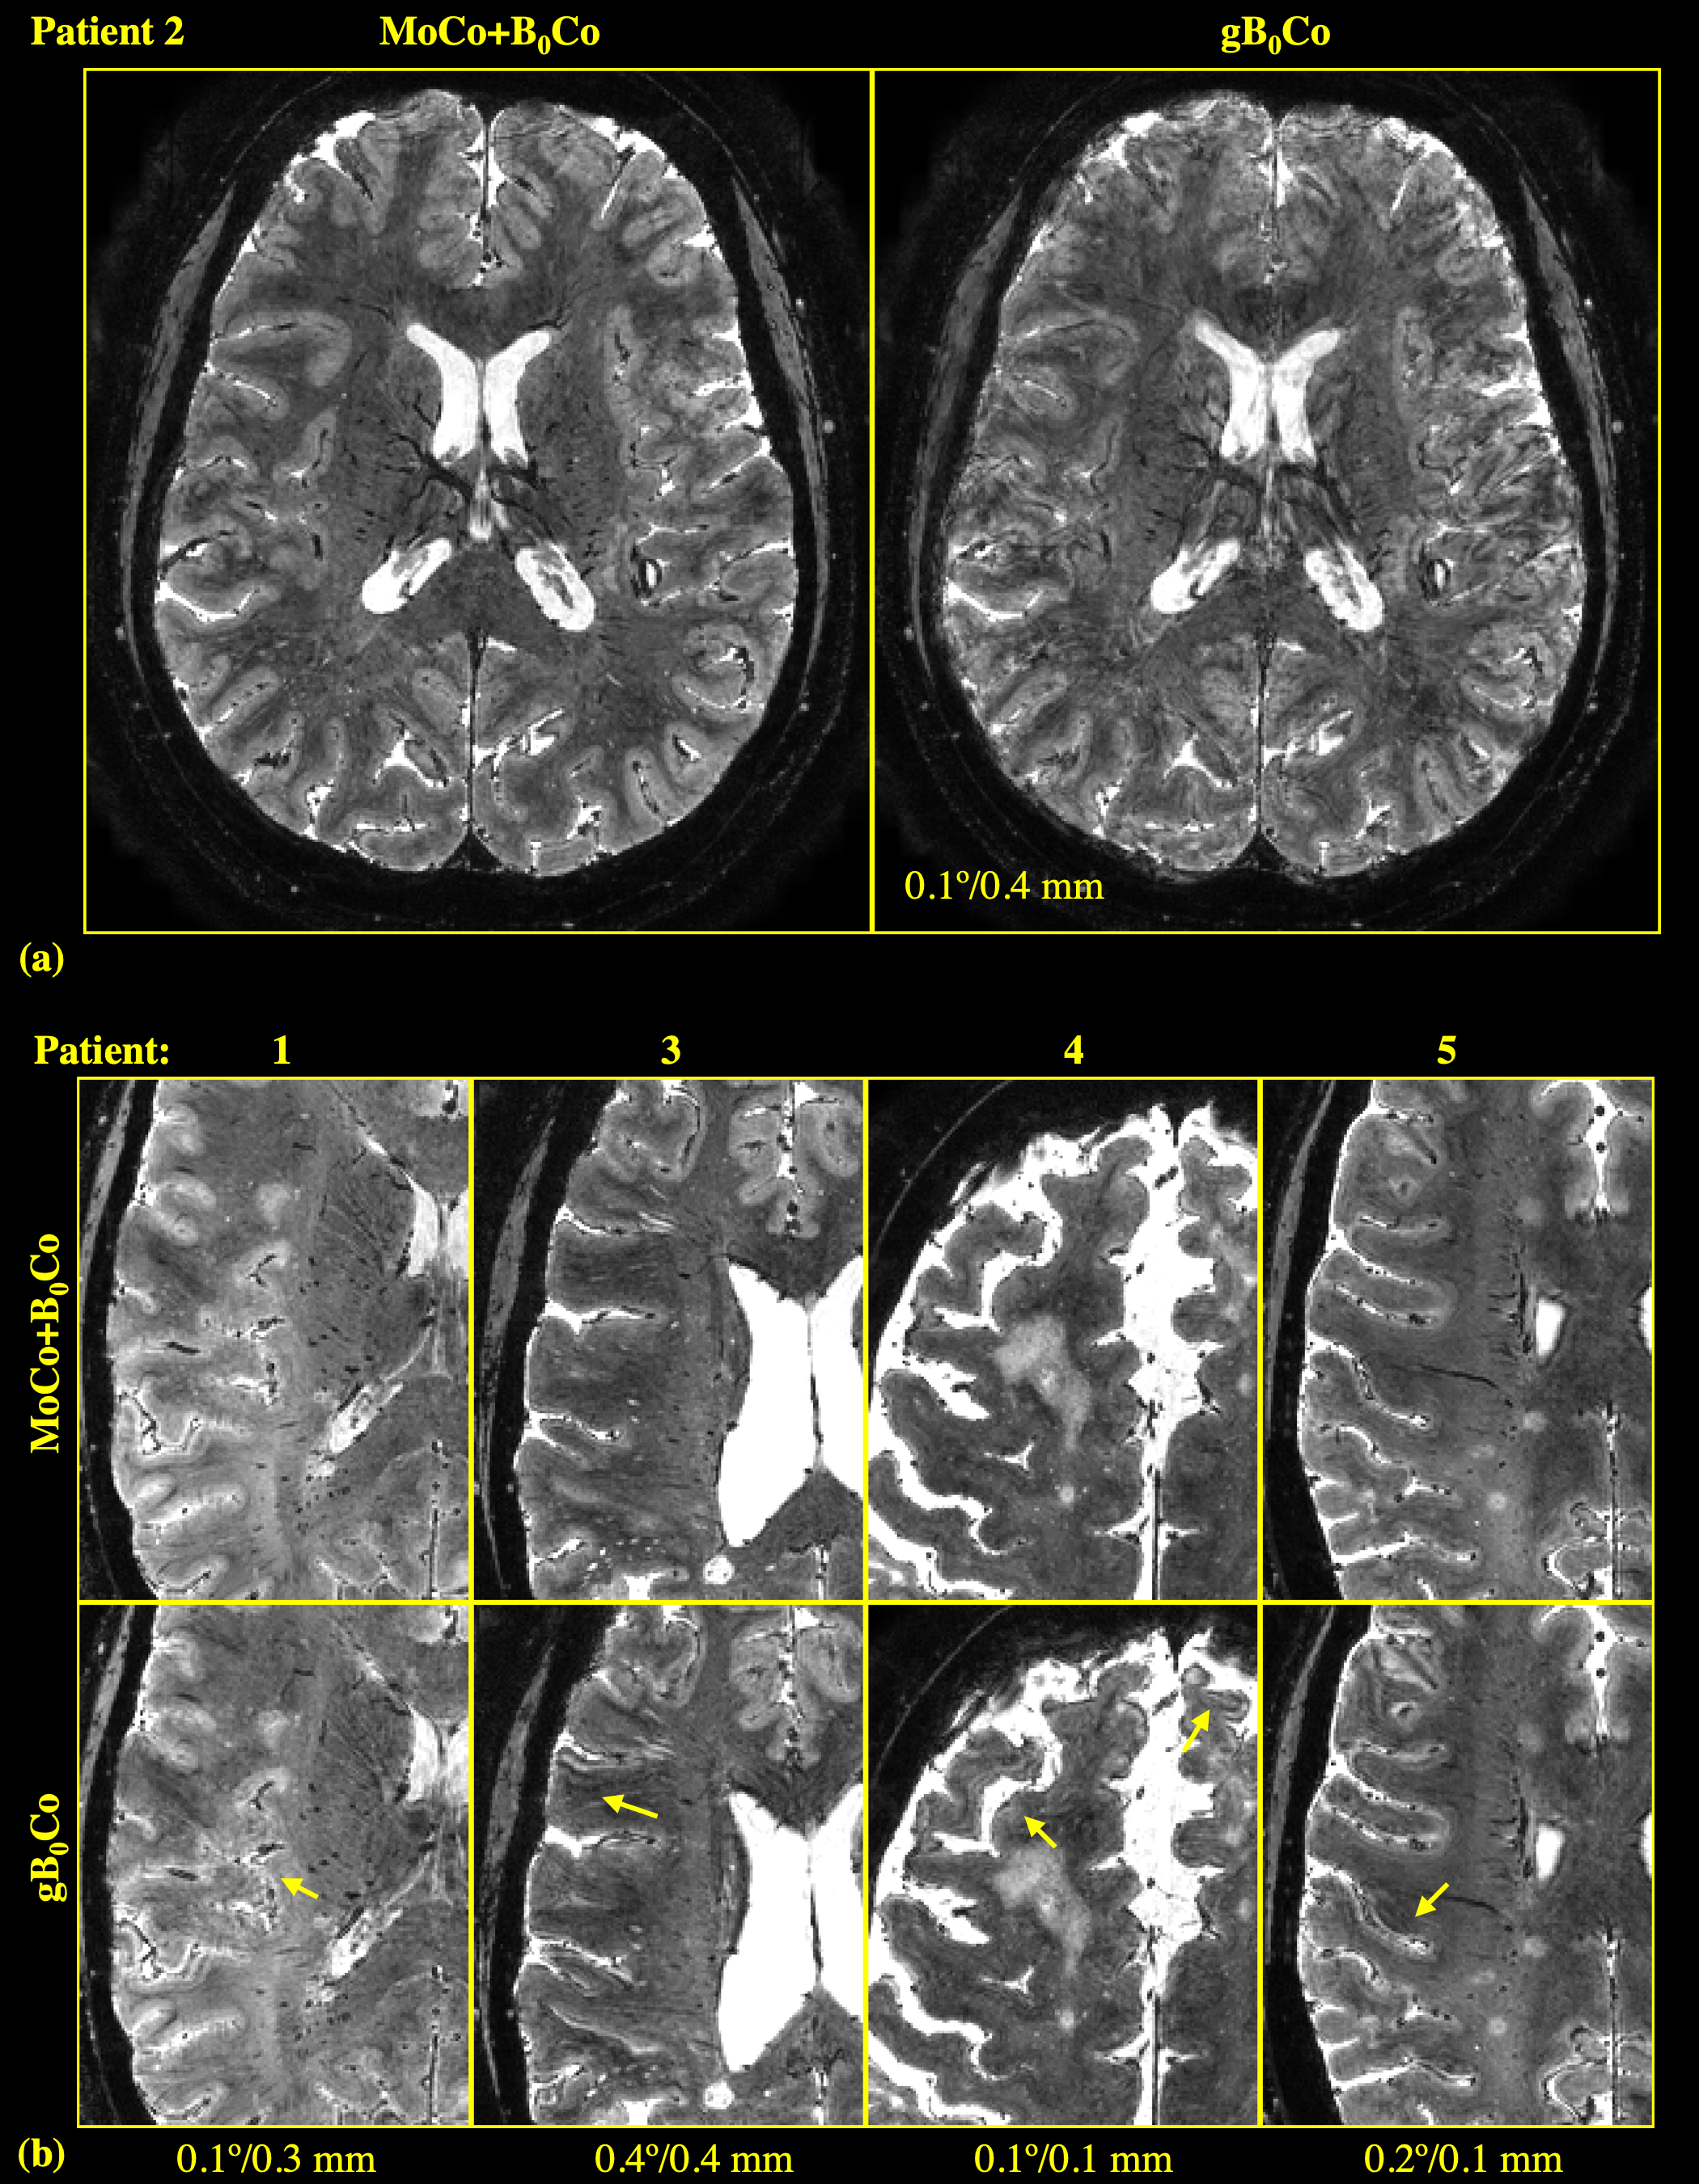
As shown in Fig. 2, MS lesions, including lesions in the cortex, were better defined in the MoCo +B0Co T2*w GRE images than in the gB0Co images. Lesions in the corrected T2*w images agreed better with the T1w MRI. The image quality scores (s) of the five rated T2*w cases are shown in Fig. 3. The across-scan average s of the gB0Co images was 3 while the average s of the MoCo+B0Co images was 1.5. The rated T2*w images are shown in Fig. 4, with patient labels corresponding to those in Fig. 3. Different levels of artifact reduction can be observed when comparing the MoCo+B0Co and gB0Co images in Fig. 4. The NRMSE in all scans is shown in Fig. 5. The NRMSE between the two correction modes was 0.18±0.06 across all slabs and 0.17±0.03 in the rated slabs.DISCUSSION
This was a preliminary study to evaluate a navigator-based, motion-B0-corrected 3D T2*w GRE for detecting MS lesions. The results showed promising performance of the method by improving the T2*w image quality from the moderate-to-severe artifact to the minimal-to-mild artifact range, which translates into enhanced power for lesion delineation, particularly for characterization of cortical lesions.In the current study, only 5 image slabs were rated. However, using NRMSE as a surrogate, the similar NRMSE across all 18 image slabs to that of the rated cases suggested similar improvement is expected from the correction in all cases. This was indeed the case based on visual inspection of all data.
This technique represents a promising solution to address the problem of motion and motion-induced B0 fluctuation, especially at high field. It does not require additional hardware and is practical to be translated to clinical application once successfully established. Future work on evaluating this technique in a large patient cohort is warranted.
Acknowledgements
This work was sponsored by the Intramural Research Program of the National Institute of Neurological Disorders and Stroke.References
1. Bagnato, F. et al. Tracking iron in multiple sclerosis: a combined imaging and histopathological study at 7 Tesla. Brain J. Neurol. 134, 3602–3615 (2011).
2. Filippi, M. et al. Association between pathological and MRI findings in multiple sclerosis. Lancet Neurol. 11, 349–360 (2012).
3. Schindler, M. K., Sati, P. & Reich, D. S. Insights from Ultrahigh Field Imaging in Multiple Sclerosis. Neuroimaging Clin. N. Am. 27, 357–366 (2017).
4. Mainero, C. et al. In vivo imaging of cortical pathology in multiple sclerosis using ultra-high field MRI. Neurology 73, 941–948 (2009).
5. Liu, J., Van Gelderen, P., de Zwart, J. A. & Duyn, J. H. Motion-insensitive 3D T2*-weighted MRI using a motion- and B0 field-navigator. in Proceedings of the 27th Annual Meeting of ISMRM 72 (2019).
6. Liu, J., van Gelderen, P., de Zwart, J. A. & Duyn, J. H. Reducing motion sensitivity in 3D high-resolution T2*-weighted MRI by navigator-based motion and nonlinear magnetic field correction. Neuroimage (In press).
7. Marques, J. P. et al. MP2RAGE, a self bias-field corrected sequence for improved segmentation and T1-mapping at high field. NeuroImage 49, 1271–1281 (2010).
8. Beck, E. S. et al. Improved Visualization of Cortical Lesions in Multiple Sclerosis Using 7T MP2RAGE. AJNR Am. J. Neuroradiol. 39, 459–466 (2018).
Figures