0052
Myelin water imaging is sensitive to white matter fiber orientation in the human brain1UBC MRI Research Centre, University of British Columbia, Vancouver, BC, Canada, 2Department of Neurology, Medical University of Graz, Graz, Austria, 3Department of Physics & Astronomy, University of British Columbia, Vancouver, BC, Canada, 4Department of Pediatrics (Division of Neurology), University of British Columbia, Vancouver, BC, Canada
Synopsis
We demonstrated that the measurement of MWF is considerably influenced by the angle between the white matter fiber tracts and the main magnetic field. Furthermore, we showed that the traditionally used cut-off between myelin water and intra- and extracellular water of 40 ms overestimates MWF.
Introduction
The human brain’s white matter is an highly anisotropic structure, where the orientation of white matter fibers in respect to the main magnetic field B0 affects the magnitude and phase of the complex MRI signal. In general, all MRI techniques which attempt to quantify physiological and pathological white matter have to deal with the white matter's anisotropy. Orientation effects have been reported for a wide range of quantitative MRI parameters such as, R2* relaxation1–5, gradient echo phase2, T1 relaxation6,7, and dynamic susceptibility contrast perfusion measurements conducted with both gradient echo8 and spin echo scans9. The orientation dependency of the gradient echo signal of white matter is extensively studied and ascribed to the anisotropy of the magnetic susceptibility caused by the myelinated nerve fibers. However, the observation that the spin echo signal also depends on the fiber orientation suggests that MWI is potentially affected as well. Therefore, we investigate whether and to what degree the MWF depends on the angle between the white matter tracts and the main magnetic field B0.Methods
We acquired 3D T1, DTI and MWI using a gradient and spin echo (GRASE) sequence and the standard Carr-Purcell-Meiboom-Gill (CPMG) sequence. Eight healthy volunteers (3 female, 5 male) with a mean age of 26 years (age range = 21 – 33 years) and without history of any neurological disorder participated in this study. MR imaging was performed on a 3T Philips Ingenia Elition MR system using a 32-channel head coil. The CPMG sequence was accelerated with compressed SENSE (CS), using a CS factor of 7 and all MWI sequences had 48 echoes with the first echo at TE = 8 ms and ∆TE = 8 ms. DTI analysis was performed using FSL. For MWI analysis, the T2 distributions were calculated using a regularized non-negative least squares (NNLS) algorithm with correction for stimulated echoes and a T2 range of 8 ms to 2.0 s10–13. The multi exponential signal decay is expressed as a T2 distribution where the myelin water component is defined as the T2 components within 8 ms and a cut-off, and the intra- and extracellular water component as the T2 components above this cut-off. The T2 cut-off was set to (I) 40 ms, representing the present standard cut-off and (II) 25 ms, based on inspection of the T2 distribution. The MWF was defined as the ratio of the myelin water T2 components to all T2 components. DTI and MWI data was linearly registered to the 1 mm MNI152 space14 using FLIRT. The fiber orientation was calculated from the angle between the 1st eigenvector to the direction of the main magnetic field2. The MWF, was compared with the corresponding fiber orientation in each WM voxel.Results
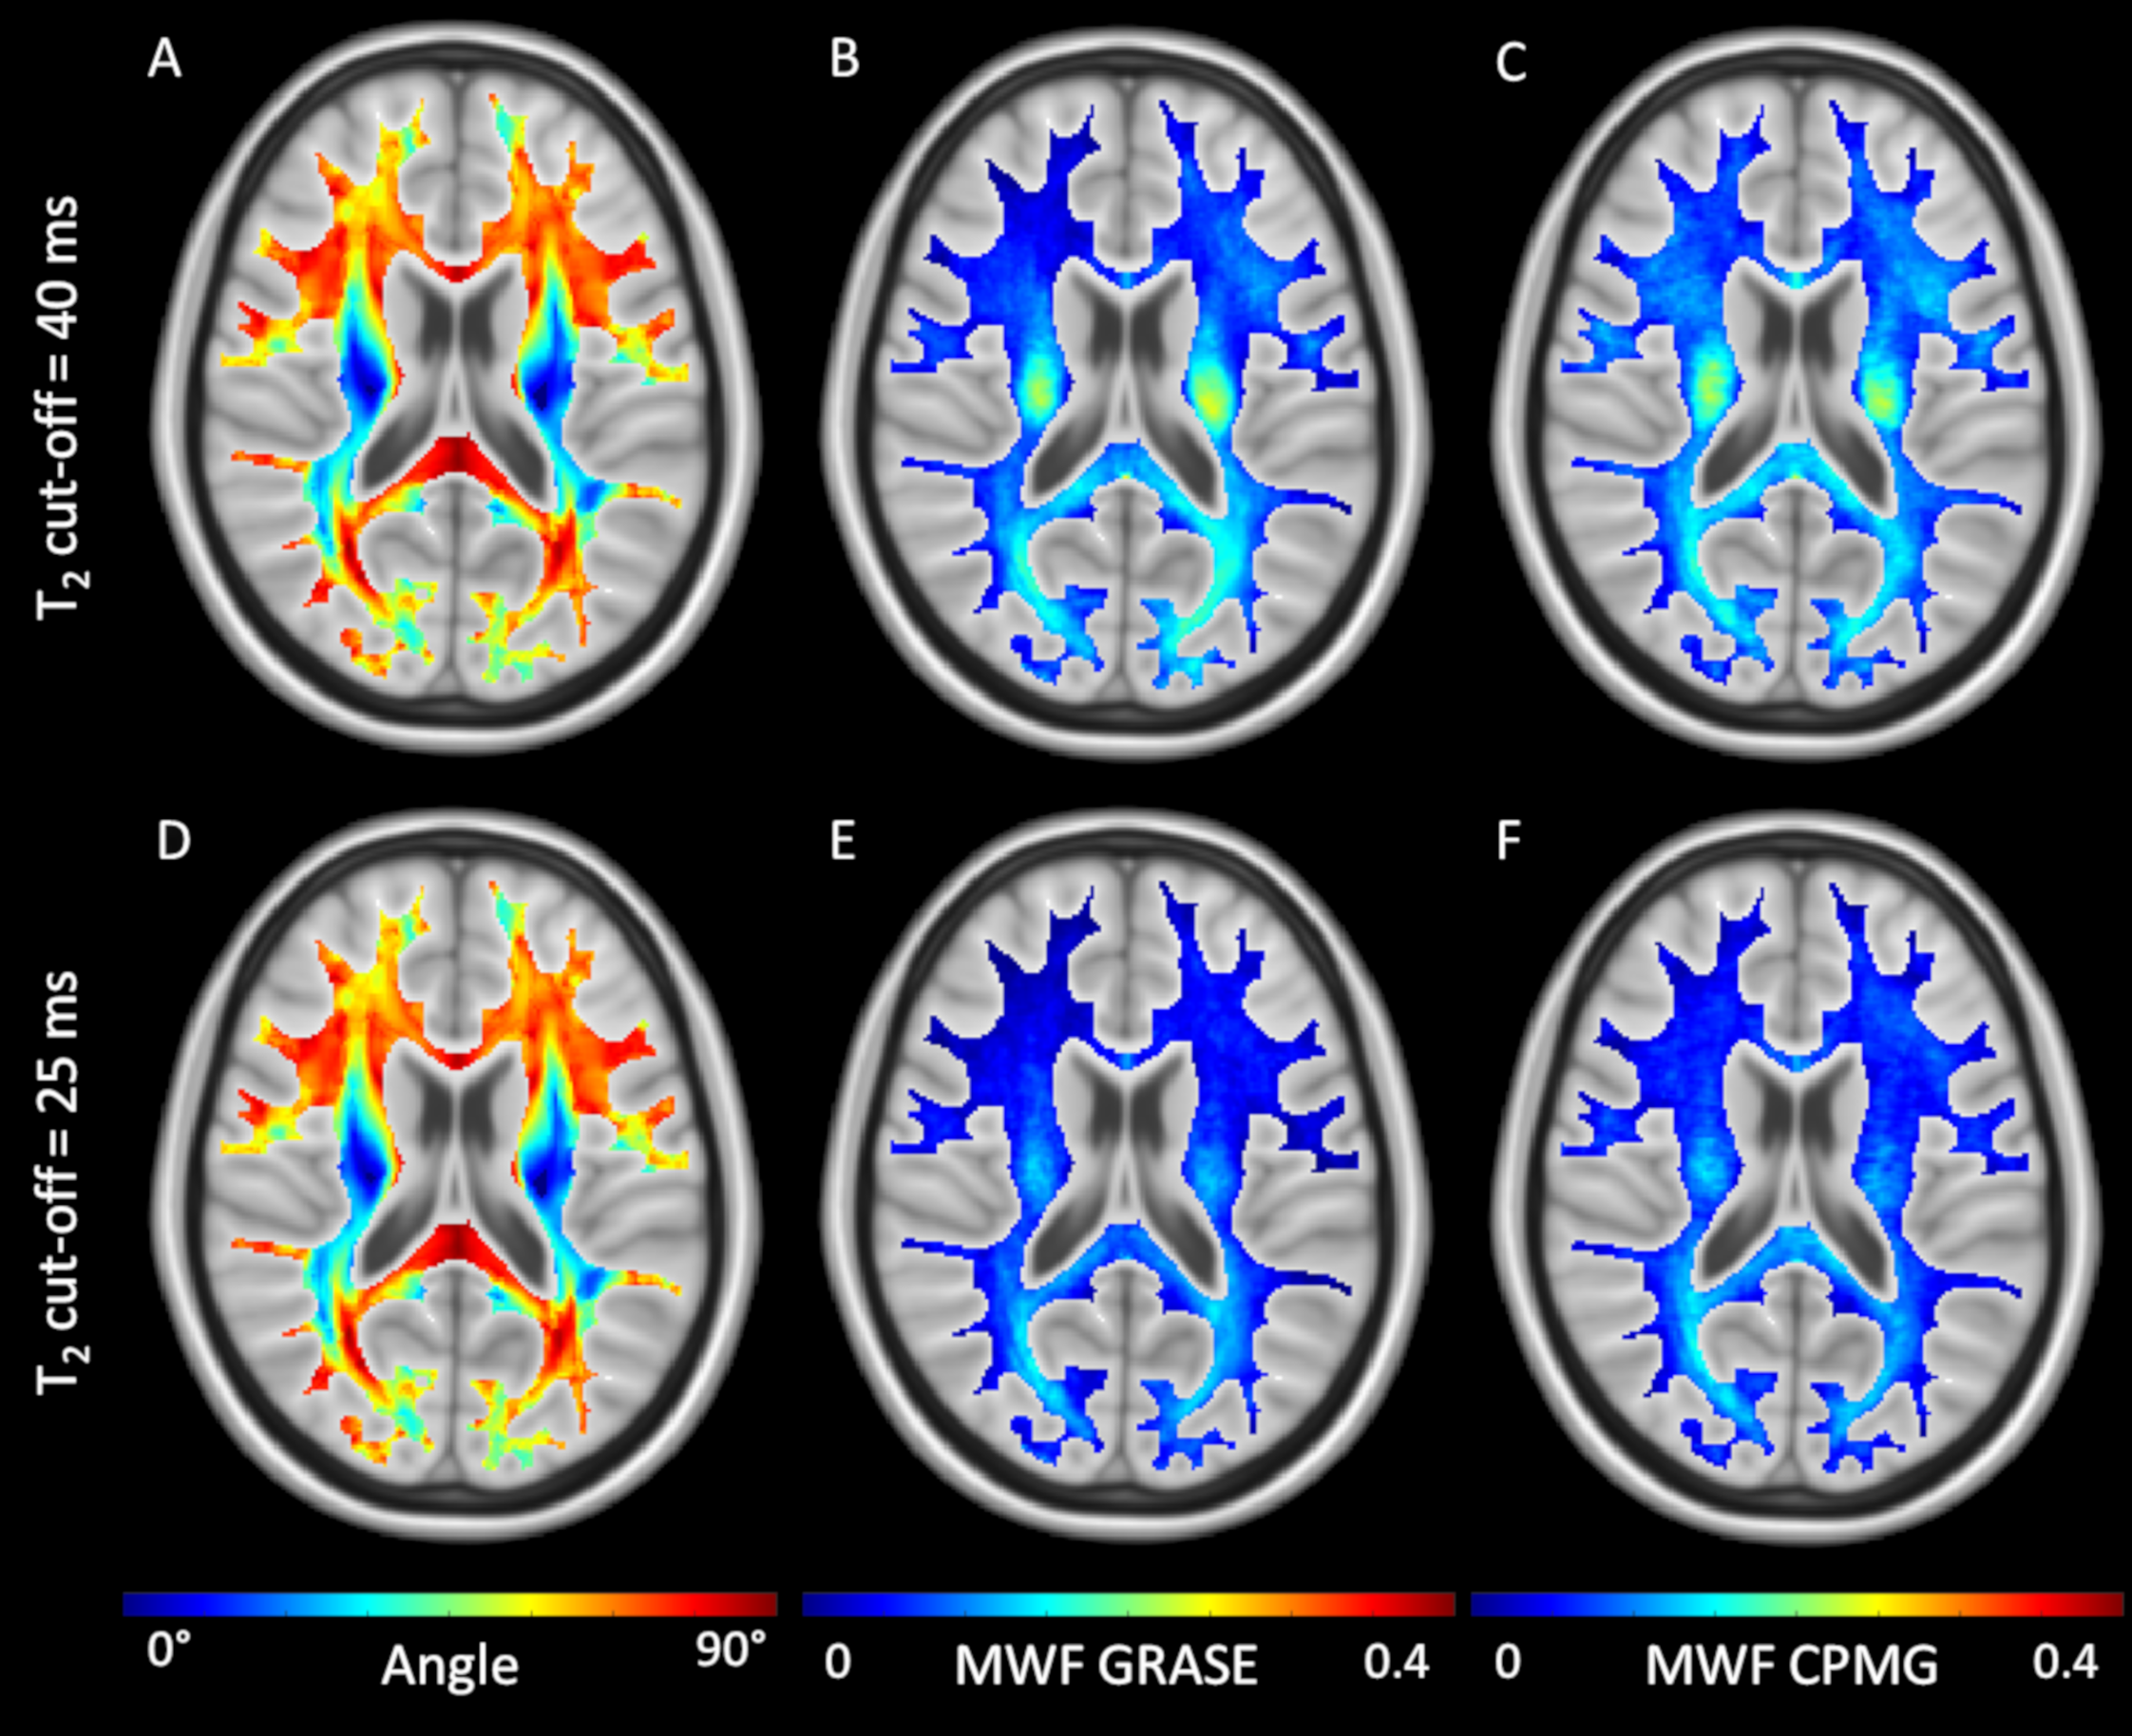
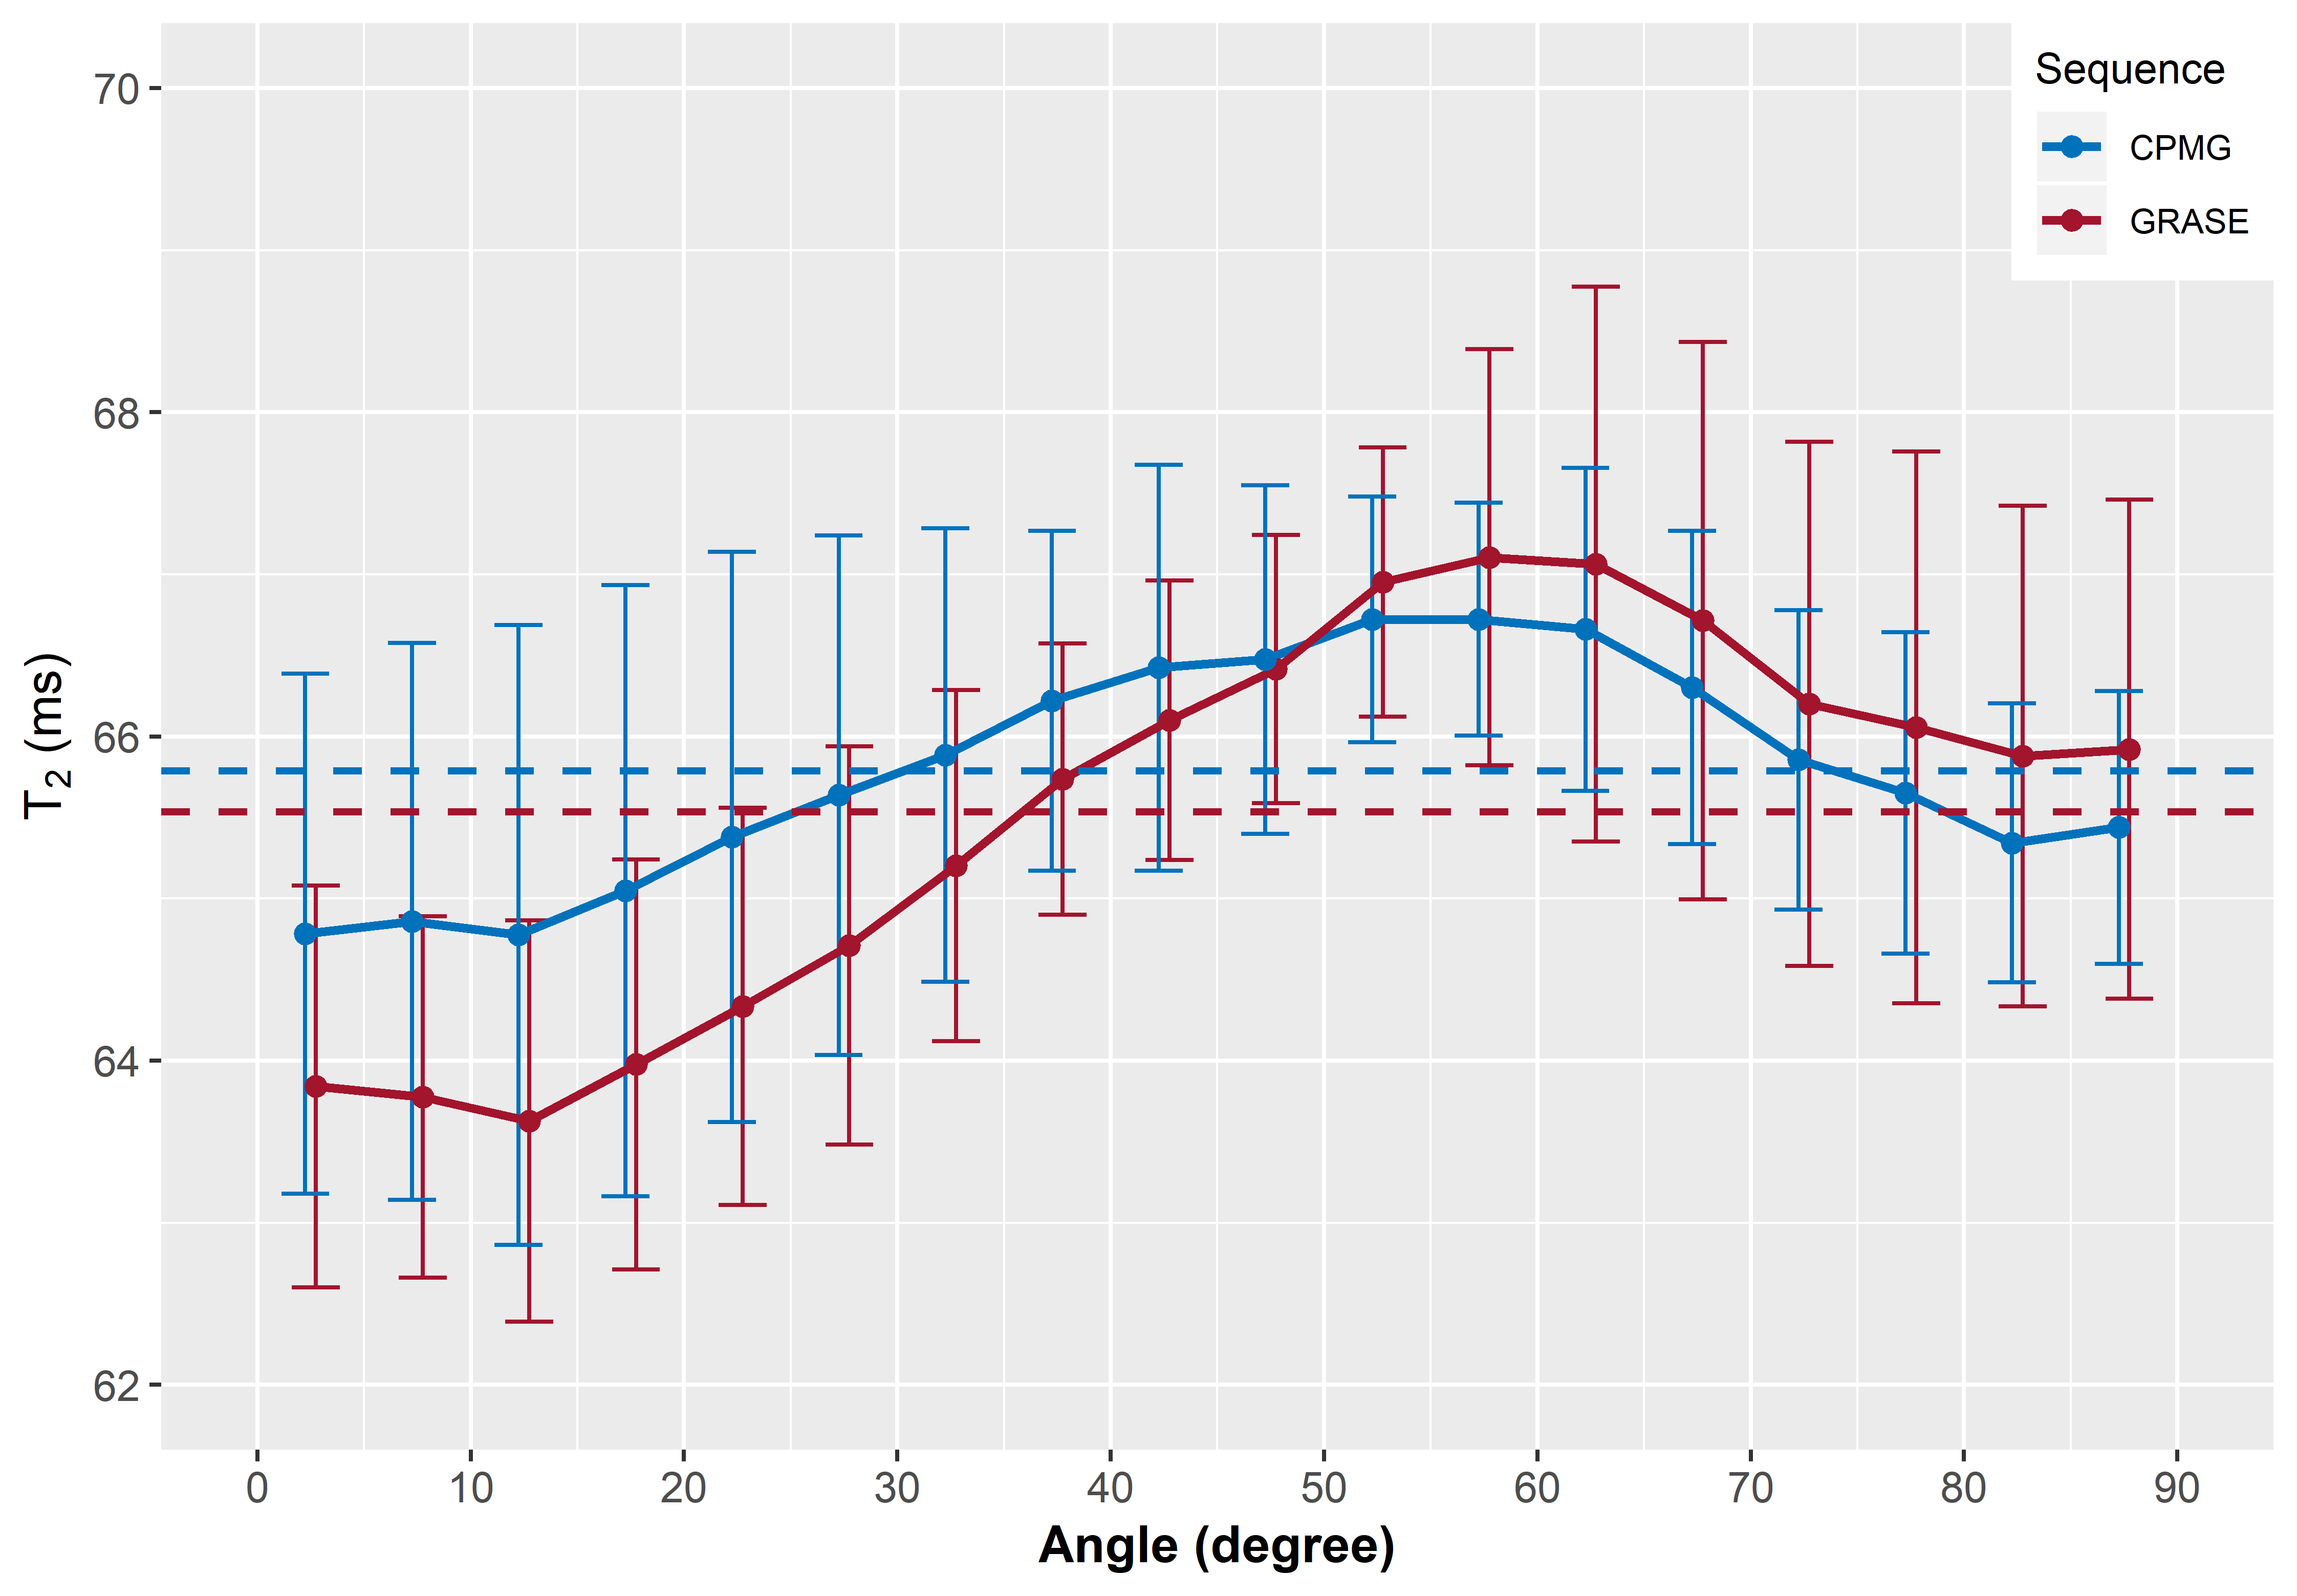
In Figure 1, representative maps of the fiber angle in respect to B0 and the corresponding MWF maps averaged across seven volunteers are shown. Overall, the GRASE and CPMG sequence provide comparable results, but a decrease of the T2 cut-off from 40 ms to 25 ms resulted in an overall decrease of the MWF. The relationship between the MWF and the WM fibre orientation is shown in Figure 2. In general for both T2 cut-offs, the MWF decreased with increasing fibre angles up to 50° to 60° where a minimum is reached. For angles between 0° and 50° both GRASE and CPMG show the same trend, where as between 50° and 90° fibre orientation, the GRASE revealed slightly lower MWF values than the CPMG. Changing the T2 cut-off from 40 ms to 25 ms significantly decreased the global WM MWF by 50 % from 0.096 to 0.064 (p < 0.001) for the GRASE and by 43.3 % from 0.096 to 0.067 (p < 0.001) for the CPMG, respectively. Furthermore, the orientation dependency seems to be slightly decreased when using a T2 cut-off of 25 ms as indicated in Figure 2B. T2 showed an increase with increasing fibre angles up to a maximum between 50° and 60° followed by a slight decrease as shown in Figure 3.Discussion and Conclusion
In the present work, we saw that overall T2 varies by less than 3%, whereas MWF was approximately 30% lower at angles between 50° and 60° compared to tissue parallel to B0. All MWF and R2 measurements followed this pattern, with a minimum near the magic angle of 54.7°. Therefore orientation effects of the transverse relaxation and MWF might arise from dipole-dipole interaction. The attenuated recovery of the GRASE based MWF at angles above 54.7° may due to some R2* weighting of the GRASE sequence, which may lead to an attenuation of the signal due to field inhomogeneities created by the myelinated axons. The orientation behaviour of the GRASE was similar to the CPMG with the 40 ms cut-off but not with the 25 ms cut-off, where large differences in MWF between the two scans were present at larger angles. Our results indicate that the present standard cut-off of 40 ms overestimates MWF, as it is located within the left slope of the intra- and extracellular water peak and therefore interprets some of that water as myelin water.Acknowledgements
No acknowledgement found.References
1. Bender, B. & Klose, U. The in vivo influence of white matter fiber orientation towards B0 on T2* in the human brain. NMR Biomed. 23, 1071–1076 (2010).
2. Denk, C., Hernandez Torres, E., MacKay, A. & Rauscher, A. The influence of white matter fibre orientation on MR signal phase and decay. NMR Biomed. 24, 246–52 (2011).
3. Lee, J. et al. T2*-based fiber orientation mapping. Neuroimage 57, 225–34 (2011).
4. Lee, J. et al. An R2* model of white matter for fiber orientation and myelin concentration. Neuroimage 162, 269–275 (2017).
5. Wharton, S. & Bowtell, R. Fiber orientation-dependent white matter contrast in gradient echo MRI. Proc. Natl. Acad. Sci. U. S. A. 109, 18559–64 (2012).
6. Schyboll, F., Jaekel, U., Weber, B. & Neeb, H. The impact of fibre orientation on T 1-relaxation and apparent tissue water content in white matter. Magn. Reson. Mater. Physics, Biol. Med. 31, 501–510 (2018).
7. Schyboll, F., Jaekel, U., Petruccione, F. & Neeb, H. Fibre-orientation dependent R 1 (=1/T 1 ) relaxation in the brain: The role of susceptibility induced spin-lattice relaxation in the myelin water compartment. J. Magn. Reson. 300, 135–141 (2019).
8. Hernandez-Torres, E. et al. Anisotropic cerebral vascular architecture causes orientation dependency in cerebral blood flow and volume measured with dynamic susceptibility contrast magnetic resonance imaging. J. Cereb. Blood Flow Metab. 0, 1–12 (2016).
9. Doucette, J. et al. Rapid solution of the Bloch-Torrey equation in anisotropic tissue: Application to dynamic susceptibility contrast MRI of cerebral white matter. Neuroimage 185, 198–207 (2019).
10. Prasloski, T., Mädler, B., Xiang, Q.-S., MacKay, A. & Jones, C. Applications of stimulated echo correction to multicomponent T2 analysis. Magn. Reson. Med. 67, 1803–14 (2012).
11. Prasloski, T. et al. Rapid whole cerebrum myelin water imaging using a 3D GRASE sequence. Neuroimage 63, 533–539 (2012).
12. Whittall, K. P. et al. In vivo measurement of T2 distributions and water contents in normal human brain. Magn. Reson. Med. 37, 34–43 (1997).
13. Whittall, K. P. & MacKay, A. L. Quantitative interpretation of NMR relaxation data. J. Magn. Reson. 84, 134–152 (1989).
14. Mazziotta, J. C., Toga, A. W., Evans, A., Fox, P. & Lancaster, J. A probabilistic atlas of the human brain: theory and rationale for its development. The International Consortium for Brain Mapping (ICBM). Neuroimage 2, 89–101 (1995).
Figures