0051
Exploring generalization capacity of artificial neural network for myelin water imaging1Department of Electrical and Computer Engineering, Seoul National University, Seoul, Korea, Republic of, 2Cleveland Clinic, Epilepsy Center, Neurological Institute, Cleveland, OH, United States, 3Division of Biomedical Engineering, Hankuk University of Foreign Studies, Gyeonggi-do, Republic of Korea
Synopsis
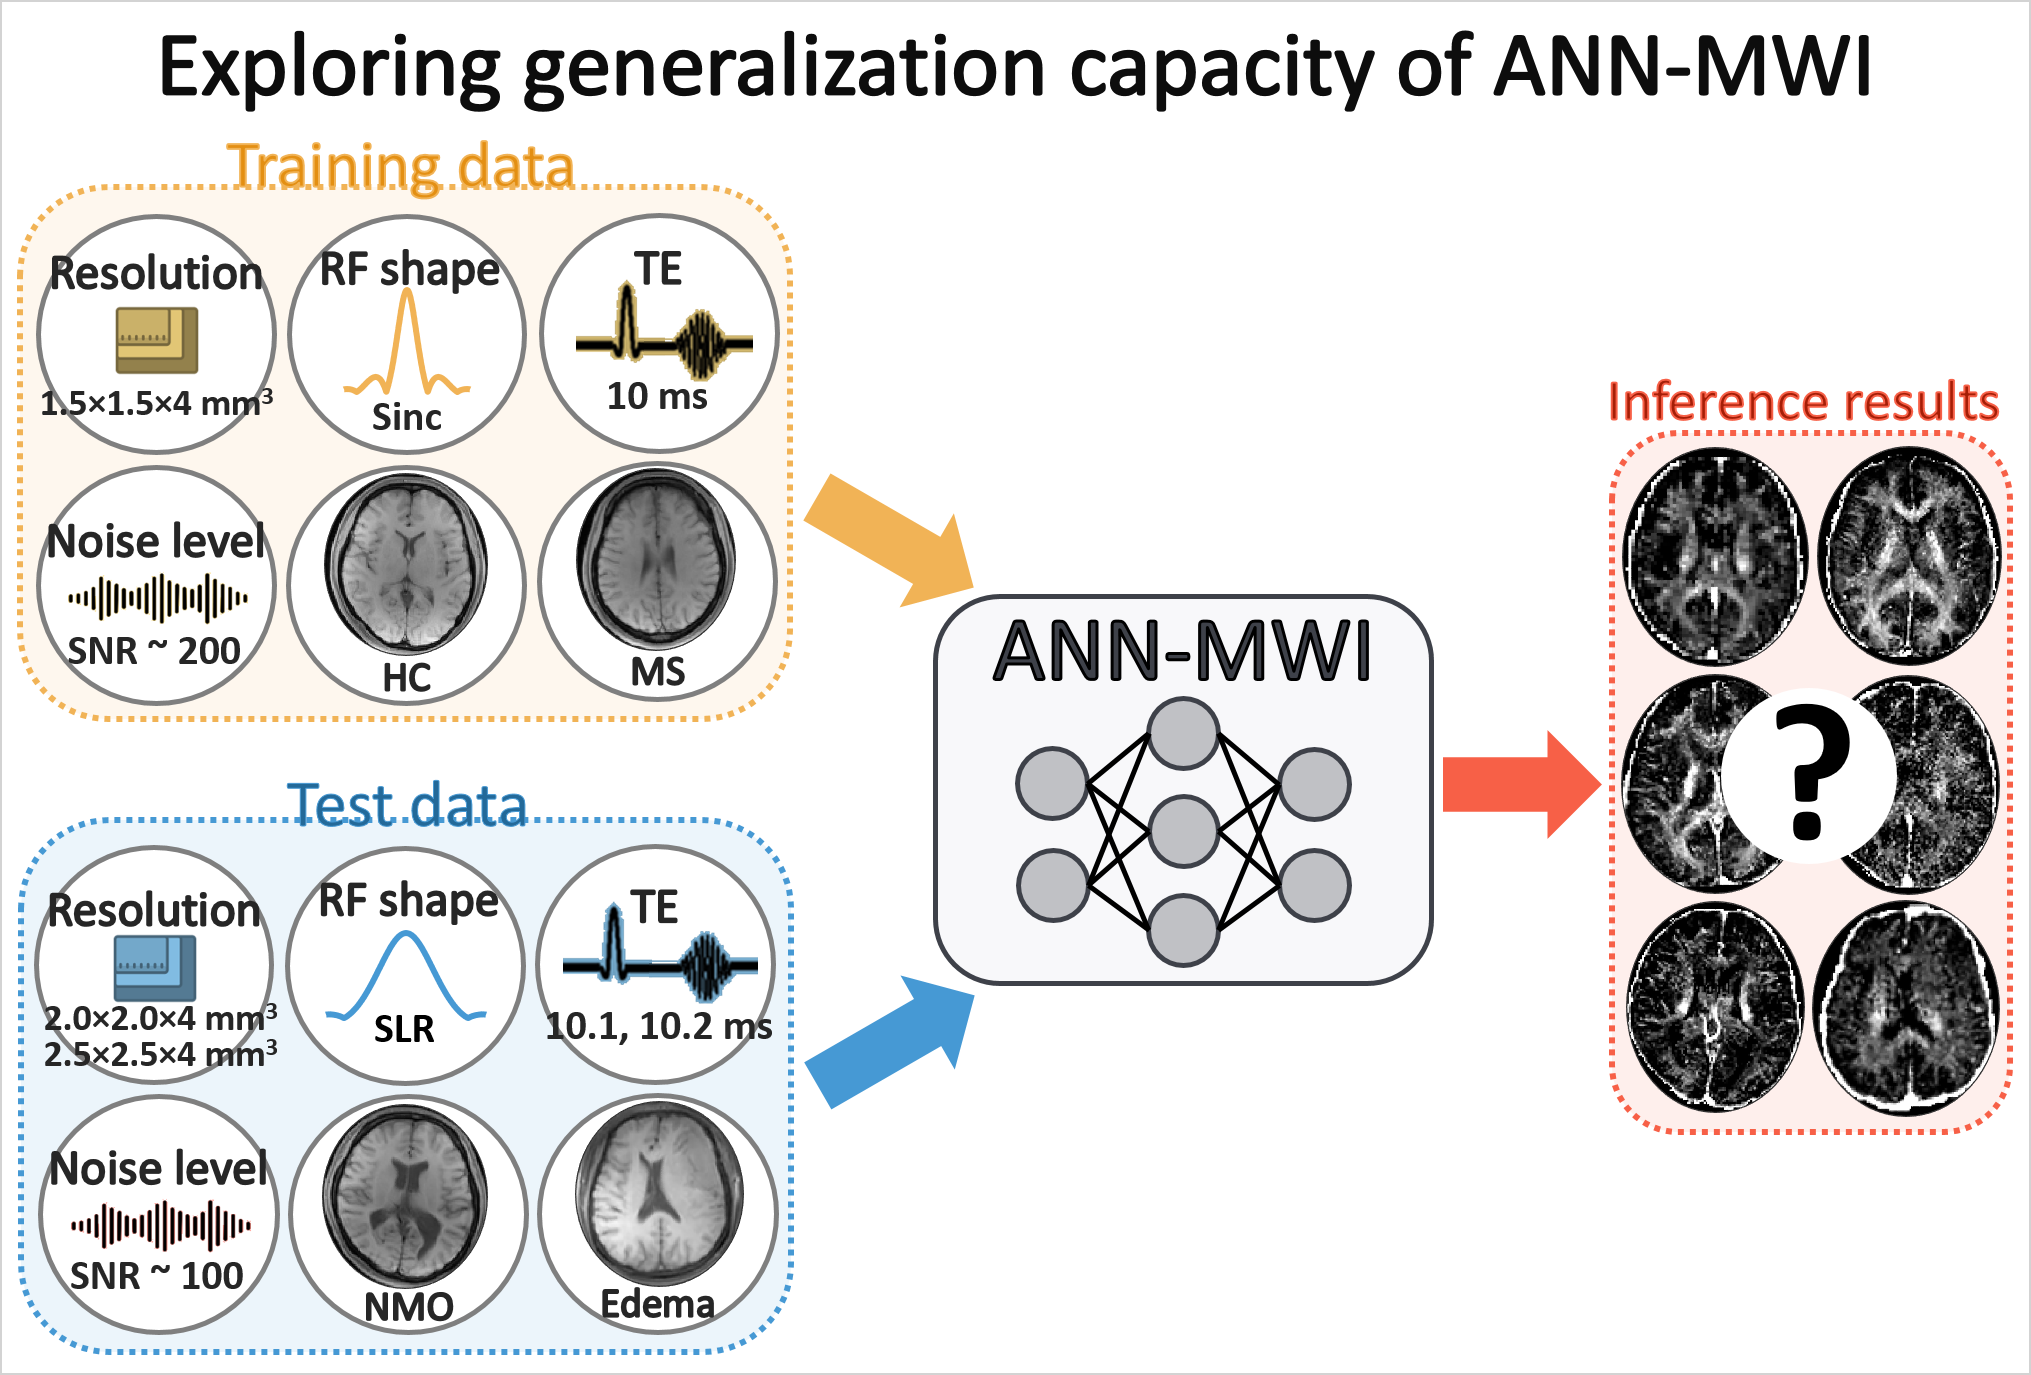
In this study, the generalization capacity of the artificial neural network for myelin water imaging (ANN-MWI) is explored by testing datasets with different (1) scan protocols (resolution, RF shape, and TE), (2) noise levels, and (3) types of disorders (NMO and edema). The ANN-MWI results show high reliability in generating myelin water fraction maps from the datasets with different resolution and noise levels. However, the increased errors are reported for the datasets with the different RF shape, TEs, and disorder type.
Purpose
Recently, Lee et al.1 proposed an artificial neural network-based myelin water imaging (ANN-MWI) reconstruction method and demonstrated real-time processing of MWI. ANN-MWI was designed to generate a T2 distribution, from which myelin water fraction (MWF) is calculated.2,3 For the training, multi-echo GRASE4 MWI data (FOV = 240×180×112 mm3; resolution = 1.5×1.5×4.0 mm3, sinc RF pulse, TE = 10 ms) of 12 subjects (6 healthy controls (HC) and 6 multiple sclerosis (MS) patients) were utilized. In the work, the test dataset had the same scan protocol, noise level, and types of diseases as in the training dataset. Since the training and test datasets had the same settings, ANN-MWI generated high-quality results for the test dataset. Recently, studies have suggested that the performance of a neural network highly depends on the characteristics of the training dataset.5,6 Therefore, further investigation is necessary to test the generalization performance of ANN-MWI for datasets of different conditions. In this study, we examine the reliability of ANN-MWI using the datasets of different scan protocols (resolution, RF shape, and TE), noise levels, and types of diseases (neuromyelitis optica (NMO) and edema) (Fig. 1).Methods
[Datasets]The following datasets were generated or acquired:
- Different scan protocols: The effects of different resolutions,
refocusing RF shape, and TEs were tested.
(1a) The original dataset (Ref 1) had a resolution of 1.5×1.5×4.0 mm3. Two different resolutions, 2.0×2.0×4.0 mm3 and 2.5×2.5×4.0 mm3, were generated by truncating k-space in the eight test dataset (3 HC and 5 MS).
(1b) The original dataset was acquired with a sinc-shaped refocusing RF (TBW = 4). To test the effects of the RF shape, an SLR-designed refocusing pulse (TBW = 2) data were acquired in 14 HC.
(1c) The original dataset had a TE of 10 ms. Two additional TE values (TE1 = 10.1 ms for 3 HC and 8 MS; TE1 = 10.2 ms for 5 HC and 6 MS) were tested. - Different noise levels: Three different levels of noise (one, two, and three times of noise standard deviation (STD) in each eight test data)7 were added to the 32-echo images of the dataset.
- Different types of disorders: The dataset of twenty-three NMO patients (resolution = 1.5×1.5×4.0 mm3)8 and seven edema patients (resolution = 1.7×1.7×5.0 mm3) were tested to check the influence of disease types on the performance.
[Data analysis]
To explore the reliability of ANN-MWI, all datasets were processed using both conventional and ANN-MWI methods. The MWF and normalized root-mean-square errors (NRMSE) of MWF were compared in a white matter mask with the conventional MWI results as a reference.
Results
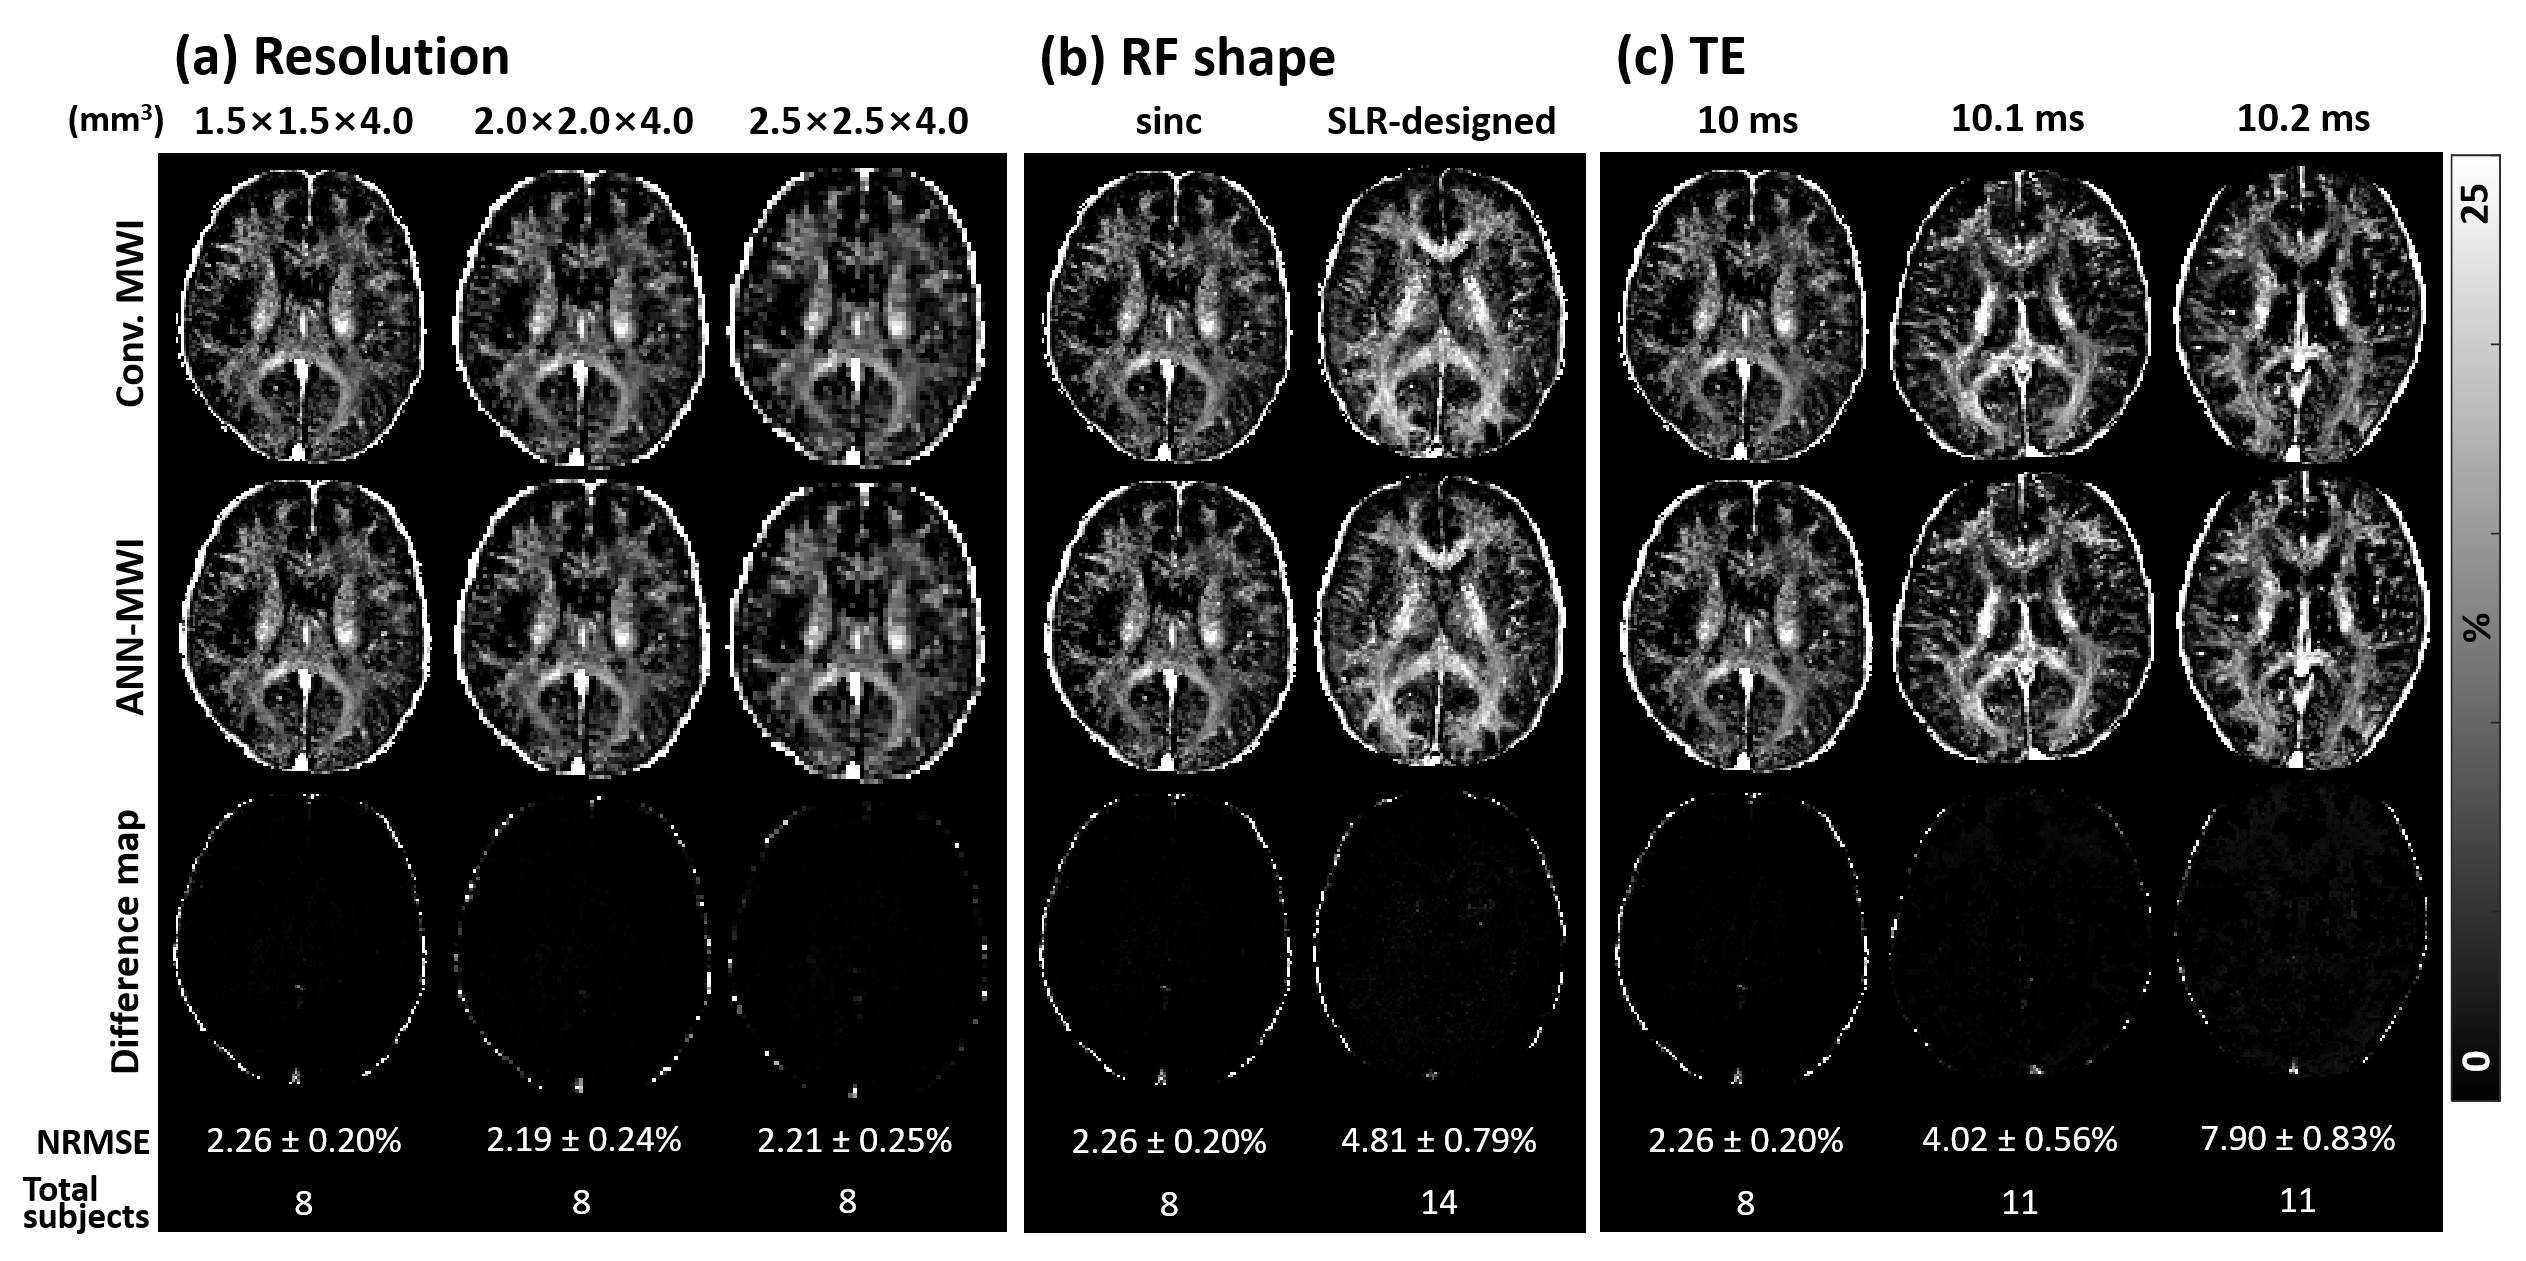
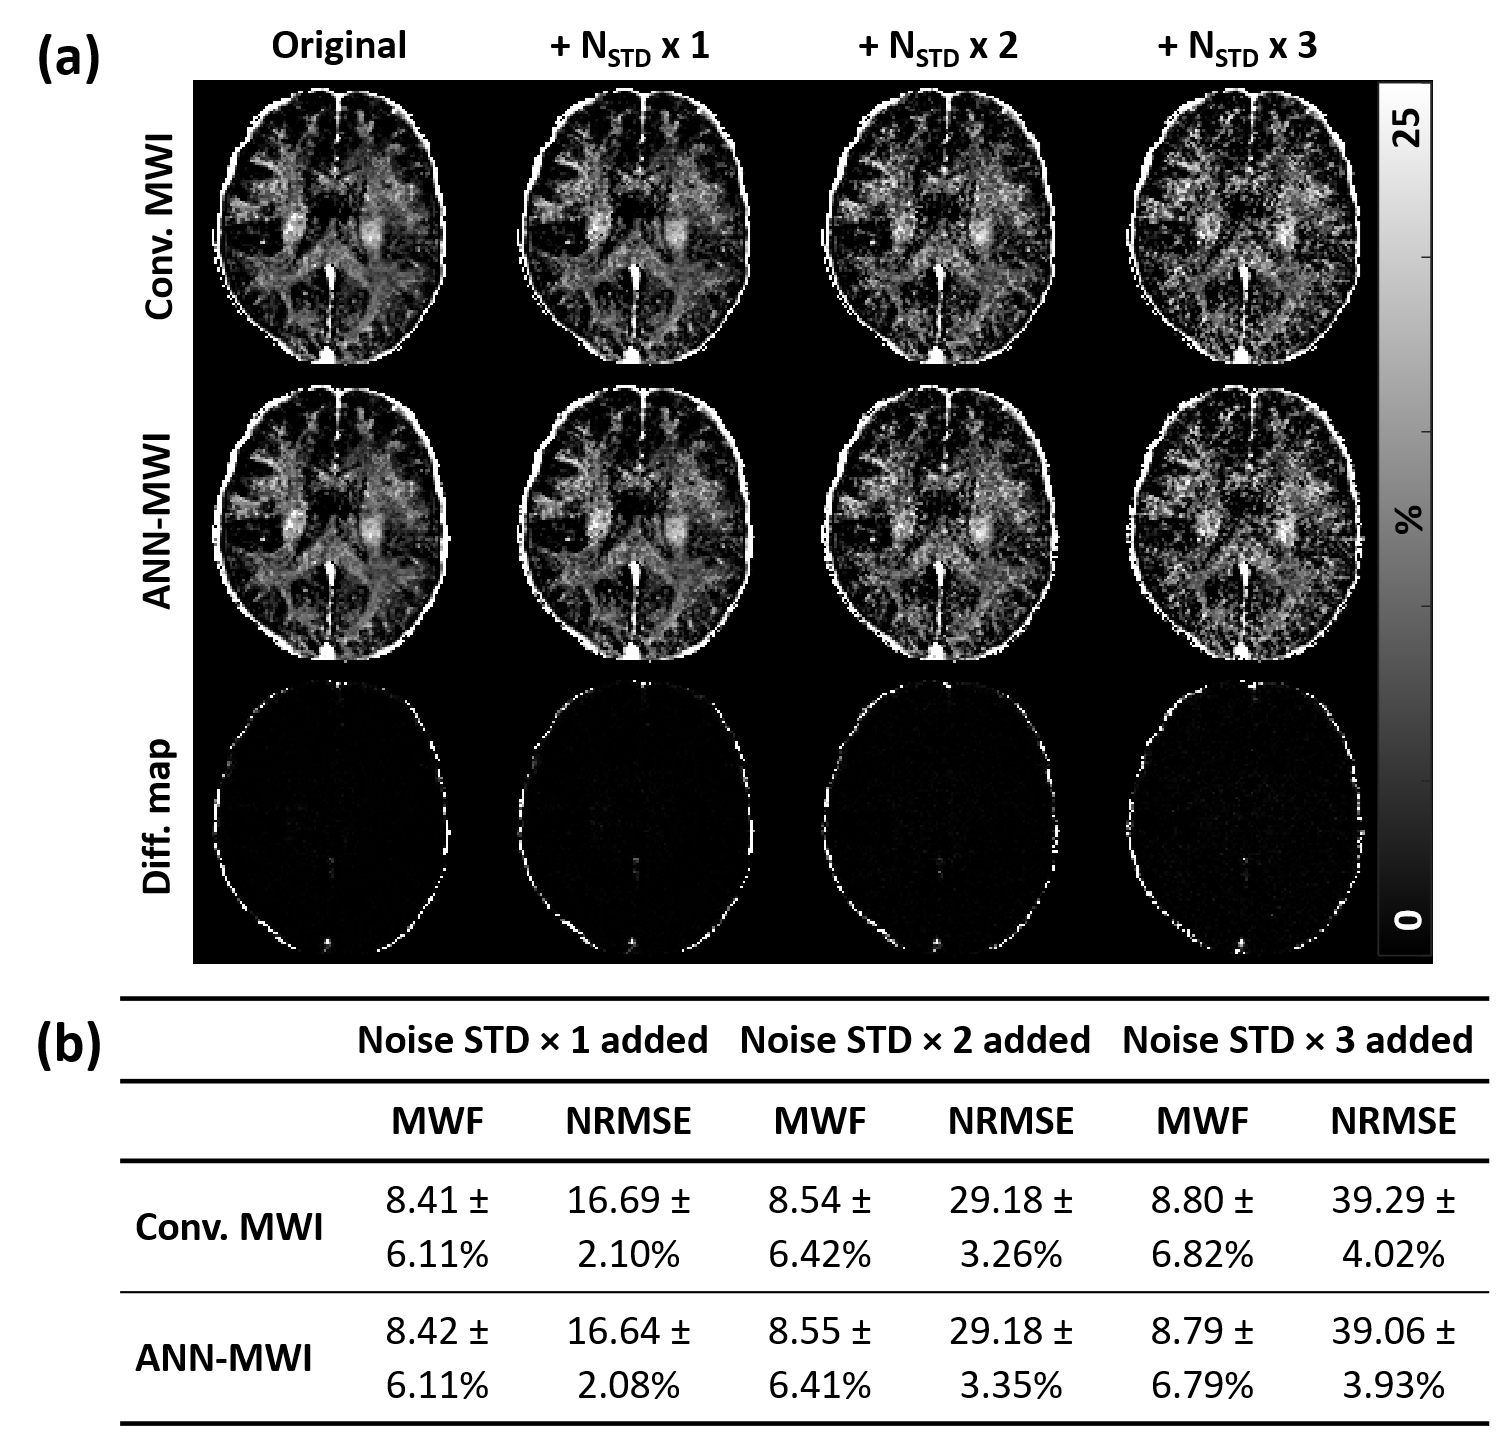
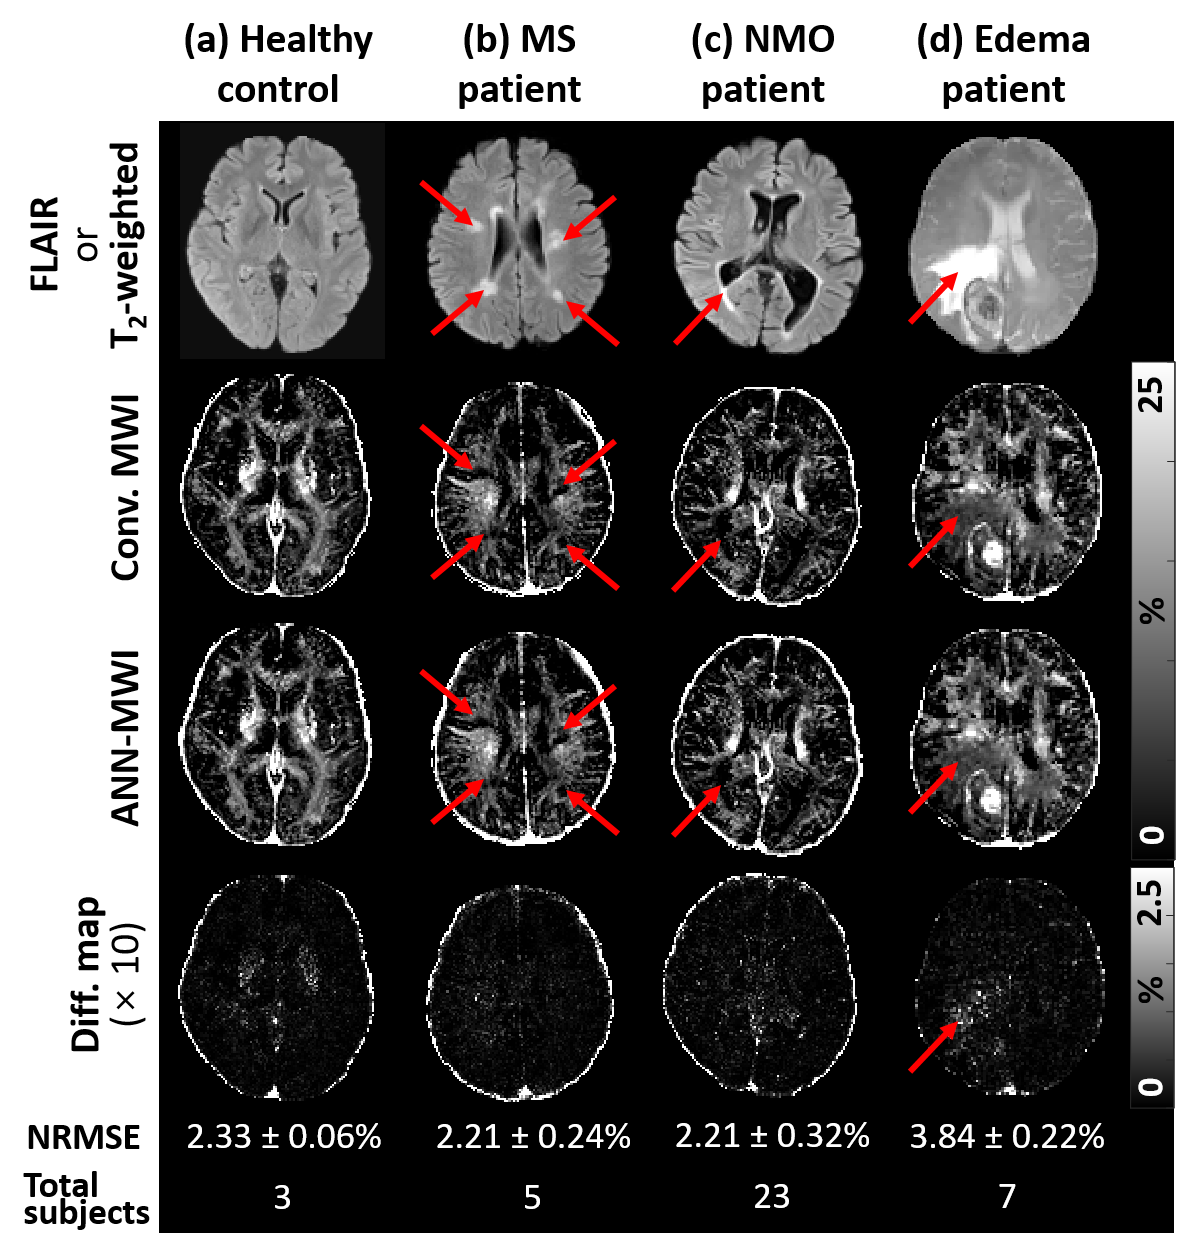
For the eight test dataset of the same parameters, the NRMSE of ANN-MWI was 2.26 ± 0.20%. For the different scan protocols, the results are summarized in Figure 2. The mean NRMSEs of the low-resolution datasets were 2.19 ± 0.24% for 2.0×2.0×4.0 mm3 and 2.21 ± 0.25% for 2.5×2.5×4.0 mm3. Since these errors are similar to that of the same resolution (2.26 ± 0.20%), the results suggest that the resolution does not affect the performance of ANN-MWI. When the results of the different RF shape data were examined, they reported significantly higher NRMSE of 4.81 ± 0.79%, indicating the influence of the RF shape. For the different TEs, NRMSEs were 4.02 ± 0.56% for TE1 = 10.1 ms dataset and 7.90 ± 0.83% for TE1 = 10.2 ms dataset, showing significant dependence of the errors on TE. The MWF maps from the three different noise-added data are compared in Figure 3a. The higher noise levels resulted in noisier MWF maps. Despite the noisy maps, the results from the conventional method and ANN-MWI show similar MWF maps (Fig. 3a), mean ± STD of MWF values, and NRMSEs (Fig. 3b), suggesting consistent noise effects on both methods. In Figure 4, the MWF maps of the four different subject types (HC, MS, NMO, and edema) are displayed with the error maps. The average NRMSEs were 2.33 ± 0.06% in 3 HC, 2.21 ± 0.24% in 5 MS, 2.21 ± 0.32% in 23 NMO, and 3.84 ± 0.22% in the 7 edema patients. Although both conventional and ANN-MWI methods generated similar MWF maps, the difference map of the edema data reveals significant errors particularly in the edema lesion. When the edema lesion was analyzed, the mean NRMSE was 9.59 ± 1.88%, demonstrating increased NRMSE.Conclusion and discussion
In this study, we explored the generalization capacity of a recently proposed neural network, ANN-MWI, for MWI. Our results demonstrate the feasibility of the network on datasets with different resolution and noise levels. On the other hand, the increased errors were reported for the datasets with different RF shapes and TEs, suggesting the dependency of ANN-MWI on refocusing profile and TE. These errors might be reduced by fine-tuning the network with a few data using transfer learning.9 For different disease types, ANN-MWI showed similar results in NMO data but an increased error in edema data. The increased error might be caused by different T2 characteristics of the edema lesion. To decrease the errors, data augmentation method10 can be utilized, which may expand the generalization capacity of ANN-MWI.Acknowledgements
This research was supported by the Brain Korea 21 Plus Project in 2019 and the Brain Research Program through the National Research Foundation of Korea (NRF) funded by the Korea government (MSIT) (No. NRF-2017M3C7A1047864 and NRF-2018R1A2B3008445).References
[1] Lee J, Lee D, Choi JY, et al. Artificial neural network for myelin water imaging. Magn Reson Med. 2019.
[2] MacKay AL, Whittall K, Adler J, et al. In vivo visualization of myelin water by magnetic resonance. Magn Reson Med. 1994;31:673-677.
[3] Prasloski T, Mädler B, Xiang Q-S, et al. Applications of stimulated echo correction to multicomponent T2 analysis. Magn Reson Med. 2012;67:1803-1814.
[4] Prasloski T, Rauscher A, MacKay AL, et al. Rapid whole cerebrum myelin water imaging using a 3D GRASE sequence. NeuroImage. 2012;63:533-539.
[5] Ben-David S, Blitzer J, Crammer K, and Pereira F. Analysis of representations for domain adaptation. In Advances in NIPS. 2007:137-144
[6] Volpi R, Namkoong H, Sener O, et al. Generalizing to unseen domains via adversarial data augmentation. Adv Neural Inf Process Syst. 2018;5334-5344.
[7] Coupé P, Manjón JV, Gedamu E, Arnold D, Robles M, Collins DL. Robust Rician noise estimation for MR images. Med Image Anal. 2010;14(4):483-493.
[8] Jeong IH, Choi JY, Kim SH, et al. Normal-appearing white matter demyelination in neuromyelitis optica spectrum disorder. Eur J Neurol. 2017;24(4): 652-658
[9] Pan SJ and Yang Q. A survey on transfer learning. IEEE T KNOWL DATA EN. 2009;22(10):1345-1359
[10] Jung W, Yoon J, Ji S, et al. Exploring linearity of deep neural network trained QSM: QSMnet+. arXiv. 2019;1909.07716.
Figures