0047
A study on Inhomogeneous Magnetization Transfer in Myelin and Intra-/Extra-cellular Water at 7T1Physics, University of British Columbia, Vancouver, BC, Canada, 2UBC MRI Research Centre, University of British Columbia, Vancouver, BC, Canada, 3Radiology, University of British Columbia, Vancouver, BC, Canada, 4International Collaboration on Repair Discoveries, University of British Columbia, Vancouver, BC, Canada
Synopsis
Inhomogeneous magnetization transfer (ihMT) is a novel MR imaging technique that could be used for myelin-specific imaging if the sequence is properly tuned to filter components with short dipolar relaxation time (T1D). It is believed that ihMT’s dependence on T1D serves as a method to extract the myelin-related signal, due to its longest dipolar order among the brain structures. Here, we have combined two myelin imaging techniques, ihMT and myelin water imaging (MWI), to study myelin and intra-/extra-cellular water’s contribution to the overall ihMT signal.
Introduction
Historically, inhomogeneous magnetization transfer (ihMT) has been presented as a myelin-specific imaging1,2. Manning et al. have shown that ihMT signal can arise in any molecules with dipolar order3, depending on the pulse sequence settings. However, with the use of T1D (dipolar relaxation time) filtering, short T1D components can be filtered out to improve specificity towards myelin4. Note, myelin possesses a long dipolar relaxation time from its dense composition of lipids, which have long-lived dipolar order1,3,5. Myelin water imaging (MWI) is a validated myelin-specific imaging technique, allowing us to isolate the water signal from the myelin and from the intra-/extra-cellular compartments6,7. Our work separates the ihMT signal into the myelin and intra-/extra-cellular components to determine myelin’s role in the ihMT signal, in ex vivo rat spinal cord.Methods
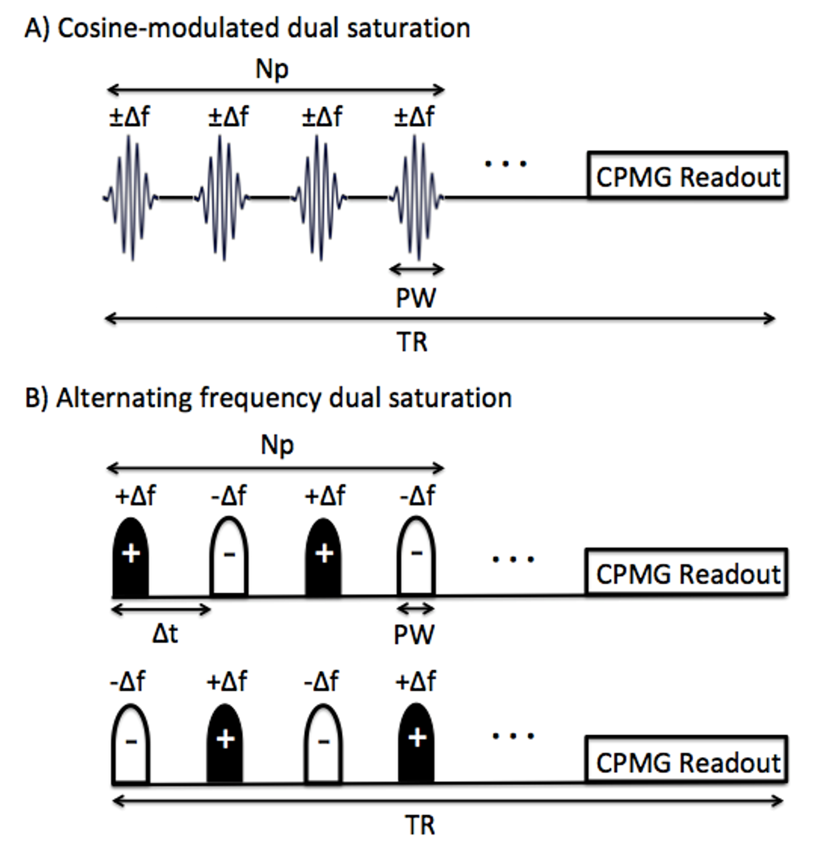
MR experiments were carried out on a 7T Bruker Avance system (Bruker Biospin, Ettlingen, Germany) with a solenoid coil.ihMT-CPMG experiments: CPMG pulse sequence combined with an ihMT prepulse module was used on a formalin-fixed rat spinal cord (SC) sample oriented perpendicular to B0, heated to 37.0±0.1°C. Five scans were acquired: single negative offset saturation (S-), single positive offset saturation (S+), two dual offset saturation (two Sdual), and no saturation (S0). The dual offset saturation scheme was implemented using cosine modulated (CM) or alternating frequency Hann-shaped prepulses (Fig.1 a,b). Scan parameters were Δf = 8kHz, TR/TE = 1500/6.753ms, B1,rms = 8.8μT, number of pulses Np = 100, FOV = 1.5 x 1.5cm2 , matrix = 256 x 256(59µm in-plane resolution), slice thickness = 2mm, 4 averages, 64 echoes, and echo spacing = TE. Five different types of ihMT-CPMG images were obtained: (1) No T1D filtering (Fig. 1a, CM PW = 1ms), (2) Weak T1D filtering (Fig. 1b, PW/Δt = 1/1.3ms), (3) Intermediate T1D filtering (Fig. 1b, PW/Δt = 2/2.3ms), (4) Strong T1D filtering (Fig. 1b, PW/Δt = 3/3.3ms) and (5) Very Strong T1D filtering (Fig. 1b, PW/Δt = 5/5.3ms).
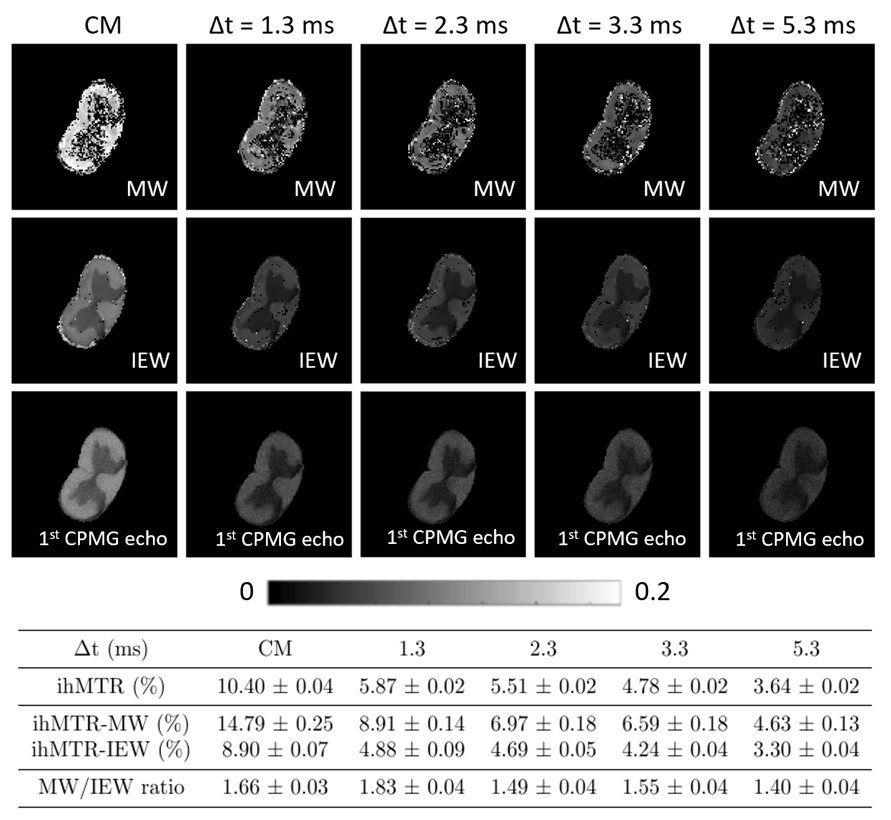
Data analysis: The acquired images were de-noised using a Non-Local Means algorithm8. To calculate the respective ihMTR for the myelin water (MW) and intra-/extra-cellular water (IEW) peak, a multi-exponential fit was fitted for each pixel. Non-negative least squares (NNLS) was used to analyze the data to obtain the T2 distributions9, and calculate the geometric mean T2 for each peak. The mean T2 values found from NNLS are used as fixed T2 values for multi-exponential fitting to extract the amplitudes. Note, the amplitude and full-width half maximum obtained from NNLS were used as predicted amplitudes for multi-exponential fit. The ihMT ratio was calculated for cosine modulation, (ihMTR= (S+ + S- - S±,CM - S±,CM)/(2*S0)), and for alternating frequency (ihMTR= (S+ + S- - S+- - S-+)/(2*S0)), where S is the amplitude corresponding to the MW or IEW in the multi-exponential fit. Myelin water fraction (MWF) was determined by dividing the area under the MW peak by the total signal. Global ihMTR signal in both compartments has also been calculated on 1st echoes images of ihMT-CPMG acquisitions.
Results and Discussion
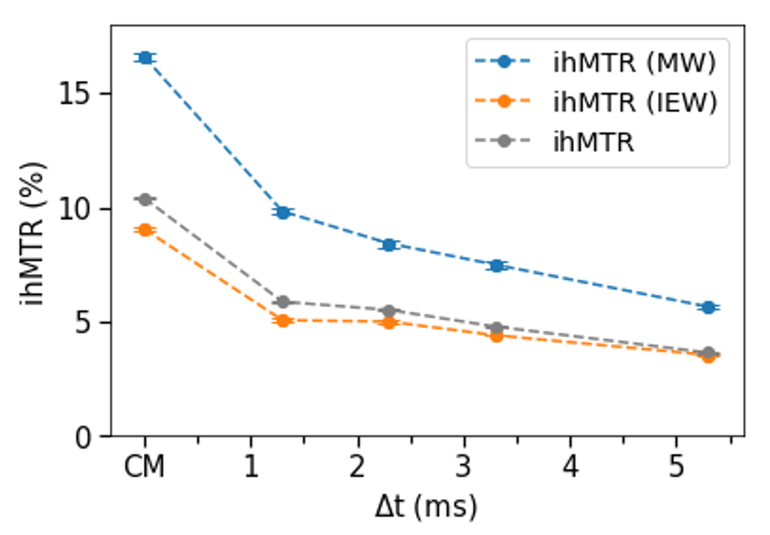
Fig. 2 shows the ihMTR maps for MW, IEW and from the global signal on the 1st CPMG echo. Mean values in white matter (WM) for the five different T1D weighting have been presented in a table. The graph (Fig. 3) illustrates the signal variation depending on the level of T1D filtering. IhMTR decreases for increasing Δt in both MW and IEW, with a strong signal drop. It has been previously shown that myelin probably has several T1D values with short and long values10,11. Our measurements enhanced this hypothesis and revealed that this property is not specific to one water compartment. In fact, both MW and IEW gave ihMTR signal for each experiment, with a higher signal found in the MW. However, although the global trend appeared similar in MW and IEW, the ratio between ihMTR-MW and ihMTR-IEW signal was found to be slightly higher for the weak T1D filtering experiment (Δt = 1.3 ms), revealing a higher signal contribution from the MW for this level of T1D filtering. This could mean that the T1D distribution is not similar between MW and IEW. More experiments are necessary to confirm this hypothesis, with ideally quantitative T1D measurements.The exchanges between the MW and IEW compartments also need to be taken into account12. In fact, they could also affect the ihMT detection, leading to a smooth signal dispersion between MW and IEW. We also noted a global ihMTR higher in this SC sample than the one usually observed in the literature on brain tissue1,10. This signal difference could be explained by the formalin fixative altering the structural organization, which would likely affect the dipolar order. Another explanation could be that the white matter in SC has longer T1D components, which seems to be confirmed by some previous works10 .
Conclusion
This study separated the ihMT signal from the MW and the IEW pools. Our findings show that both MW and IEW have an ihMT signal, with a higher value found in the MW pool. Even if global signal decay in both compartments appeared similar along the different T1D filtering experiments, small local ratio differences were observed, making the hypothesis that T1D distribution could be different between MW and IEW.Acknowledgements
No acknowledgement found.References
1. Varma, G., Duhamel, G., De Bazelaire, C. & Alsop, D. C. Magnetization transfer from inhomogeneously broadened lines: A potential marker for myelin. Magn. Reson. Med. 73, 614–622 (2015).
2. Girard, O. M. et al. Magnetization transfer from inhomogeneously broadened lines (ihMT): Improved imaging strategy for spinal cord applications. Magn. Reson. Med. 77, 581–591 (2017).
3. Manning, A. P., Chang, K. L., MacKay, A. L. & Michal, C. A. The physical mechanism of “inhomogeneous” magnetization transfer MRI. J. Magn. Reson. 274, 125–136 (2017).
4. Prevost, V. H. et al. Optimization of inhomogeneous magnetization transfer (ihMT) MRI contrast for preclinical studies using dipolar relaxation time (T1D) filtering. NMR Biomed. 30, (2017).
5. Varma, G. et al. Interpretation of magnetization transfer from inhomogeneously broadened lines (ihMT) in tissues as a dipolar order effect within motion restricted molecules. J. Magn. Reson. 260, 67–76 (2015).
6. Laule, C. et al. Myelin water imaging of multiple sclerosis at 7 T: Correlations with histopathology. Neuroimage 40, 1575–1580 (2008).
7. MacKay, A. L. & Laule, C. Magnetic Resonance of Myelin Water: An in vivo Marker for Myelin. Brain Plast. 2, 71–91 (2016).
8. Coupe, P. et al. An Optimized Blockwise Nonlocal Means Denoising Filter for 3D Magnetic Resonance Images. IEEE Trans. Med. Imaging 27, 425–441 (2008).
9. Whittall, K. P. & MacKay, A. L. Quantitative interpretation of NMR relaxation data. J. Magn. Reson. 84, 134–152 (1989).
10. Carvalho, V. et al. Assessment of two T1D components within myelinated tissue with ihMT MRI. Int. Soc. Magn. Reson. Med. (2019).
11. Prevost, V. H. et al. Validation of inhomogeneous Magnetization Transfer (ihMT) as a myelin biomarker. Int. Soc. Magn. Reson. Med. (2017).
12. Dula, A. N., Gochberg, D. F., Valentine, H. L., Valentine, W. M. & Does, M. D. Multiexponential T2, magnetization transfer, and Quantitative histology in white matter tracts of rat spinal cord. Magn. Reson. Med. 63, 902–909 (2010).
Figures