0046
Towards advanced microstructural analyses of white matter: Quantitative regional comparison of different myelin measures
Ronja Berg1, Aurore Menegaux1, Guillaume Gilbert2, Claus Zimmer1, Christian Sorg1, Irene Vavasour3, and Christine Preibisch1
1School of Medicine, Department of Neuroradiology, Technical University of Munich, Munich, Germany, 2MR Clinical Science, Philips Healthcare, Markham, ON, Canada, 3Radiology, University of British Columbia, Vancouver, BC, Canada
1School of Medicine, Department of Neuroradiology, Technical University of Munich, Munich, Germany, 2MR Clinical Science, Philips Healthcare, Markham, ON, Canada, 3Radiology, University of British Columbia, Vancouver, BC, Canada
Synopsis
Microstructural parameters of the brain such as the myelin concentration or g-ratio (average ratio between axonal and fiber diameter) can provide important information on the pathophysiology of demyelinating diseases. Several myelin sensitive MRI methods exist. However, correlations between different myelin sensitive measures and the best choice for g-ratio mapping is not yet fully explored. Therefore, we compared MWF, ihMTR, and MTsat in white matter and found the highest correlation between MWF and ihMTR. Those measures also varied more strongly across WM regions compared to MTsat, which suggests that they could be more reliable for further analyses such as g-ratio imaging.
Introduction
Measuring the distribution of myelin and the degree of myelination of nerve fibers in white matter (WM) is thought to improve evaluation and monitoring of demyelinating diseases such as multiple sclerosis.1-2 Advanced microstructural biomarkers such as the myelin volume fraction (MVF) and g-ratio (average ratio between axonal and fiber diameter) are also very promising for clinical and neuroscientific applications. Several magnetic resonance imaging (MRI) measures of microstructure have been proposed: (1) Myelin water imaging (MWI) detects the fraction of quickly decaying water signal (MWF), suggested to arise from water trapped between myelin bilayers.3 (2) Magnetization transfer (MT) saturation (MTsat) determines the signal reduction caused by a single MT saturation pulse4 while (3) inhomogeneous MT (ihMT) exploits the dipolar order relaxation time that has been associated with myelinated structures (ihMTR).5 All three measures have been found to relate to myelin content.1,5-8 While MWF and ihMTR have been compared previously,9-10 it is uncertain how these measures correlate with MTsat across different WM regions and which measure provides the most robust estimate of myelin content, and thus, the best basis for calculating MVF and g-ratio. Therefore, the aim of our study was to compare and correlate measurements of MWF, ihMTR, and MTsat in WM.Methods
Five healthy subjects (aged 28-49) were scanned on a Philips 3T Ingenia Elition using a 32-channel head-coil. All imaging and processing details are summarized in Fig.1. MWI was collected using a 3D-GRASE sequence with 48 echoes and MWF maps were calculated with a non-negative least square algorithm3 including stimulated echo correction.11 For ihMT, 3D gradient-echo data with 3 echoes and 10 sinc-gauss-shaped pulses were acquired from which ihMTR values were calculated.5 For MTsat, three 3D multi-echo gradient-echo data sets with T1-, PD- and MT-weighting and B1-mapping were acquired. Reconstruction was performed using the hMRI-toolbox12-13 including B1-mapping via actual flip angle imaging.14For volume-of-interest (VOI) evaluation, the JHU-ICBM DTI-based white matter atlas15-16 as well as MWF and ihMTR maps were co-registered to MTsat data using FSL5.0.1017-18 and SPM12,19 respectively. Parameters were evaluated in 24 dorsal WM JHU VOIs (above MNI slice 60).
From diffusion-weighted imaging (DWI), intra-cellular ($$$v_{ic}$$$) and isotropic ($$$v_{iso}$$$) volume compartments were obtained using the NODDI-toolbox20-21 and co-registered to the MWF map. Myelin volume fraction (MVF) and axonal volume fraction (AVF) were calculated using MWF according to West et al.22 and $$$v_{ic}$$$ and $$$v_{iso}$$$ according to Cercignani et al.23 and combined for g-ratio computation.23
Results
Fig.2 shows exemplary data of one subject. On visual inspection, regional differences between WM areas are present in MWF and ihMTR maps while MTsat appears relatively homogeneous. Quantitative parameter evaluations demonstrate that VOI-average ihMTR and MWF values show a similar behavior across different anatomically defined WM regions, while average MTsat values show less variation and appear more uniform (Fig.3). Overall, the different myelin sensitive measures correlated well (Fig.4). The linear fit between the two MT measures had the smallest y-intercept (Fig.4a). The coefficient of determination (R²) was highest (indicating best fit) for the correlation between ihMTR and MWF (Fig.4b). Fig.5 shows a preliminary g-ratio map that was calculated by combining a MWF-based MVF map with a NODDI-based AVF map.Discussion
In general, the three myelin measures correlate well (Fig.4), and quantitative MWF and ihMTR values agree with literature.3,5-6,10 Visual inspection and quantitative analysis across anatomically defined WM VOIs demonstrate that MWF and ihMTR show similar spatial patterns in WM (Fig.2&3). This matches with the fact that the highest correlation was found between MWF and ihMTR (R²=0.552 (Fig.4b)). Overall, our results indicate that those two measures are likely to show sensitivity to similar microstructural underpinnings, presumably constituents of myelin. The lowest linear correlation was obtained when fitting MWF and MTsat data (R²=0.287) suggesting that these techniques are sensitive to different aspects of myelination. A reason for the somewhat complementary information about the microstructure could be the different contrast mechanisms of the two techniques.Since a high sensitivity to the actual myelin content is important for calculating reliable MVF values, ihMTR could be a promising alternative to the frequently used MWF parameter. Besides somewhat reduced scan times, parameter evaluation is more than 10 times faster and could also be more robust than the multi-exponential fit required for MWI. However, this needs to be investigated in future studies. Furthermore, as none of the methods measure the myelin volume directly, comparisons to gold standards, e.g. histology or fluorescence microscopy, are needed to reliably disentangle the correlation between the different myelin sensitive measures and actual myelin content.
With regard to preliminary g-ratio evaluations, MVF obtained from MWF are in good accordance with literature,23-25 but AVF and g-ratio appear elevated (reference g-ratios: 0.6-0.8).23-25 Thus, further work is clearly needed with respect to improving sensitivity and accuracy of data acquisition as well as processing.
Conclusion
Highest correlation and strongest spatial accordance was found between MWF and ihMTR, which suggests that these parameters are more sensitive to smaller differences in myelin concentration than MTsat and, thereby, more suitable for more advanced analyses such as calculating the MVF or the g-ratio. However, since none of the investigated methods can measure myelin volume directly, further evaluations with respect to MVF or g-ratio calculations are clearly necessary.Acknowledgements
Ronja Berg is supported by a PhD grant from the Friedrich-Ebert-Stiftung.References
- Laule, C., Leung, E., Li, D. K., Traboulsee, A. L., Paty, D. W., MacKay, A. L., & Moore, G. R. (2006). Myelin water imaging in multiple sclerosis: quantitative correlations with histopathology. Multiple Sclerosis Journal, 12(6), 747-753.
- Hagiwara, A., Hori, M., Yokoyama, K., Nakazawa, M., Ueda, R., Horita, M., ... & Aoki, S. (2017). Analysis of white matter damage in patients with multiple sclerosis via a novel in vivo MR method for measuring myelin, axons, and g-ratio. American Journal of Neuroradiology, 38(10), 1934-1940.
- MacKay, A., Laule, C., Vavasour, I., Bjarnason, T., Kolind, S., & Mädler, B. (2006). Insights into brain microstructure from the T2 distribution. Magnetic resonance imaging, 24(4), 515-525.
- Helms, G., & Piringer, A. (2005). Simultaneous measurement of saturation and relaxation in human brain by repetitive magnetization transfer pulses. NMR in Biomedicine: An International Journal Devoted to the Development and Application of Magnetic Resonance In vivo, 18(1), 44-50.
- Van Obberghen, E., Mchinda, S., Le Troter, A., Prevost, V. H., Viout, P., Guye, M., ... & Girard, O. (2018). Evaluation of the sensitivity of Inhomogeneous Magnetization Transfer (ihMT) MRI for multiple sclerosis. American Journal of Neuroradiology, 39(4), 634-641.
- MacKay, A. L., & Laule, C. (2016). Magnetic resonance of myelin water: an in vivo marker for myelin. Brain Plasticity, 2(1), 71-91.
- Callaghan, M. F., Freund, P., Draganski, B., Anderson, E., Cappelletti, M., Chowdhury, R., ... & Lutti, A. (2014). Widespread age-related differences in the human brain microstructure revealed by quantitative magnetic resonance imaging. Neurobiology of aging, 35(8), 1862-1872.
- Duhamel, G., Prevost, V. H., Cayre, M., Hertanu, A., Mchinda, S., Carvalho, V. N., ... & Girard, O. M. (2019). Validating the sensitivity of inhomogeneous magnetization transfer (ihMT) MRI to myelin with fluorescence microscopy. NeuroImage, 199, 289-303.
- Vavasour, I., Smolina, A., MacMillan, E., Gilbert, G., Lam, M., Kozlowski, P., … & Alex MacKay (2018). Comparison of Inhomogeneous Magnetization Transfer (ihMT) and Myelin Water Fraction (MWF) In-Vivo at 3T. ISMRM, Abstract 5487.
- Ercan, E., Varma, G., Mädler, B., Dimitrov, I. E., Pinho, M. C., Xi, Y., ... & Lenkinski, R. E. (2018). Microstructural correlates of 3D steady‐state inhomogeneous magnetization transfer (ihMT) in the human brain white matter assessed by myelin water imaging and diffusion tensor imaging. Magnetic resonance in medicine, 80(6), 2402-2414.
- Prasloski, T., Mädler, B., Xiang, Q. S., MacKay, A., & Jones, C. (2012). Applications of stimulated echo correction to multicomponent T2 analysis. Magnetic resonance in medicine, 67(6), 1803-1814.
- Tabelow, K., Balteau, E., Ashburner, J., Callaghan, M. F., Draganski, B., Helms, G., ... & Reimer, E. (2019). hMRI–A toolbox for quantitative MRI in neuroscience and clinical research. Neuroimage, 194, 191-210.
- Weiskopf, N., Mohammadi, S., Lutti, A., & Callaghan, M. F. (2015). Advances in MRI-based computational neuroanatomy: from morphometry to in-vivo histology. Current opinion in neurology, 28(4), 313-322.
- Yarnykh, V. L. (2007). Actual flip‐angle imaging in the pulsed steady state: a method for rapid three‐dimensional mapping of the transmitted radiofrequency field. Magnetic Resonance in Medicine: An Official Journal of the International Society for Magnetic Resonance in Medicine, 57(1), 192-200.
- Mori, S., Wakana, S., Van Zijl, P. C., & Nagae-Poetscher, L. M. (2005). MRI atlas of human white matter. Elsevier.
- JHU DTI-based white-matter atlases: https://identifiers.org/neurovault.collection:264
- FSL Software: https://fsl.fmrib.ox.ac.uk/fsl/fslwiki/
- Woolrich, M. W., Jbabdi, S., Patenaude, B., Chappell, M., Makni, S., Behrens, T., ... & Smith, S. M. (2009). Bayesian analysis of neuroimaging data in FSL. Neuroimage, 45(1), S173-S186.
- Statistical Parametric Mapping Software: www.fil.ion.ucl.ac.uk/spm
- Neurite orientation dispersion and density imaging toolbox: www.nitrc.org/projects/noddi_toolbox/
- Zhang, H., Schneider, T., Wheeler-Kingshott, C. A., & Alexander, D. C. (2012). NODDI: practical in vivo neurite orientation dispersion and density imaging of the human brain. Neuroimage, 61(4), 1000-1016.
- West, K. L., Kelm, N. D., Carson, R. P., Gochberg, D. F., Ess, K. C., & Does, M. D. (2018). Myelin volume fraction imaging with MRI. Neuroimage, 182, 511-521.
- Cercignani, M., Giulietti, G., Dowell, N. G., Gabel, M., Broad, R., Leigh, P. N., ... & Bozzali, M. (2017). Characterizing axonal myelination within the healthy population: a tract-by-tract mapping of effects of age and gender on the fiber g-ratio. Neurobiology of aging, 49, 109-118.
- Duval, T., Stikov, N., & Cohen-Adad, J. (2016). Modeling white matter microstructure. Functional neurology, 31(4), 217.
- Stikov, N., Campbell, J. S., Stroh, T., Lavelée, M., Frey, S., Novek, J., ... & Leppert, I. R. (2015). In vivo histology of the myelin g-ratio with magnetic resonance imaging. Neuroimage, 118, 397-405.
Figures

Figure 1: Overview
of acquisition protocols, derived parameters, and processing. Measurements included myelin water imaging (MWI), inhomogeneous
MT (ihMT), and MT saturation (MTsat) as well as diffusion-weighted imaging
(DWI). Parameter maps were calculated using toolboxes as referenced. Maps of
MWF, ihMTR, MTsat and 24 dorsal WM segments from the JHU ICBM-DTI white matter
labels were co-registered for quantitative VOI analysis. DWI and MWI were used
to calculate AVF and MVF for g-ratio mapping.
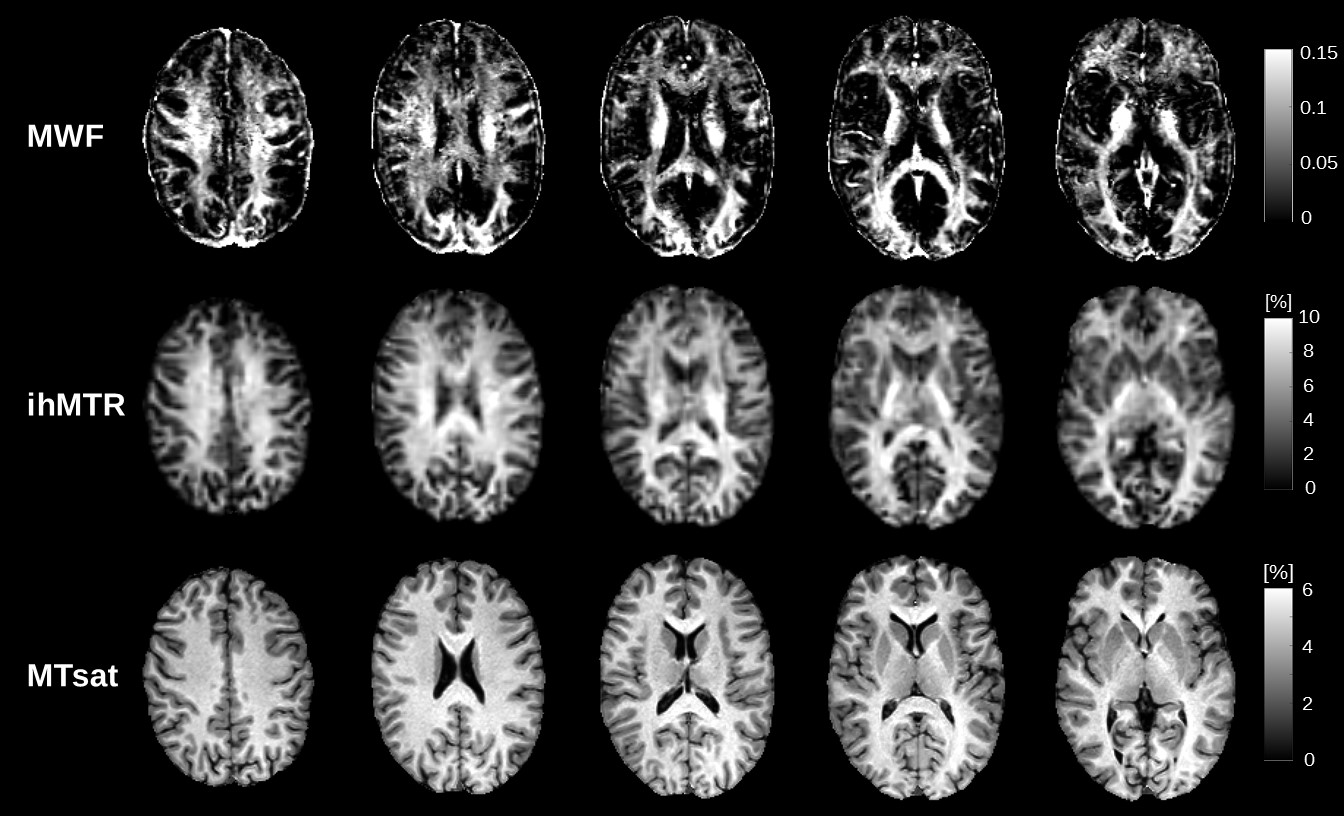
Figure 2: Five slices of MWF, ihMTR and MTsat maps
from a healthy subject. MWF
and ihMTR maps reveal marked differences in parameter values across white
matter and appear similar in their respective representation of different brain
areas. Brain regions that appear bright in MWF maps generally also show elevated
ihMTR values. MTsat parameter values in WM on the other hand appear more
homogeneous across WM and show less accordance with spatial patterns observed
in MWF and ihMTR maps.
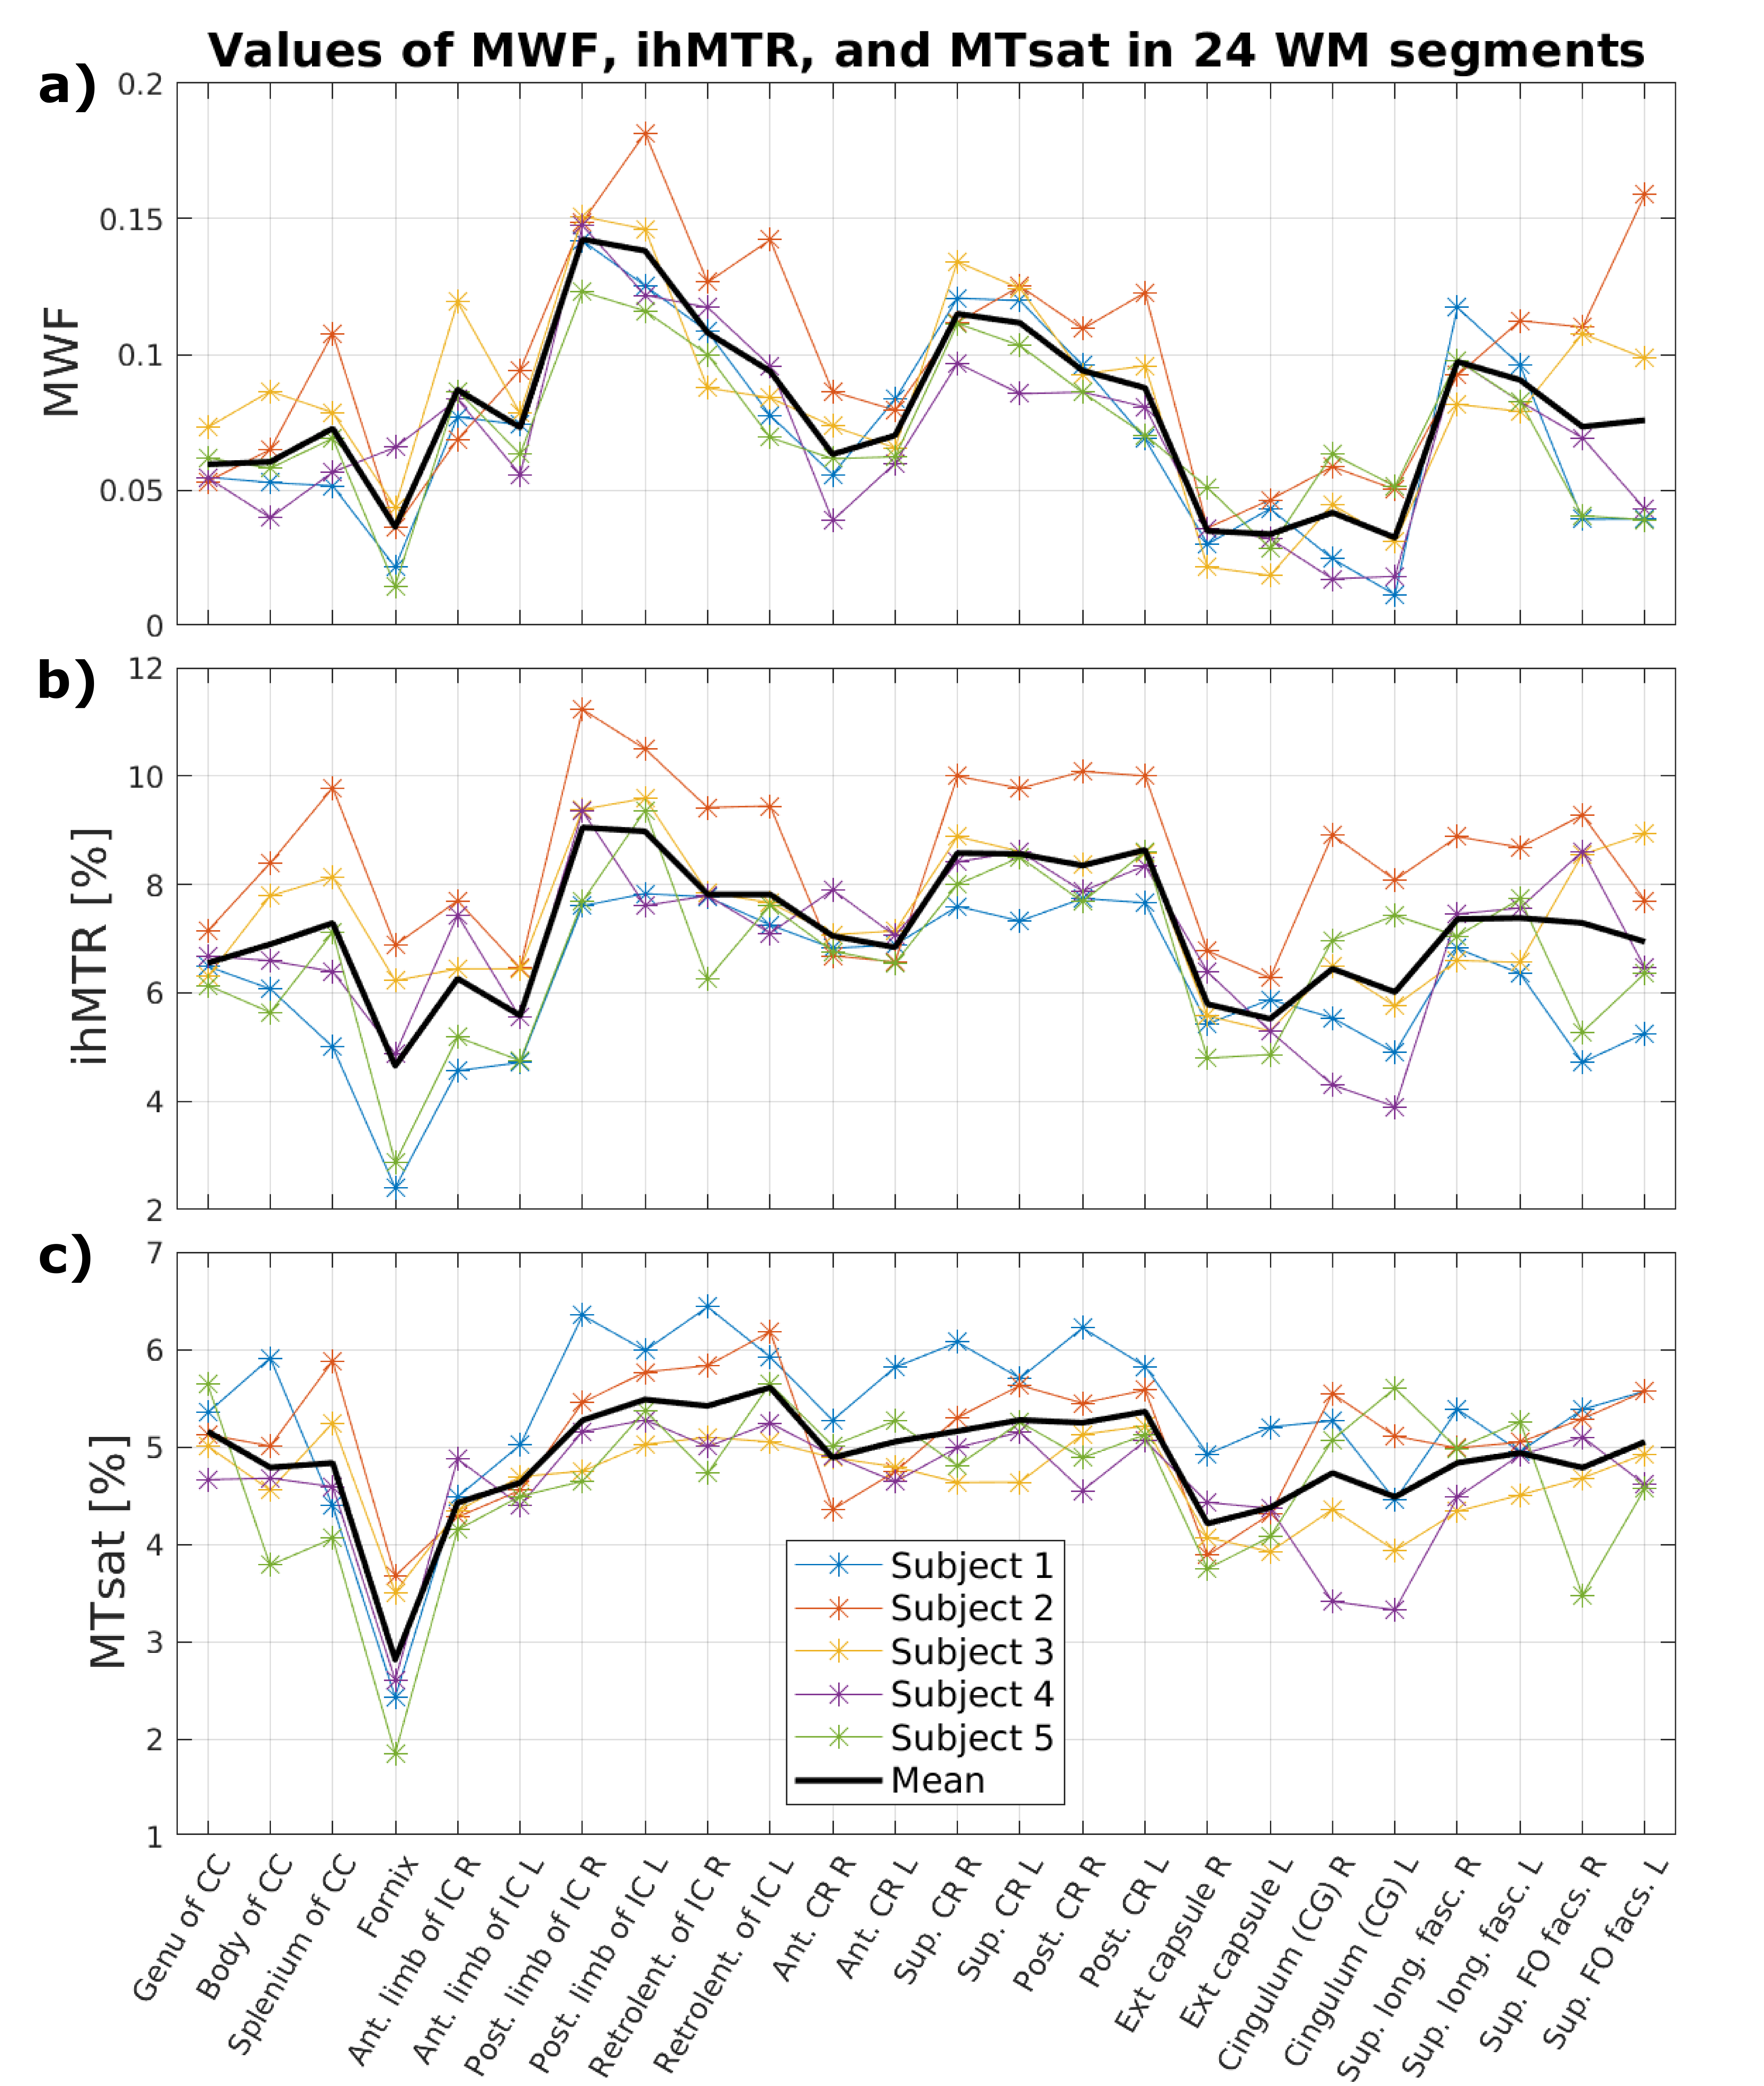
Figure 3: Mean values of MWF,
ihMTR and MTsat in 24 dorsal WM regions from five subjects. Average values of a) MWF,
b) ihMTR, and c) MTsat were obtained in 24 co-registered WM regions of the
JHU-ICBM white matter atlas for all subjects. The average over all subjects is
shown in black. As already indicated by the spatial similarity in the respective
parameter maps (Fig.2), VOI-average ihMTR and MWF values show a similar
behavior across different WM regions, while MTsat values appear more uniform
(except fornix).
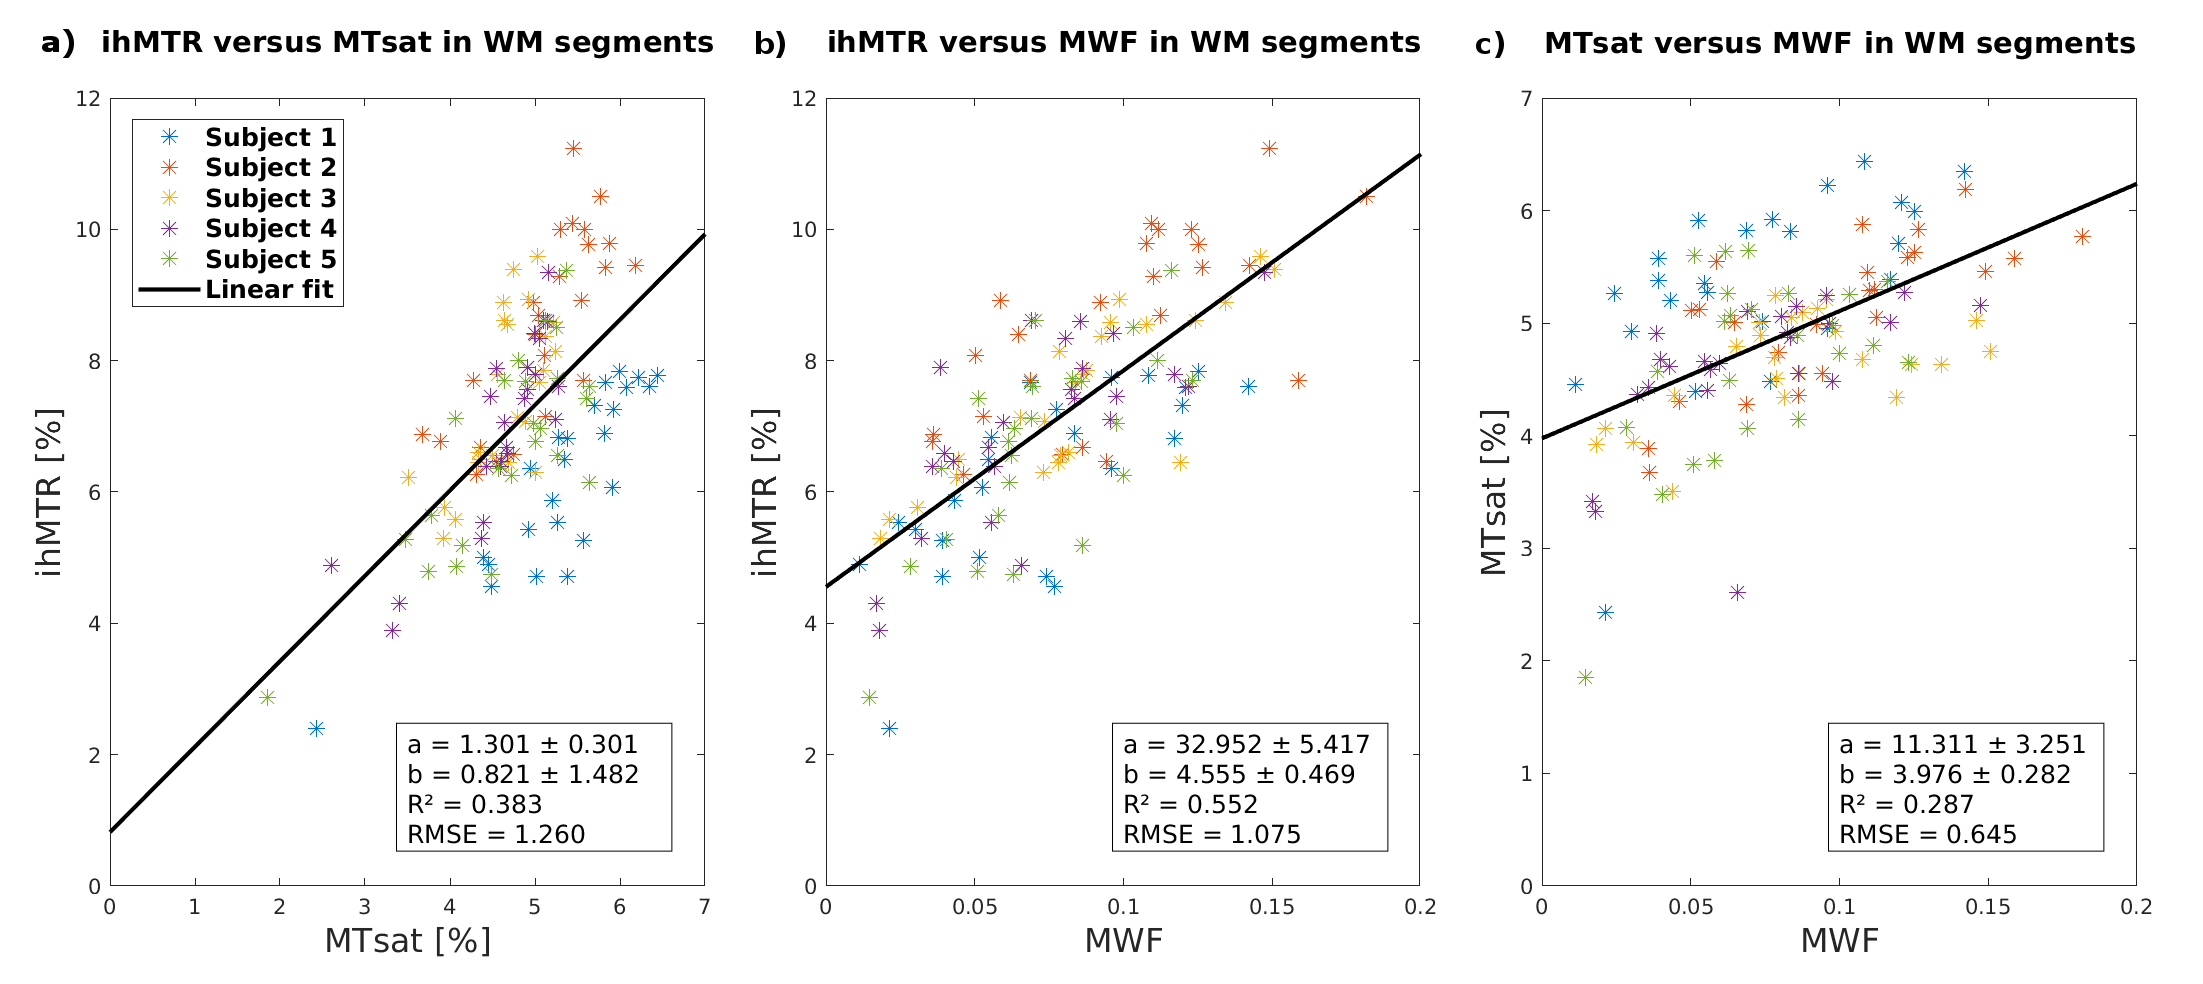
Figure 4: Correlations between mean ihMTR, MTsat and
MWF values in 24 dorsal WM regions of five subjects. Correlations and linear fits of a) ihMTR vs. MTsat,
b) ihMTR vs. MWF, and c) MTsat vs. MWF in WM are shown. Differences in the
correlations can be seen for different subjects. Subject 1 (blue) has a
decreased ratio of ihMTR/MTsat and rather decreased ratio of ihMTR/MWF while
MTsat/MWF is increased, whereas subject 2 (orange) has increased ratios of ihMTR/MTsat
and ihMTR/MWF but correlates well with the fit for MTsat/MWF in average.

Figure 5: Preliminary maps of a) myelin volume
fraction (MVF), b) axonal volume fraction (AVF), and c) g-ratio from healthy
subject of Fig.2. The
MVF was calculated from the MWF map according to West et al.22
Intra-cellular and isotropic volume compartments, obtained from the NODDI
analysis of DWI data, were used in combination with the MVF to calculate AVF.
The g-ratio was computed according to Cercignani et al.23 MVF agrees
with literature,23-25 while AVF and g-ratio appear elevated.23-25