0045
Differences in cortical and white matter myelination: a challenge for MRI myelin biomarkers.1Department of Neurophysics, Max Planck Institute for Human Cognitive and Brain Sciences, Leipzig, Germany, 2Center for Computational Neuroscience, Free University Berlin, Berlin, Germany, 3Paul Flechsig Institute of Brain Research, University of Leipzig, Leipzig, Germany, 4Institute of Neuroscience and Medicine, Forschungszentrum Jülich, Juelich, Germany, 5Zentralinstitut für Engineering, Elektronik und Analytik, Forschungszentrum Jülich, Juelich, Germany, 6C. und O. Vogt-Instituts für Hirnforschung, Heinrich-Heine-Universität Düsseldorf, Duesseldorf, Germany, 7Felix Bloch Institute for Solid State Physics, Leipzig University, Leipzig, Germany, 8Wellcome Centre for Human Neuroimaging, University College London, London, United Kingdom
Synopsis
Quantitative MRI parameters in the brain provide unique information on tissue myelination. However, the validation studies performing quantitative comparisons between MRI metrics and tissue myelin content are very limited, mainly due to the to the lack of methods for histological myelin quantification. Here, we explore lipid imaging using matrix-assisted laser desorption/ionization (MALDI) and multiple histological myelin stains in post-mortem human brain tissue samples for validation of MRI based myelin biomarkers. We show that tissue lipid composition vary across different cortical layers and white matter pathways, potentially reflecting differences in myelin structure and may impact MRI-based myelination metrics.
INTRODUCTION
Myelin, the fatty axon-insulating substance in the brain, is composed of a large variety of lipids, proteins and trapped water1. It is the main source of contrast in magnetic resonance images (MRI) of the human brain1–3. All MRI parameters, including longitudinal and transverse relaxation rates (R1, R2, R2*), proton density (PD), magnetisation transfer and magnetic susceptibility are sensitive to tissue myelination due to different biophysical mechanisms1,3–6. Therefore, quantitative MR parameters used as myelination biomarkers provide unique in vivo information on brain development, cortical myeloarchitecture, plasticity and neurodegeneration7–9. However, the mechanisms underlying the sensitivity of MRI parameters to tissue myelination are only partly understood and quantitative comparisons between MRI metrics and tissue myelination are limited to some few studies1,10. Moreover, specificity and sensitivity of R1, R2* and PD to myelin composition are only starting to be explored10. Validation of MRI-based myelin biomarkers is difficult due to the lack of methods for histological myelin quantification. Classical histological and immunohistochemistry stains provide only qualitative information on myelin distribution and reflect only some of the various myelin components. Recently developed advanced methods for lipid quantification promise to overcome this limitation11. Here, we systematically explore several methods for myelin quantification for the validation of MRI myelin biomarkers. To this end, we combined quantitative MRI in post mortem human brain tissue samples with histological and immunohistochemical myelin stainings and lipid imaging with matrix-assisted laser desorption/ionization mass spectrometry (MALDI-MSI).METHODS
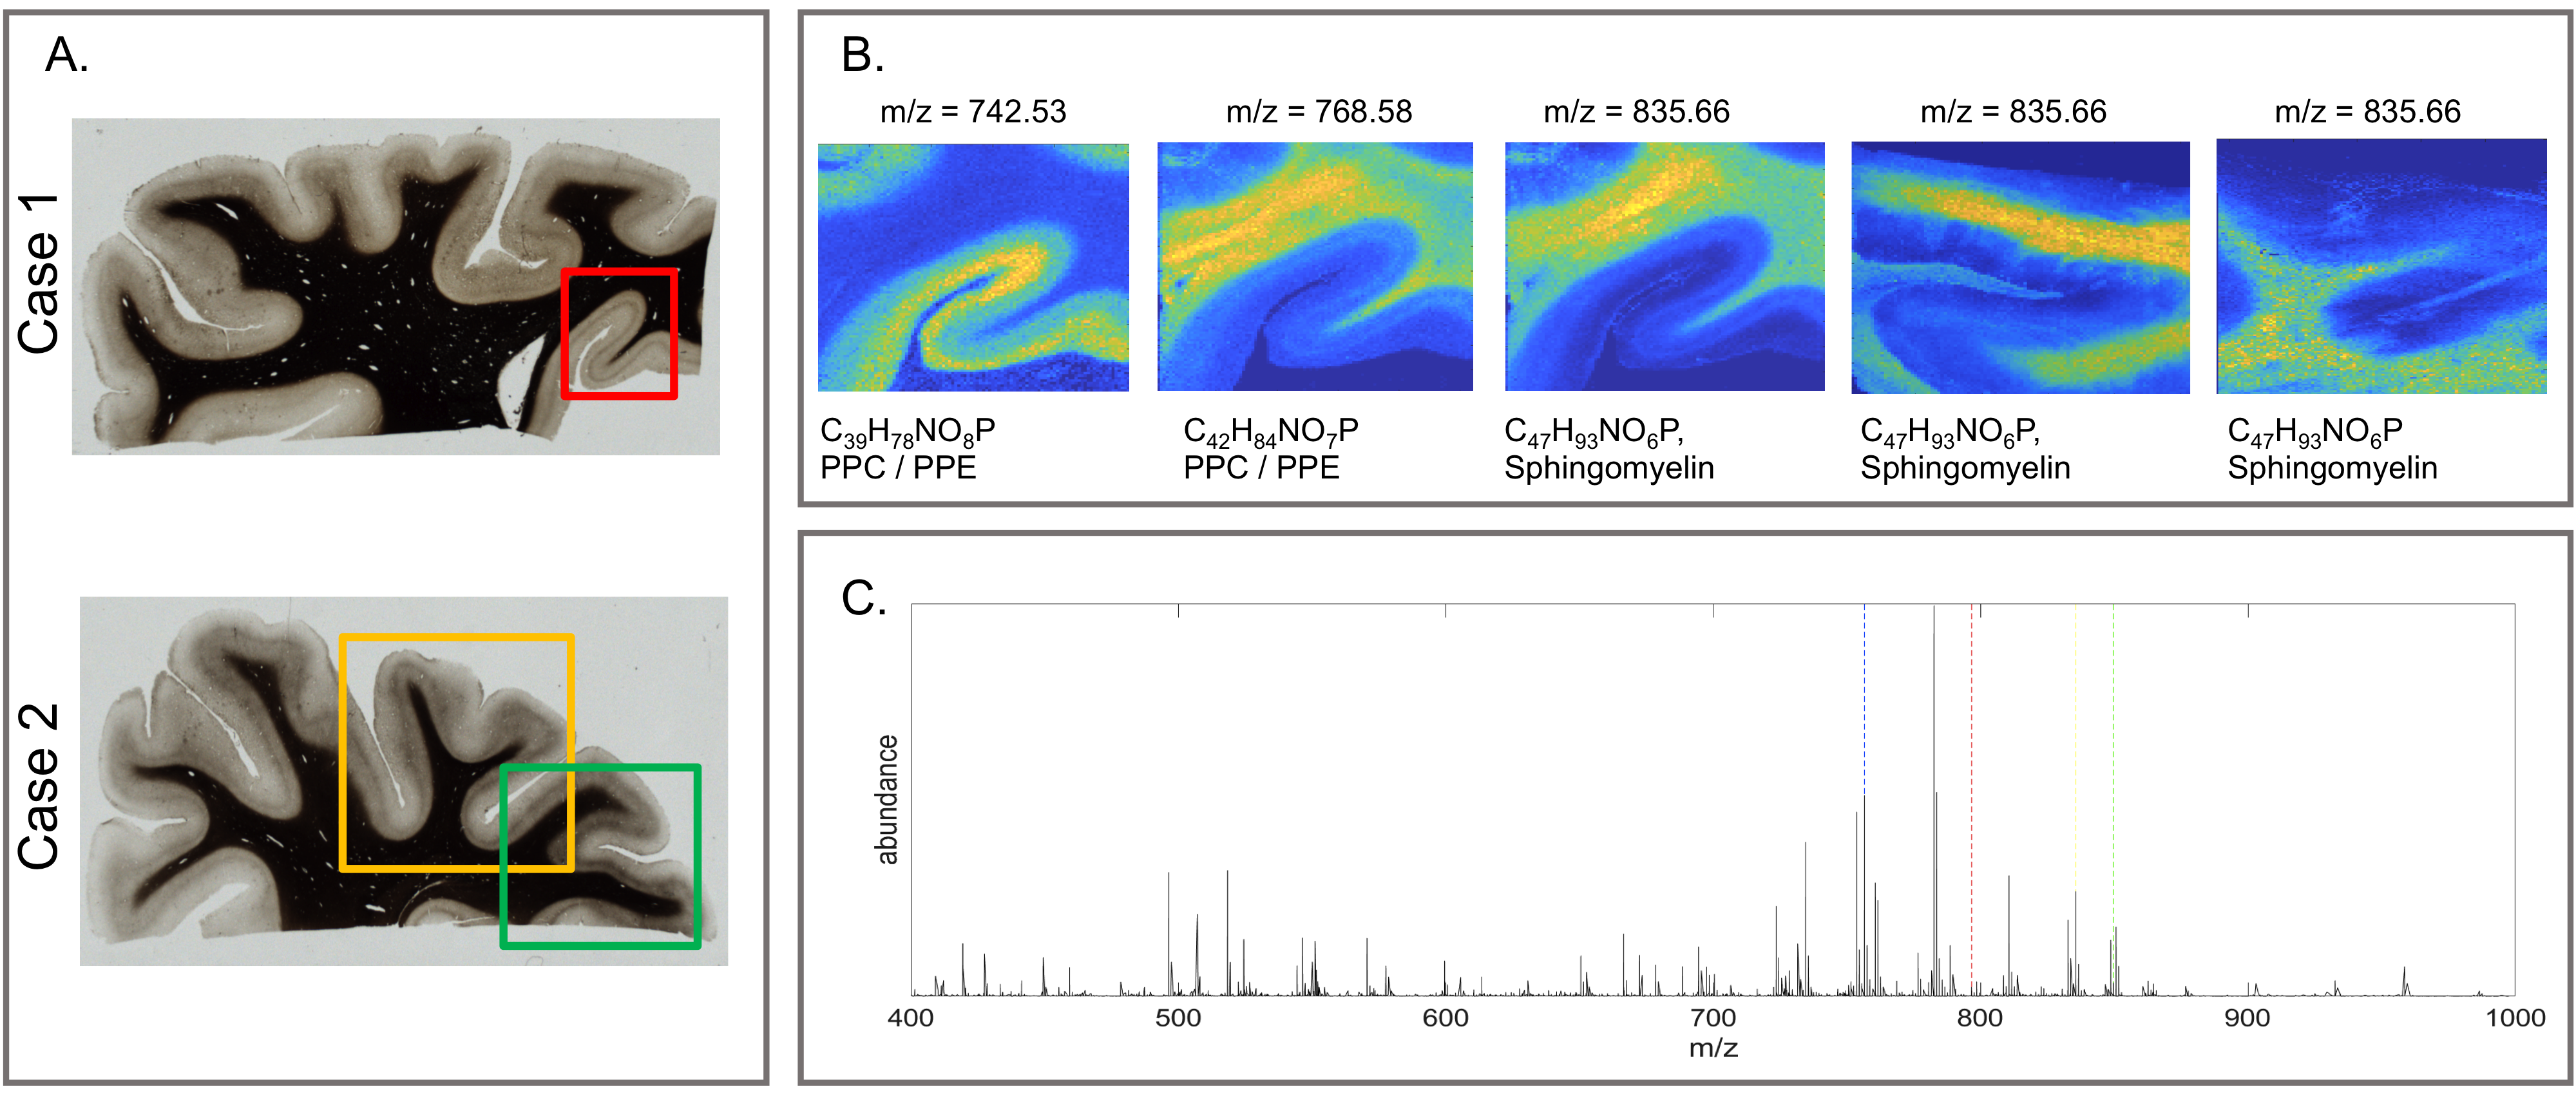
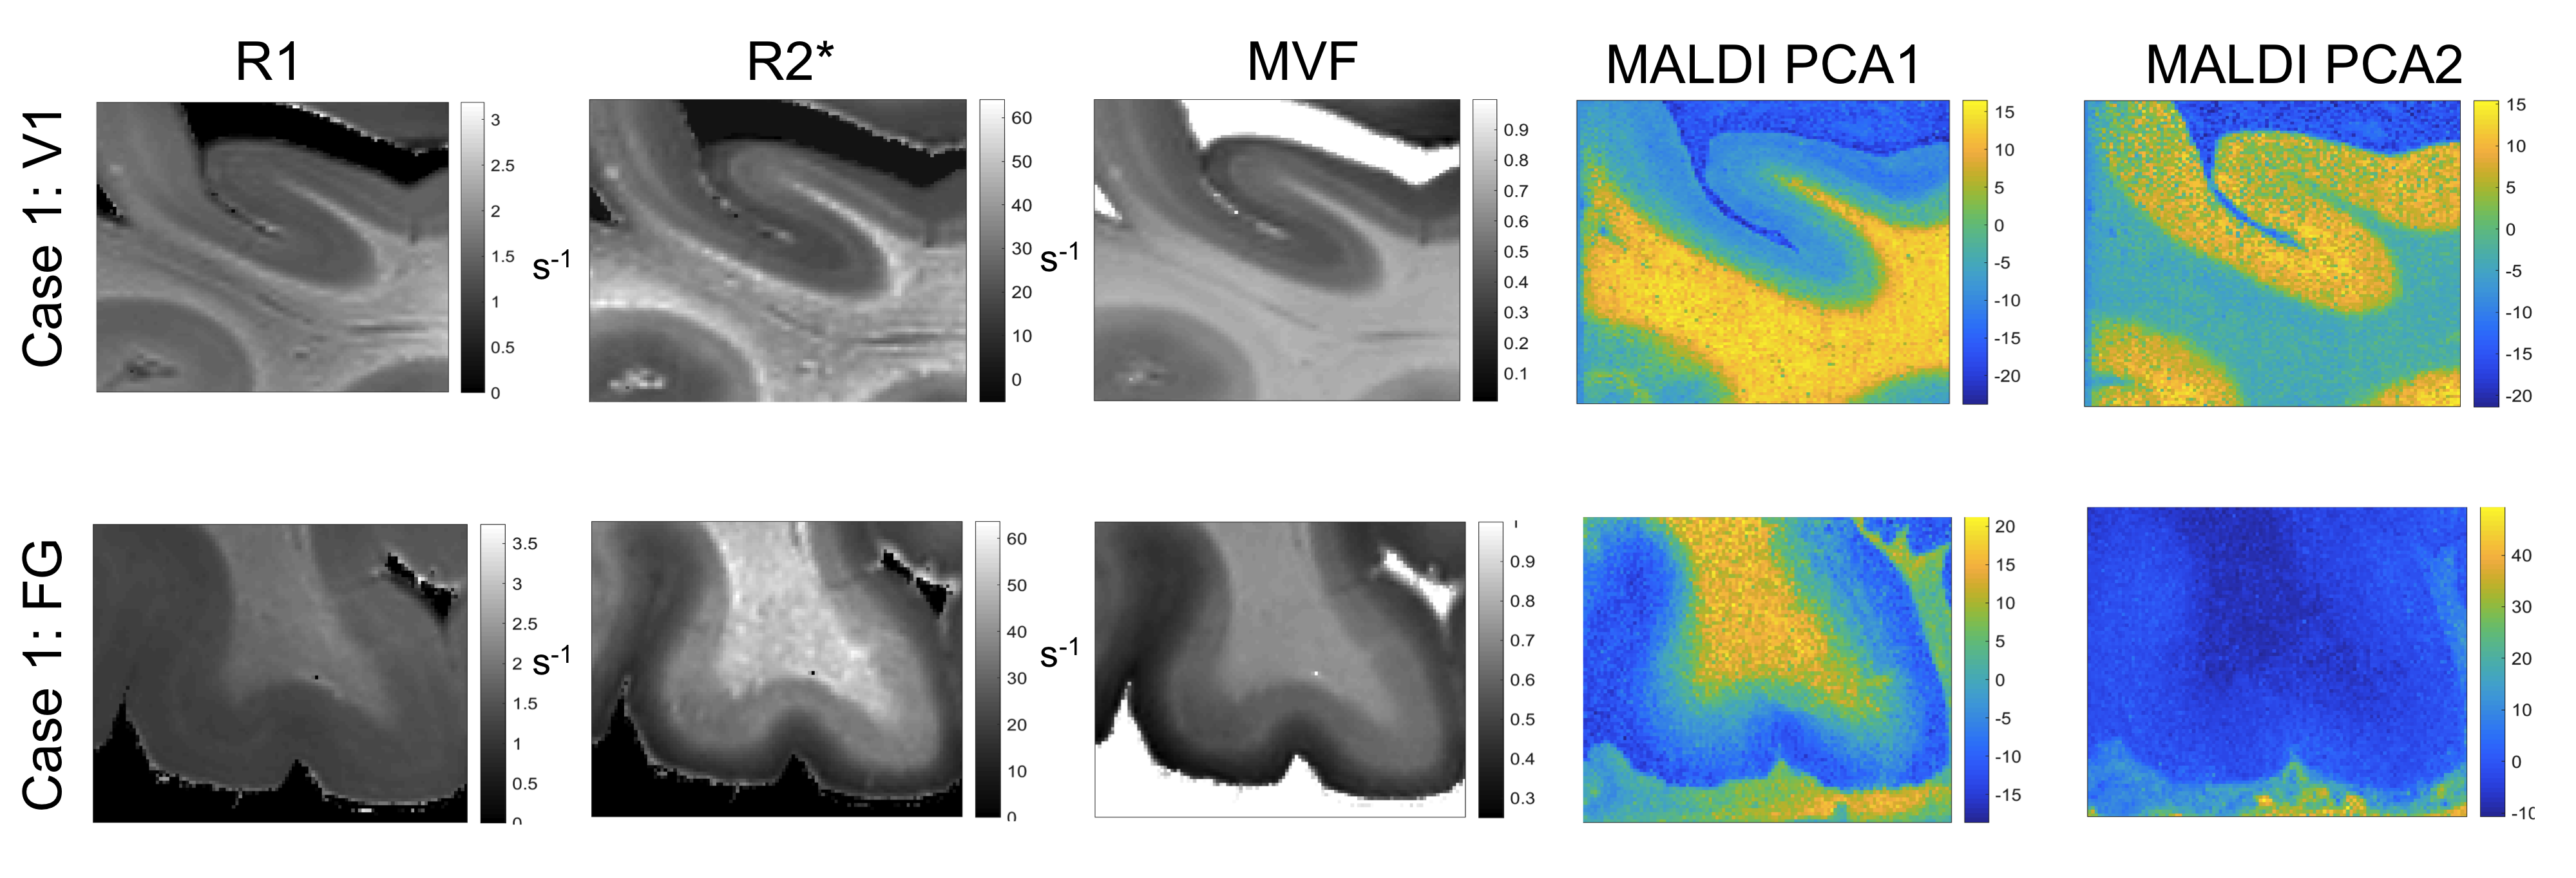
We investigated tissue blocks from five human post-mortem human brains, all containing the primary and higher visual cortices12. Multi-parametric maps13, including quantitative maps of R1, R2* and proton density (PD), were obtained on a 7T MRI system (Magnetom, Siemens Healthineers, Germany), using two FLASH acquisitions (TR=180ms, TE1-16=2.4-40ms, FA: 12° and 65°, isotropic resolution of 0.2 mm, additional calibration scan for flip angle (FA) mapping) and a customized version of hMRI toolbox (hMRI.info). Macromolecular volume fraction (MVF) maps were calculated using PD maps3. After completing MRI scanning, tissue blocks were infiltrated with 30% sucrose and 30 µm thick cryosections were obtained. Consecutive sections were stained with several myelin stains: a modified Gallyas stain14 (silver impregnation), Luxol Fast Blue15 (histological stain) and an antibody directed against myelin basic protein (MBP immunohistochemistry). Additionally, two of the samples underwent lipid assessment with MALDI-LTQ-Orbitrap (Thermo Scientific Fisher, Schwerte) using mass range of 400-1000 m/z. For the MALDI-MSI data, a principal component analysis (PCA) on 65 mass peaks corresponding to known lipids was computed. We then co-registered the MALDI-MSI lipid distribution maps with the quantitative MRI maps and performed voxel-wise correlation analysis.RESULTS AND DISCUSSION
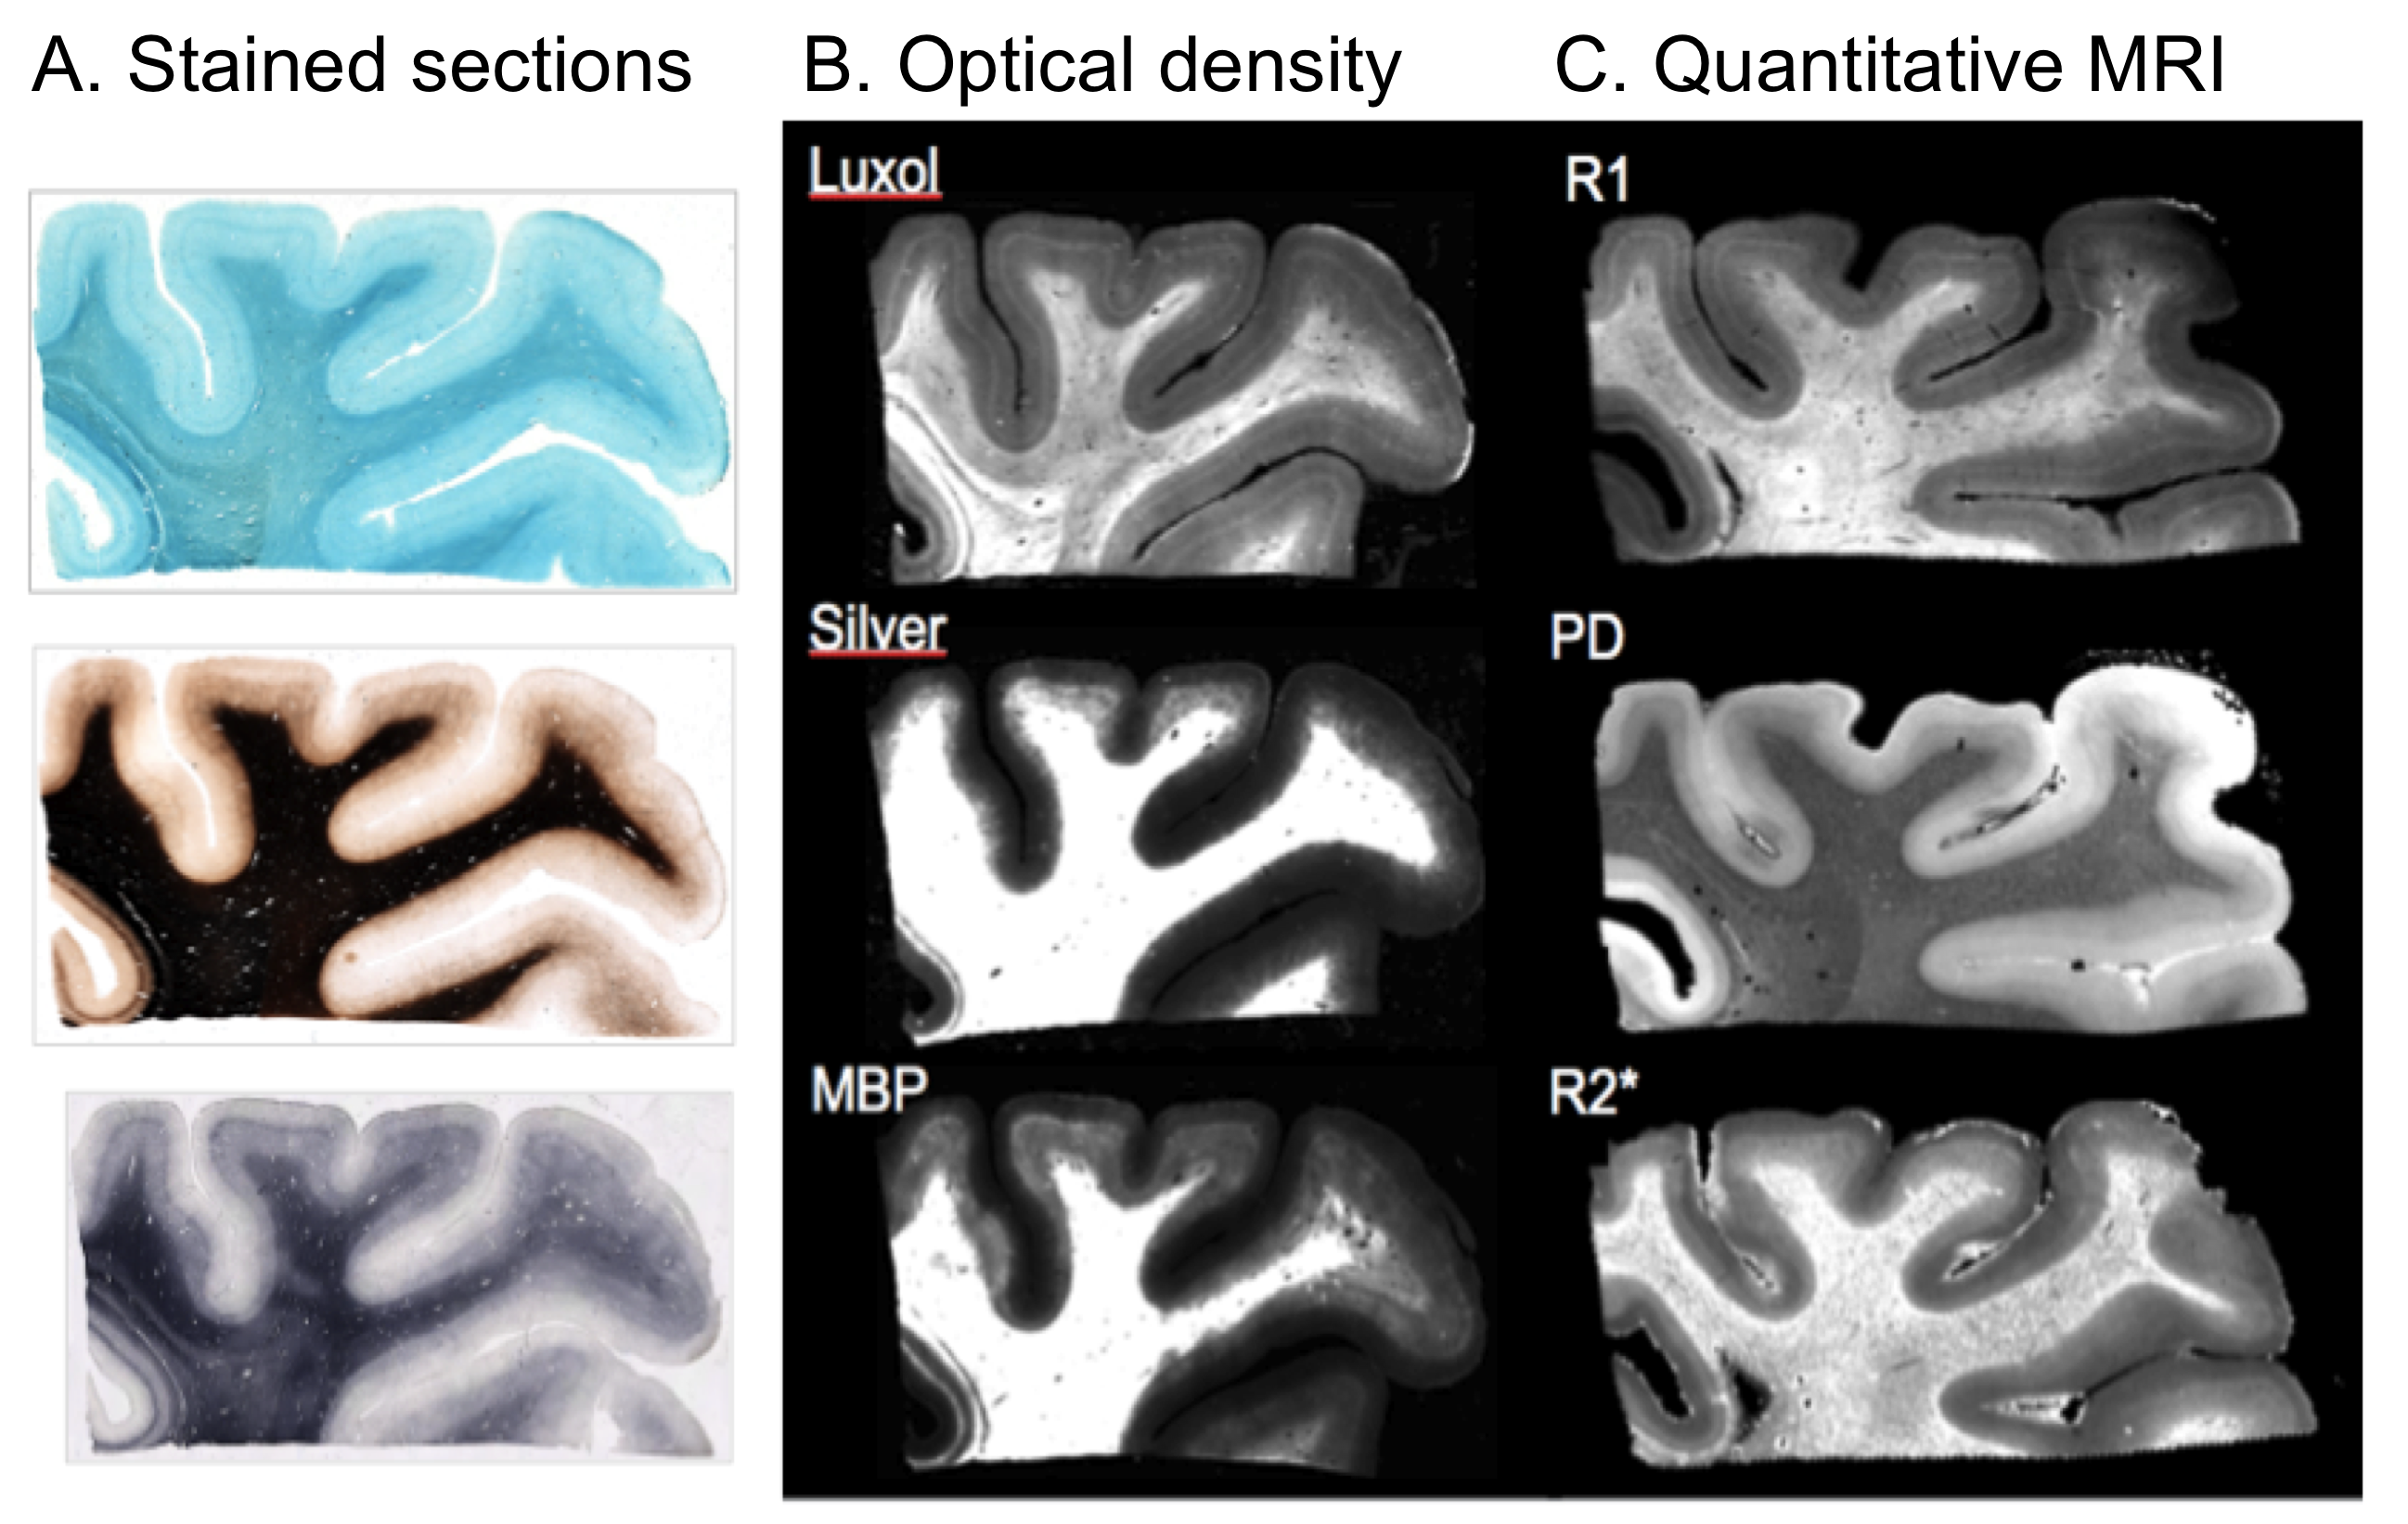
All myelin stains and all quantitative MR parameters showed high contrast between white and grey matter, with white matter having higher myelin content. However, the patterns of myelination revealed in the cortex differed between stains and parameters (Fig. 1). A gradient of myelin content from the pial surface to white matter boundary was prominent in the silver stain and anti-MBP immunohistochemistry, resembling the patterns observed in R2* and PD maps. Hyperintensity of layer IV was observed in the Luxol Fast Blue staining, corresponding to the pattern found in the R1 maps. MALDI-MSI revealed distinct distributions of lipid components in white and grey matter, cortical layers and in optic radiation (Fig. 2). This is important for interpretation of R1- and MT-based myelin biomarkers, since it has recently been demonstrated that lipid composition can influence relaxation properties of myelinated fibers10. The PCA suggested the presence of two main lipid components. Lipids of the first component were predominantly located in white matter, also demonstrating an intra-cortical gradient, and most likely reflect local myelin content (Fig.2). The lipids of the second components were mostly localized in the primary visual cortex. High spatial correlations between the first PCA component and the MRI metrics were observed (pixel-wise Pearson correlation coefficient of r=0.66 for R1, r=0.78 for R2* and r=0.84 for MVF), with the proton-density based measure showing the highest correlation with the abundance of myelin lipids.CONCLUSIONS
We demonstrate that different histological stains for myelin detection provide similar, but distinct information on tissue myelination, particularly in the cortex. Differences between histological methods potentially correspond to differences in specificity between MRI-based myelin markers. Therefore, the assessment of cortical myelin with histology is not comprehensive and requires the use of multiple stains. We show that lipid composition of tissue varies across different cortical layers and white matter pathways, potentially reflecting differences in myelin structure. We suggest that a principal component analysis of MALDI-MSI lipid maps can be used to obtain a histological myelin biomarker for the validation of quantitative MRI parameters. Our results demonstrate that MALDI-MSI is a powerful tool for validation of myelin MR markers and that difference in lipid composition of the cortex and in white matter pathways should be taken into account when interpreting MRI-based maps of brain myelination.Acknowledgements
The research leading to these results has received funding from the European Research Council under the European Union's Seventh Framework Programme (FP7/2007-2013) / ERC grant agreement n° 616905 and the BMBF (01EW1711A & B) in the framework of ERA-NET NEURON. Further, this work was supported by the German Research Foundation (DFG Priority Program 2041 ”Computational Connectomics”, MO 2249/3-1 and the Alzheimer-Forschung-Inititiative e.V., (AFI # 18072).References
1. Laule, C. et al. Magnetic resonance imaging of myelin. Neurotherapeutics 4, 460–484 (2007).
2. West, K. L. et al. Myelin volume fraction imaging with MRI. NeuroImage (2016) doi:10.1016/j.neuroimage.2016.12.067.
3. Mezer, A. et al. Quantifying the local tissue volume and composition in individual brains with magnetic resonance imaging. Nat. Med. 19, 1667–1672 (2013).
4. Edwards, L. J., Kirilina, E., Mohammadi, S. & Weiskopf, N. Microstructural imaging of human neocortex in vivo. NeuroImage 182, 184–206 (2018).
5. Cohen-Adad, J. What can we learn from T2* maps of the cortex? NeuroImage 93 Pt 2, 189–200 (2014).
6. Wharton, S. & Bowtell, R. Fiber orientation-dependent white matter contrast in gradient echo MRI. Proc. Natl. Acad. Sci. 109, 18559–18564 (2012).
7. Gomez, J. et al. Microstructural proliferation in human cortex is coupled with the development of face processing. Science 355, 68–71 (2017).
8. Glasser, M. F. et al. A multi-modal parcellation of human cerebral cortex. Nature 536, 171–178 (2016).
9. Sereno, M. I., Lutti, A., Weiskopf, N. & Dick, F. Mapping the Human Cortical Surface by Combining Quantitative T1 with Retinotopy. Cereb. Cortex 23, 2261–2268 (2013).
10. Filo, S. et al. Disentangling molecular alterations from water-content changes in the aging human brain using quantitative MRI. Nat. Commun. 10, 1–16 (2019).
11. González de San Román, E. et al. Molecular composition of the human primary visual cortex profiled by multimodal mass spectrometry imaging. Brain Struct. Funct. 223, 2767–2783 (2018).
12. Natu, V. S. et al. Apparent thinning of human visual cortex during childhood is associated with myelination. Proc. Natl. Acad. Sci. 116, 20750–20759 (2019).
13. Weiskopf, N. et al. Quantitative multi-parameter mapping of R1, PD*, MT, and R2* at 3T: a multi-center validation. Front. Neurosci. 7, 95 (2013).
14. Gallyas, F. Silver staining of myelin by means of physical development. Neurol. Res. 1, 203–209 (1979).
15. Kluver, H. & Barrera, E. A method for the combined staining of cells and fibers in the nervous system. J. Neuropathol. Exp. Neurol. 12, 400–403 (1953).
Figures