0044
Accurate cervical spinal cord area measurements can be extracted from brain images1University of British Columbia, Vancouver, BC, Canada
Synopsis
Multiple Sclerosis (MS) is a demyelinating disease of the central nervous system, with MRI routinely performed for brain but often neglected in spinal cord. When cord imaging IS performed, atrophy is usually assessed at the C2/3 segment. We aimed to validate cord cross-sectional-area (CSA) measurements using T1-weighted whole-brain images. In controls, strong correlations were seen between C1 CSA from cord and brain images, and between C1 and C2/3 CSA from cord images.
In MS, C1 CSA from brain images and C2/3 CSA from cord images correlated. We showed that metrics obtained from brain images could provide relevant cord atrophy measures.
Introduction
Multiple sclerosis (MS) is an inflammatory, demyelinating disease that causes degeneration of the central nervous system. Spinal cord lesions are visible in over 80% of MS patients and correlate with clinical disability1. Spinal cord atrophy has also been associated with disability, especially for the progressive phenotypes of MS2. Therefore, cord atrophy measurements could provide a valuable, clinically relevant metric for the monitoring and prognosis of MS. The C2/3 segment of the cervical cord is traditionally used to assess atrophy in MS3.However, the spinal cord is imaged far less frequently than the brain due to the artifacts caused by cerebrospinal fluid flow, an inhomogeneous magnetic environment, small cord cross-sectional area (CSA), and cardiorespiratory motion4. Furthermore, coil changes are often required when collecting both brain and cervical cord images, creating practical limitations and hence de-prioritizing cord imaging2. Fortuitously, high-resolution T1-weighted brain imaging, which is frequently obtained for MS brain for volumetric assessment, typically captures the upper cervical C1 cord region. If C1 CSA accurately reflects C2/C3 CSA, which has been established as clinically relevant, spinal cord area measures could be obtained using only a standard T1-weighted brain image. This would dramatically expand access to information about the spinal cord.
Our objectives were to compare:
(1) C1 CSA from brain MRI to C1 CSA from cord MRI and
(2) C1 CSA to C2/C3 CSA from cord MRI in healthy controls and MS.
Methods
Data were collected from 28 healthy controls and 73 MS participants at 3.0T (Achieva, Philips, Best, The Netherlands).Brain imaging
T1-weighted 3D magnetization-prepared rapid gradient-echo (MPRAGE) (TR/TE/TI=8.1/3.5/1052ms, shot interval 3000ms, acquired at 1mm isotropic, field-of-view=256x256x165mm3) using an 8-channel head coil.
Spinal cord imaging
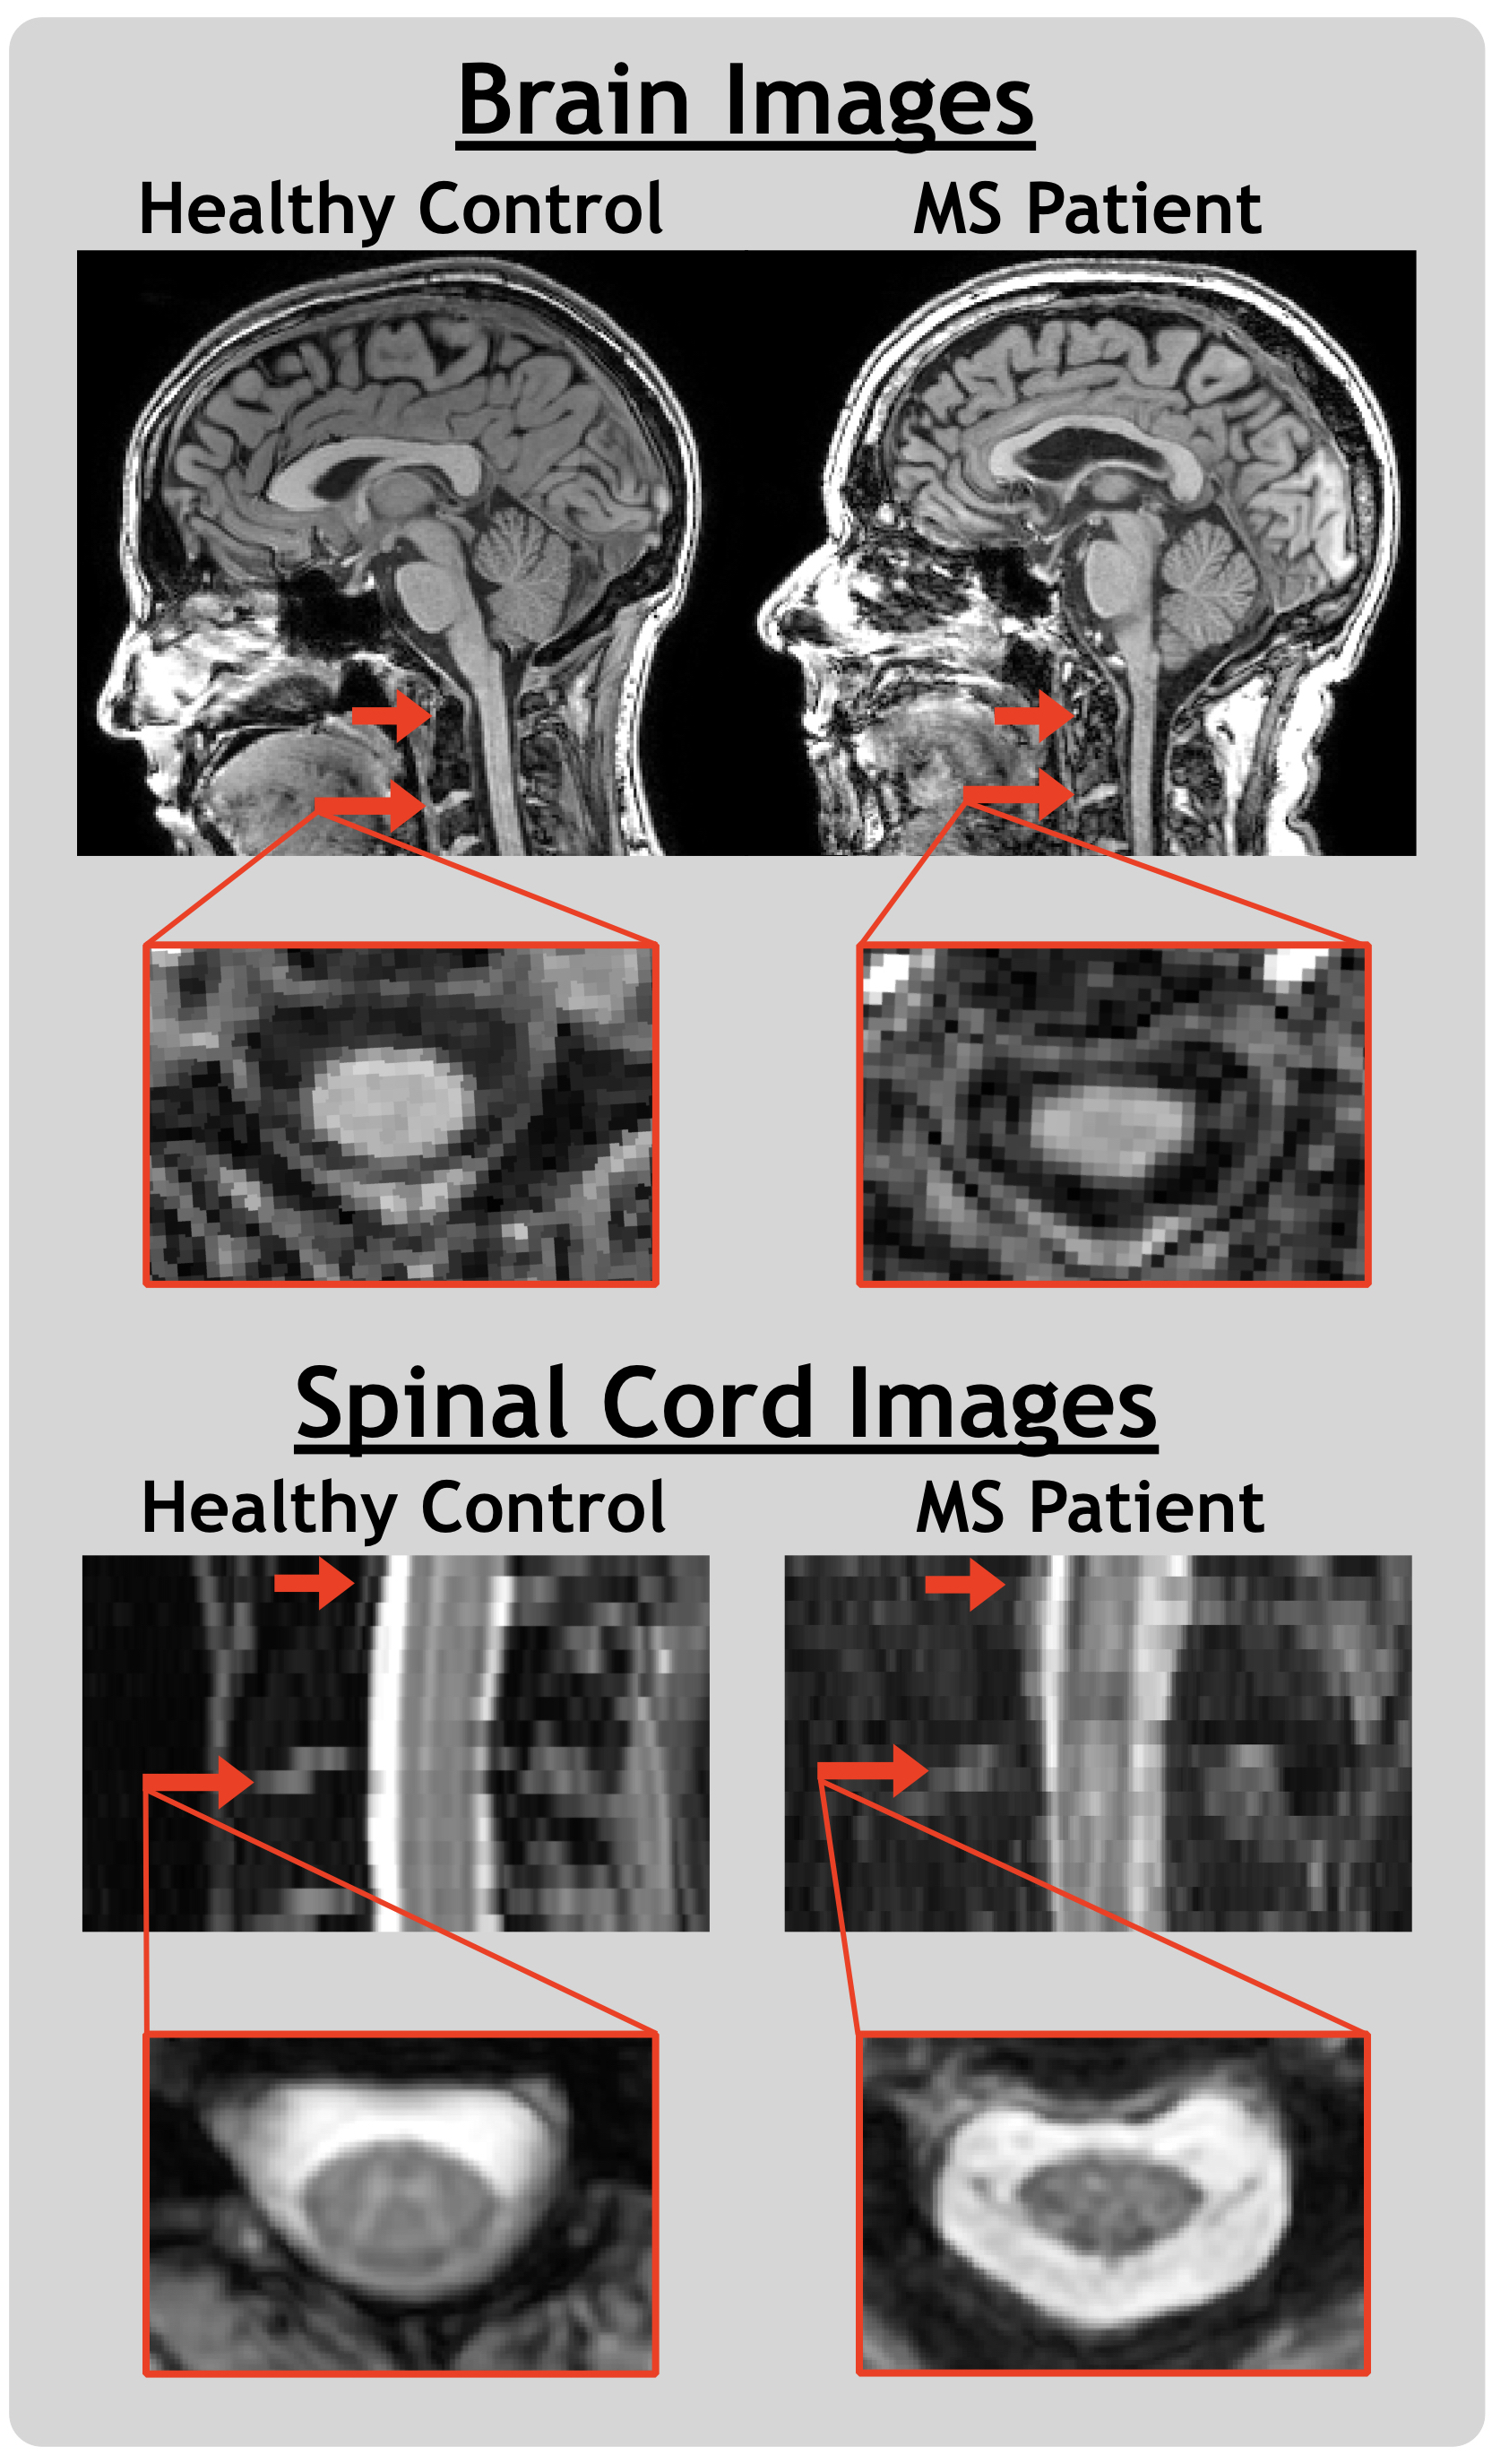
T2*-weighted multi-echo fast gradient echo (mFFE) centred at the level of the C2/C3 disc (16 slices, TR/TE1/TE2-5=815/6.6/8.2ms, acquired at 0.8x0.8x2.5mm3, field-of-view=150x150x44mm3) using a 6-channel spine coil. Representative images are shown in Figure 1.
Analysis
Spinal Cord Toolbox5-7 was used to (1) perform automated segmentation of the spinal cord; (2) label cord levels based on a manually identified C2/C3 disc, vertebral column and intervertebral disc intensities, and a template reference; (3) extract CSA averaged across C1 and C2/3 levels. Quality of the automated whole-cord segmentations was not affected by the presence of lesions. Spearman correlation coefficients (r) and 95% confidence intervals were calculated for relationships between CSA, based on cord or brain images, at different levels. A group comparison between brain image C1 CSA and cord image C1 CSA is presented as a mean with 95% confidence interval and analyzed using Wilcoxon paired t-tests.
Results
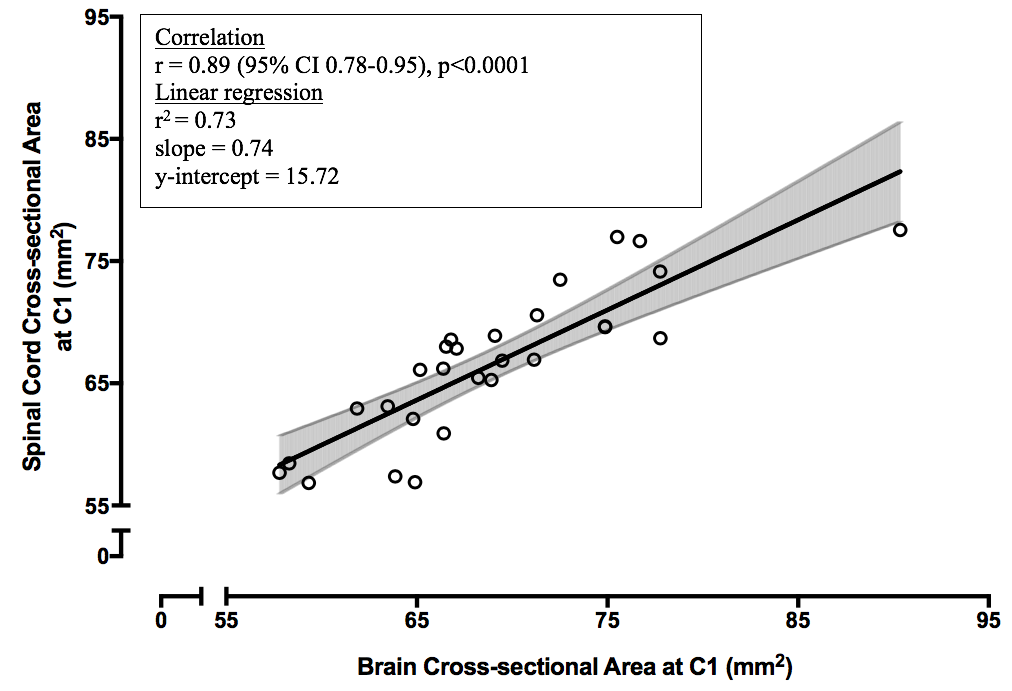
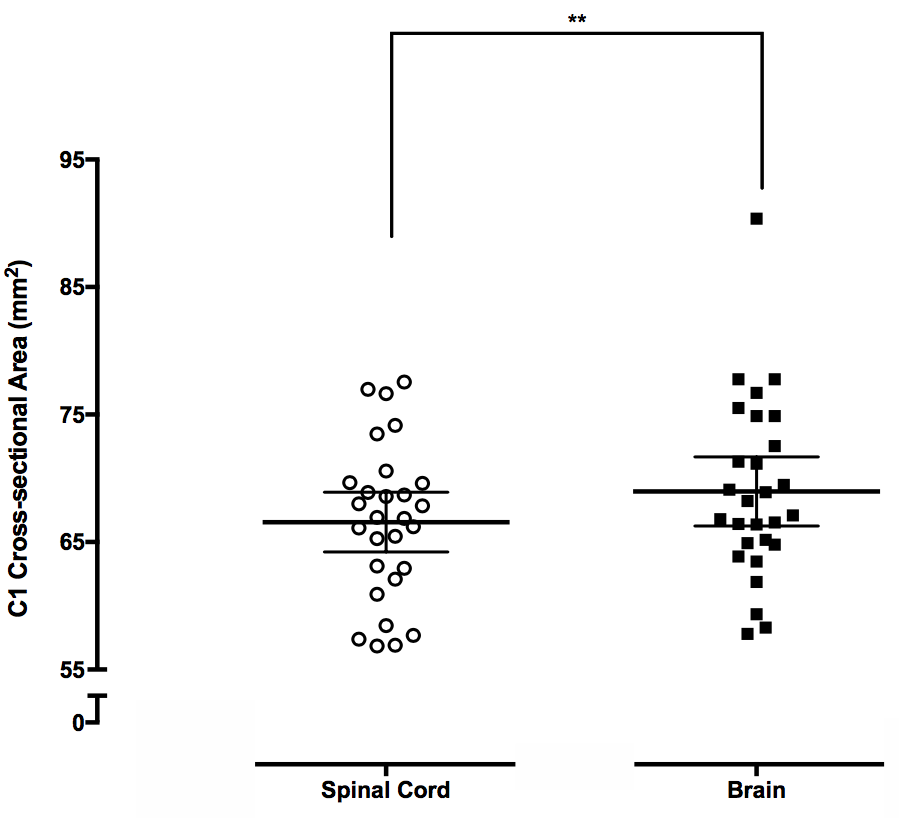
C1 CSA from brain images versus C1 CSA from cord images for healthy controlsC1 CSA derived from cord was positively correlated with brain image-derived C1 CSA (r=0.89 (0.78-0.95), p<0.0001, Figure 2). A non-parametric paired t-test showed a small but significant mean difference between cord-derived and brain-derived C1 CSA of 2.41mm2 (1.00-3.82mm2 , p=0.004) (Figure 3).
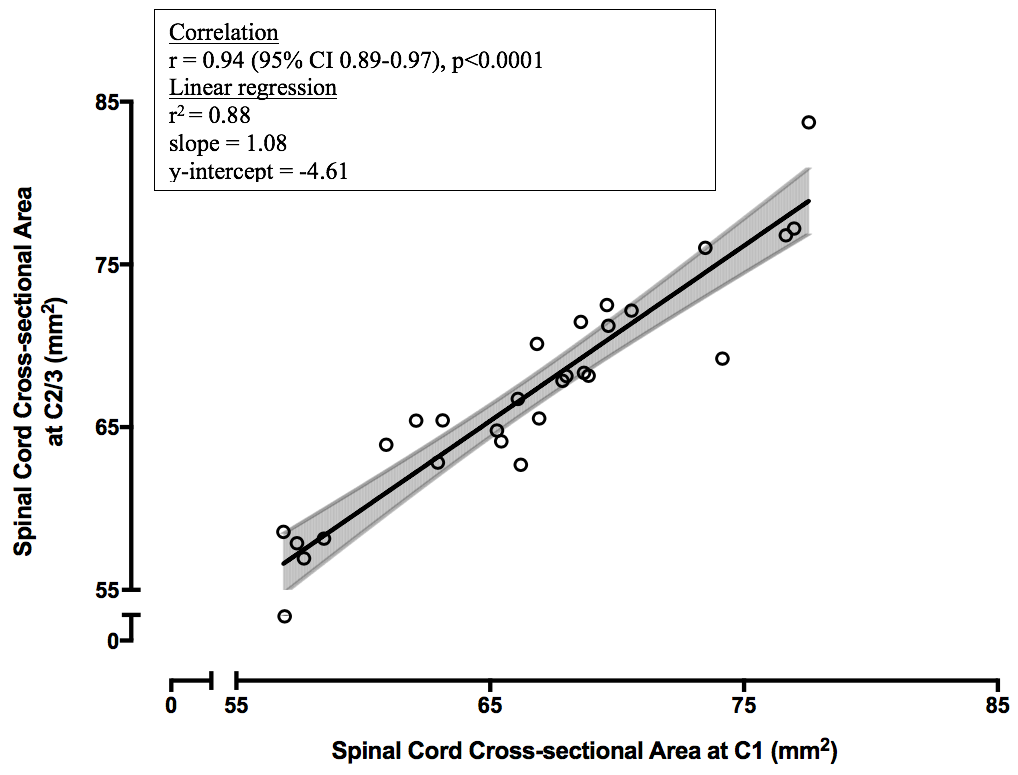
C1 CSA versus C2/3 CSA from cord images for healthy controls
C1 CSA was positively correlated with C2/3 CSA (r=0.94 (0.89-0.97), p<0.0001, Figure 4).
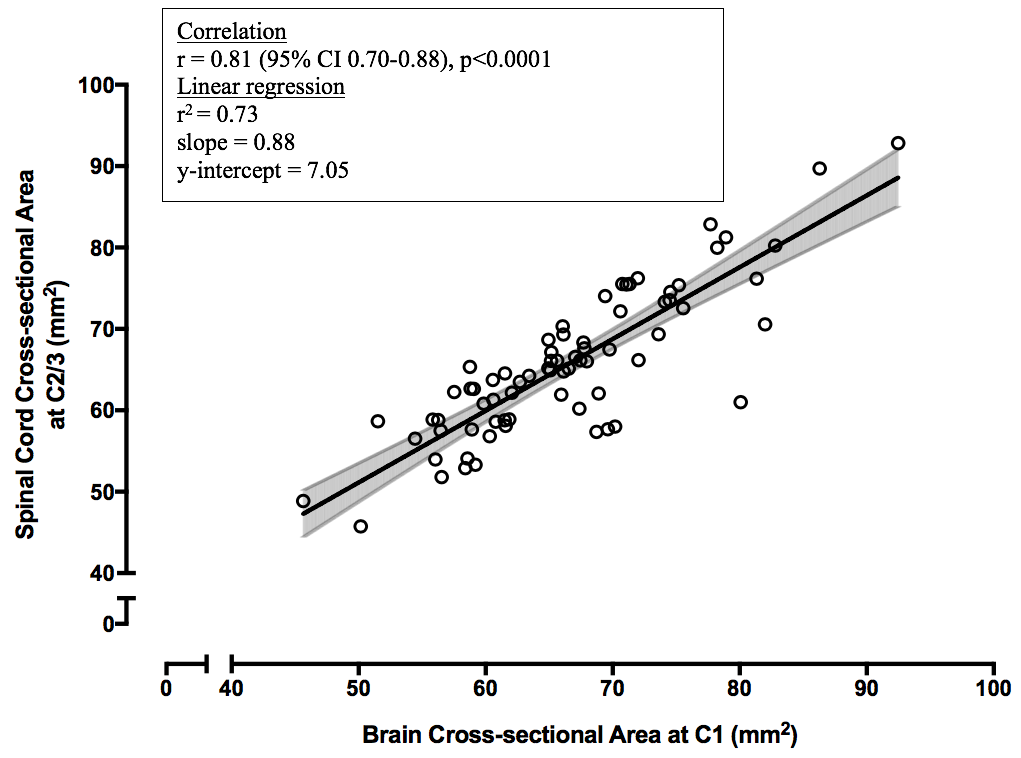
C1 CSA from brain images versus C2/3 CSA from cord images for MS participants
C1 CSA derived from brain images was positively correlated with C2/3 CSA from cord images (r=0.81 (0.70-0.88), p<0.0001, Figure 5).
Discussion
There was a strong correlation between C1 CSA obtained from brain and cord images, which supports the feasibility of acquiring an accurate C1 CSA measurement using T1-weighted brain images alone. The small bias between brain and cord image CSA may be due to a consistent difference between the cord/cerebrospinal-fluid segmentation boundary of T1 and T2* weighted images.A positive correlation was seen between C1 and C2/3 CSA using spinal cord scans. Although C2/3 is traditionally used for CSA analysis, our study indicates that C1 may also be used. Finally, a strong correlation was observed between C1 CSA from MS brain images when compared to their C2/3 CSA using spinal cord images. This further supports the feasibility of acquiring cord area measurements with brain images in the presence of MS pathology, reflecting an established and clinically relevant measure of cord area at C2/C3.
Our data suggests that valuable spinal cord area information can be obtained using standard 3DT1 brain scans alone. This falls in line with previous studies done by Liu et al., who showed that measurement at 2.5cm below the pons in brain images is an appropriate surrogate for upper cord atrophy8, and Papinutto et al., who showed excellent C2-C3 area reliability when derived from brain scans9. Brain imaging also generally acquires a larger field-of-view with higher resolution and more-isotropic voxels, making it preferable for quantifying atrophy from a technical perspective. Furthermore, this opens the possibility to perform retrospective spinal cord atrophy studies on cohorts without spinal cord imaging. This could help shed light on progression in MS, which is thought to be closely related to spinal cord atrophy.
Conclusion
CSA at the C1 level calculated from brain scans is strongly correlated with CSA at C2/3 calculated from separate spinal cord imaging. Measures derived from high-quality brain imaging could potentially provide convenient, clinically relevant measures of spinal cord area.Acknowledgements
We would like to thank the participants for volunteering their time for this study, and the UBC MRI Research Centre. Funding support for this study was provided by the MS Society of Canada and an Natural Sciences and Engineering Research Council of Canada (NSERC) Discovery Grant [F17-05113]. Adam Dvorak is in receipt of a 4-Year Doctoral Fellowship from the University of British Columbia.References
1. Bot, J.C., et al., Spinal cord abnormalities in recently diagnosed MS patients: added value of spinal MRI examination. Neurology, 2004. 62(2): p. 226-33.
2. Kearney, H., D.H. Miller, and O. Ciccarelli, Spinal cord MRI in multiple sclerosis--diagnostic, prognostic and clinical value. Nat Rev Neurol, 2015. 11(6): p. 327-38.
3. Healy, B.C., et al., Approaches to Normalization of Spinal Cord Volume: Application to Multiple Sclerosis. Journal of Neuroimaging, 2012. 22(3): p. E12-E19.
4. Stroman, P.W., et al., The current state-of-the-art of spinal cord imaging: Methods. Neuroimage, 2014. 84: p. 1070-1081.
5. Gros, C., et al., Automatic segmentation of the spinal cord and intramedullary multiple sclerosis lesions with convolutional neural networks. Neuroimage, 2018. 184: p. 901-915.
6. De Leener, B., et al., SCT: Spinal Cord Toolbox, an open-source software for processing spinal cord MRI data. Neuroimage, 2017. 145(Pt A): p. 24-43.
7. Cohen-Adad, J., et al. Spinal Cord Toolbox: an open-source framework for processing spinal cord MRI data. in Proceedings of the 20th Annual Meeting of OHBM, Hamburg, Germany. 2014.
8. Liu Z, Yaldizli Ö, Pardini M, et al. Cervical cord area measurement using volumetric brain magnetic resonance imaging in multiple sclerosis. Mult Scler Relat Disord. 2015;4(1):52-57.
9. Papinutto N, Bakshi R, Bischof A, et al. Gradient nonlinearity effects on upper cervical spinal cord area measurement from 3D T1 -weighted brain MRI acquisitions. Magn Reson Med. 2018;79(3):1595-1601.
Figures