0042
Cervical- and Thoracic-Cord Atrophy Correlates with Clinical Disability Scores in Various Multiple Sclerosis Phenotypes1National Institutes of Health, Bethesda, MD, United States
Synopsis
We sought to better understand the relationship between atrophy along the entire spinal cord and disease burden in multiple sclerosis using MRI. Towards this, we analyzed spinal cord cross-sectional area in 48 healthy control and 250+ subjects clinically diagnosed with various phenotypes of multiple sclerosis. Our results show cervical cord atrophy early in the onset of the disease, which correlated with clinical measures of disease severity. However, these correlations were reduced as the disease progressed. Such studies may help in better understanding of disease progression and can play a role as an imaging marker in clinical trials.
Introduction
Atrophy in the spinal cord contributes to disability in patients with multiple sclerosis (MS).1,2 Its quantification from the entire spinal cord may be important to fully understand the diseases.3 We compared spinal cord cross-sectional area (SCCSA) along the entire cord in various MS phenotypes (primary progressive or PP; relapsing remitting or RR; secondary progressive or SP) and healthy control subjects (HC), and investigated correlation of SCCSA at various levels with clinical markers of disability in MS.Methods
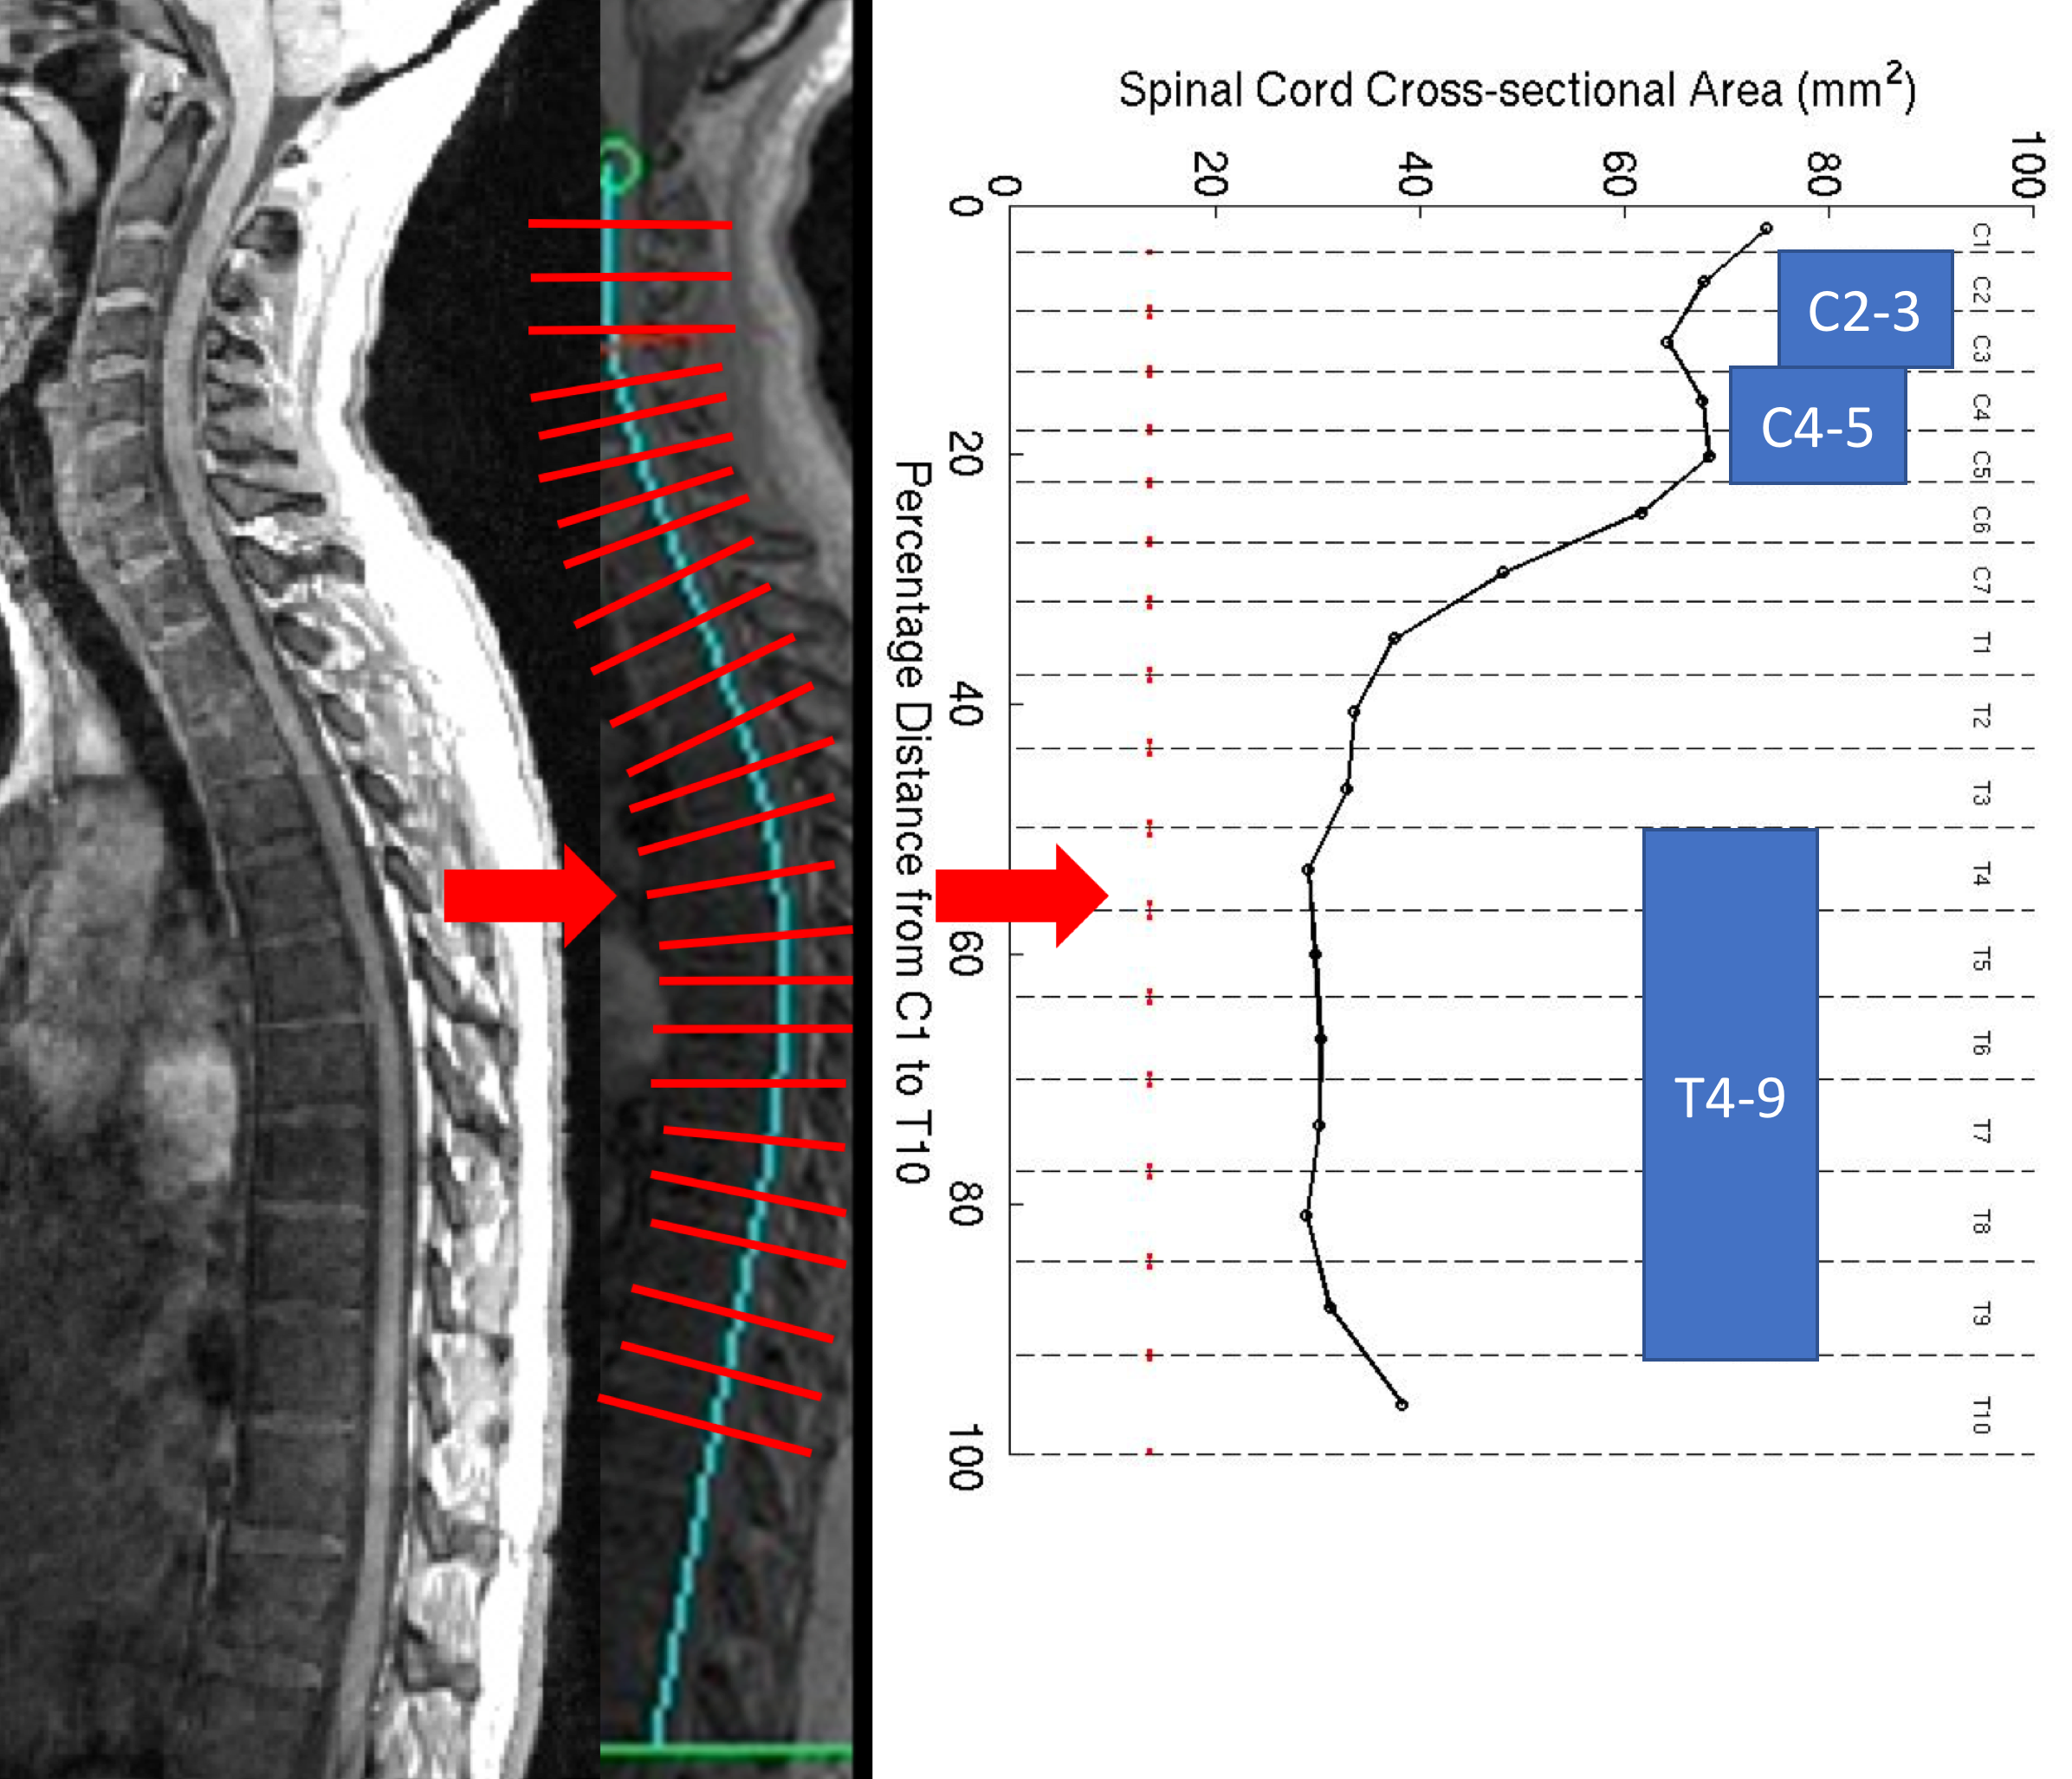
HC and subjects clinically diagnosed with MS (by the 2010 McDonald criteria) underwent MRI of the spinal cord (3T Siemens Skyra with spine matrix coil) which included a 3D GRE sequence at 1mm isotropic resolution of the cervical (C)- and thoracic (T)-spine (TR=8ms, TE=3ms, FA=18°). The C- and T-spine images were stitched together using DICOM information, and SCCSA from C1-T10 levels were derived using a semi-automatic method in Matlab® as previously described4,5 (Figure 1). The group-averaged SCCSA plots and average SCCSA from C2-3, C4-5, and T4-10 regions (regional SCCSA) were compared between MS subtypes, and correlated with standard clinical scores such as Expanded Disability Status Scale (EDSS),6 Scripps Neurologic Rating Scale (SNRS)7, time to walk 25-feet (25FtW), and time to complete 9-hole peg test (9HPT), as well as disease duration. MS cohorts were further subdivided based on z-scores of regional SCCSA derived from the HC group (non-atrophic cord: z>=-1.5 and atrophic cord: z<-1.5). Statistical analysis included analysis of variance, Tukey’s multiple comparison, Pearson’s or Spearman's correlations, and analysis of covariance. A p<0.05 was considered to be statistically significant.Results
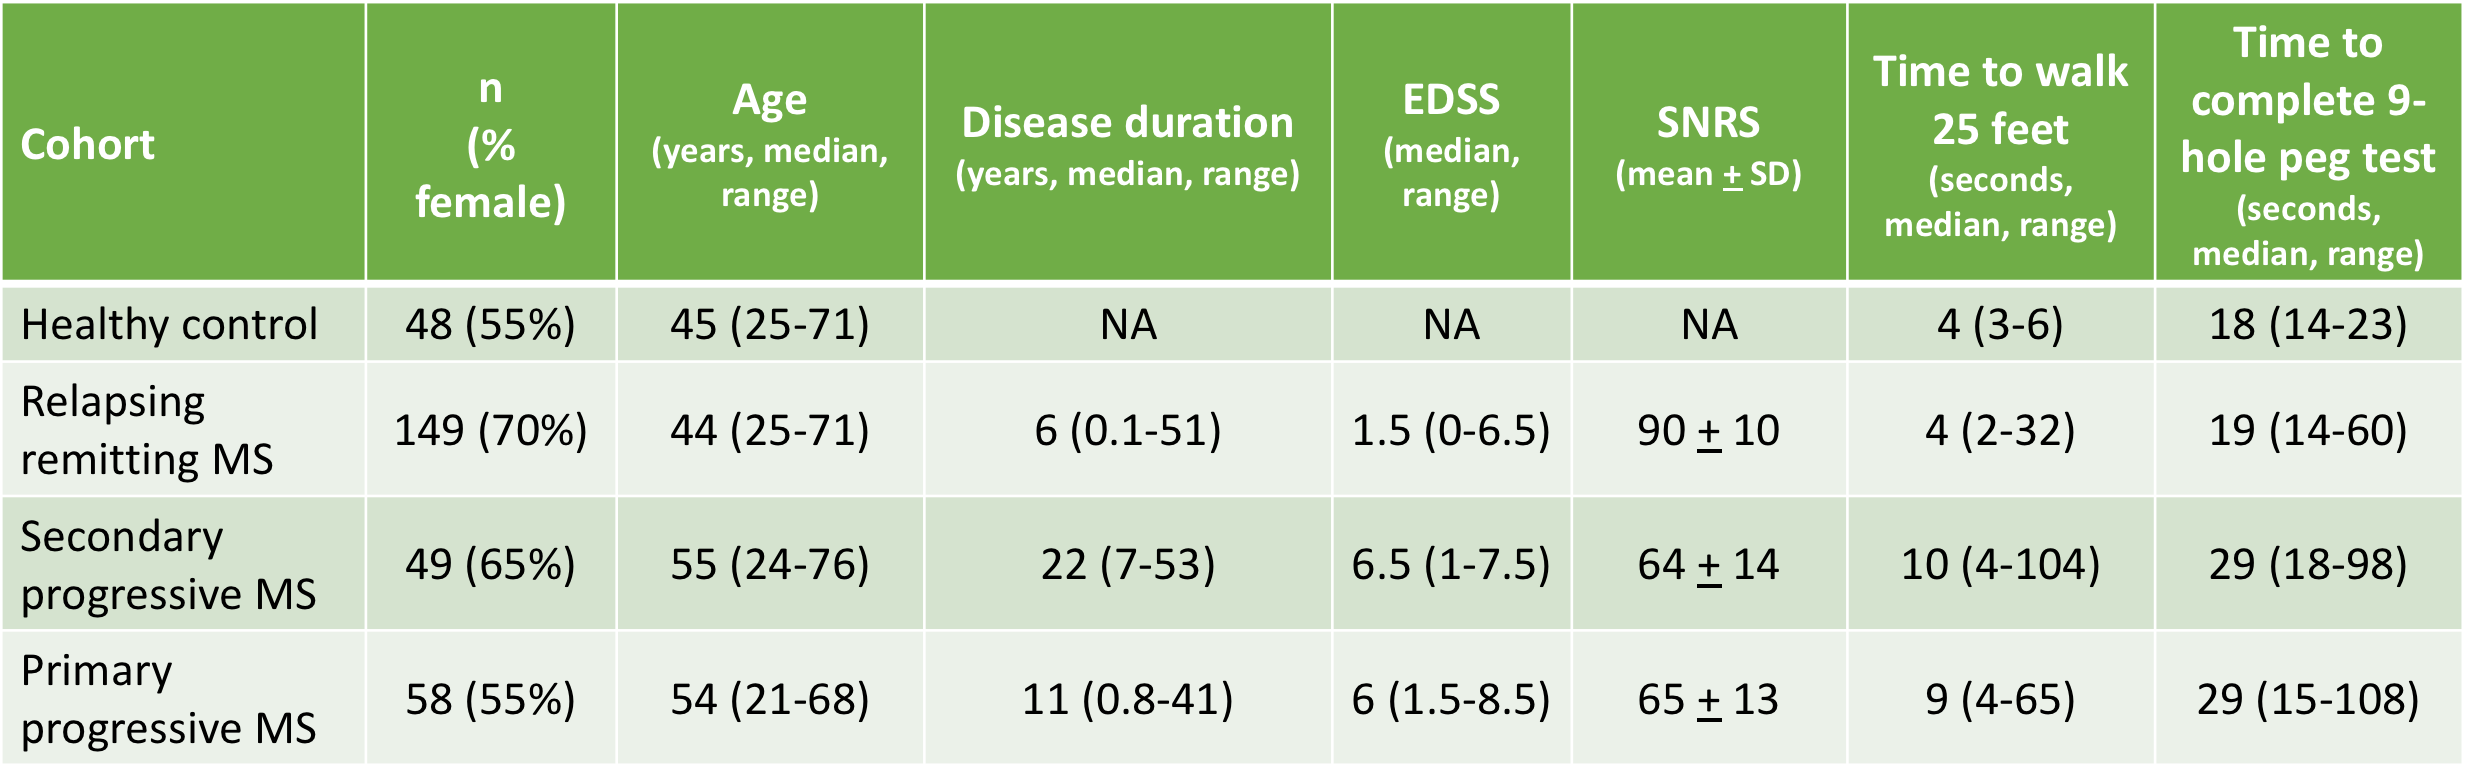
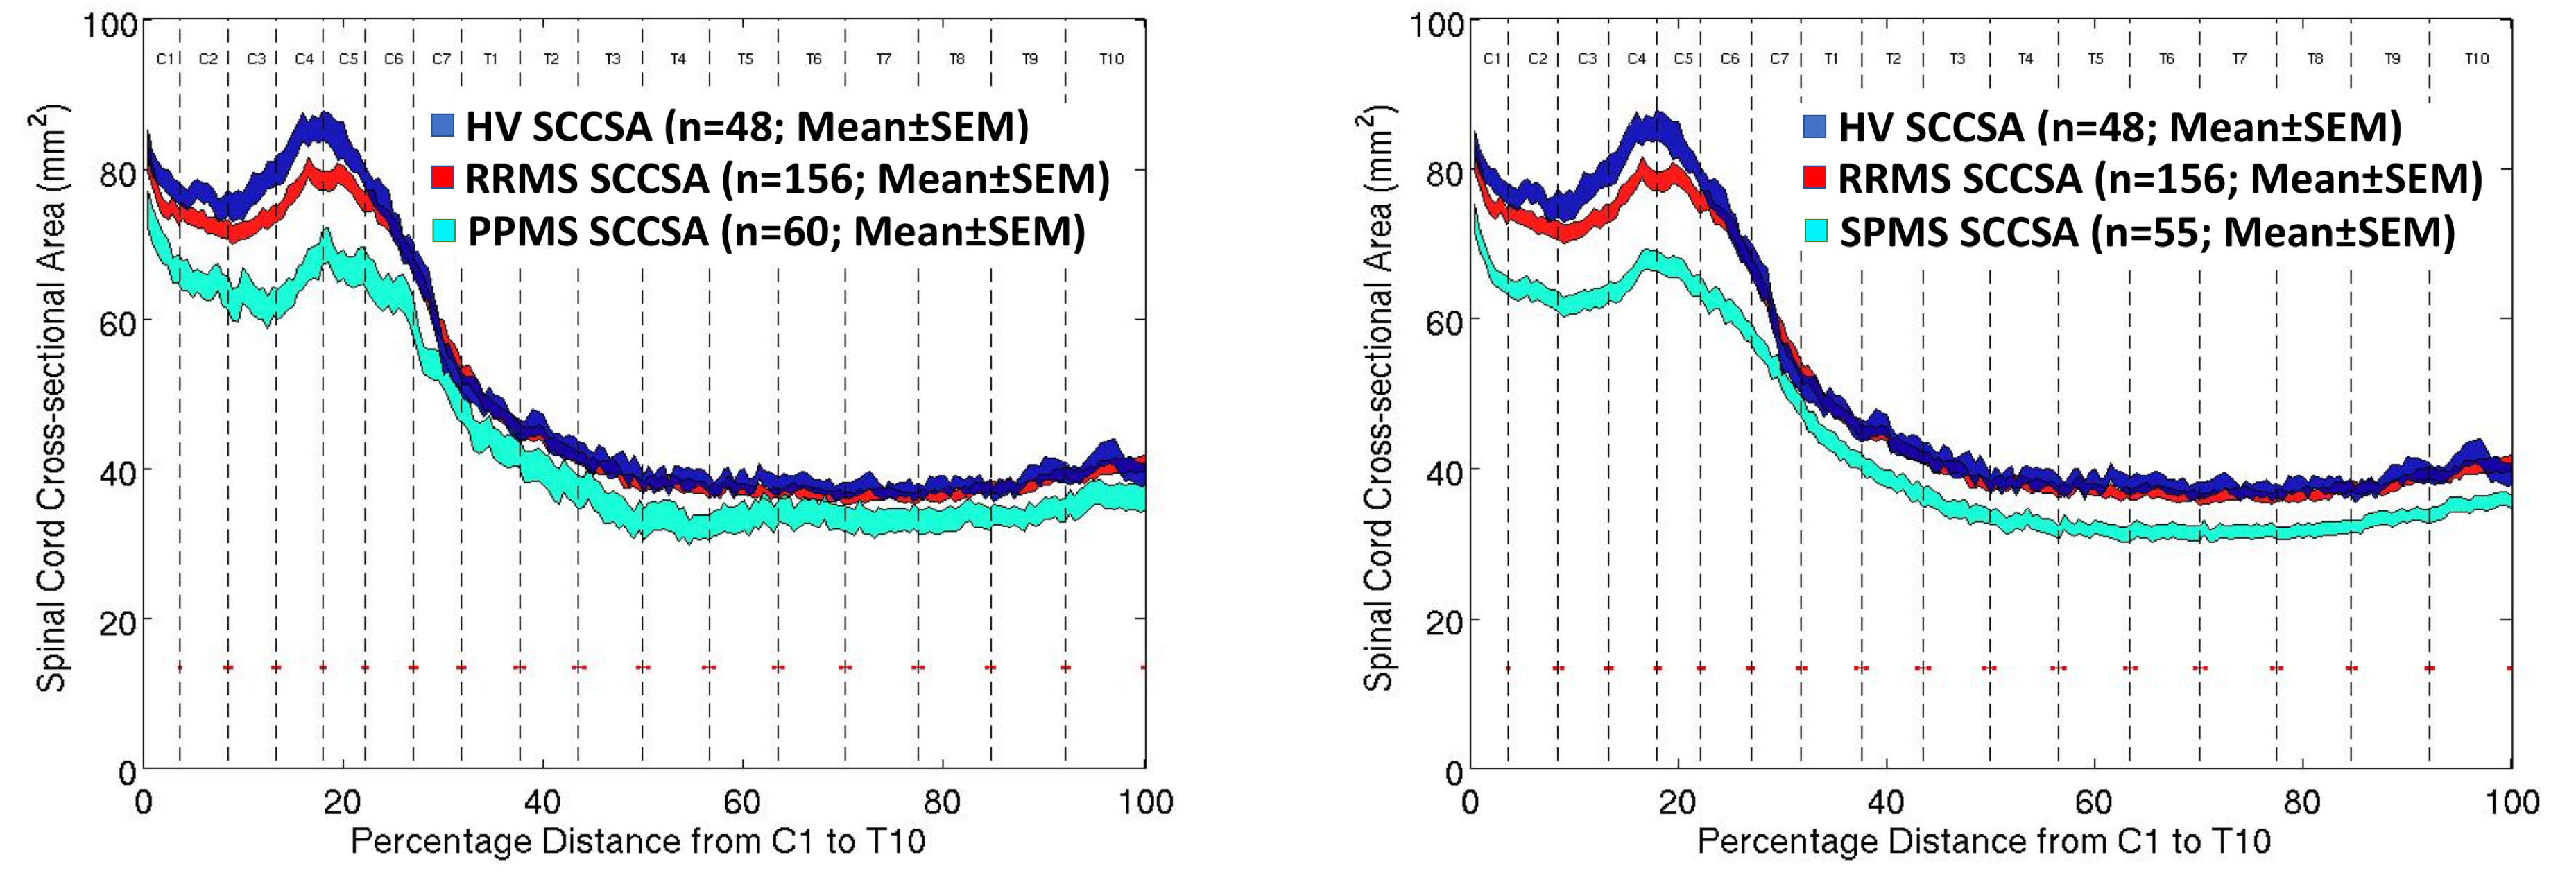
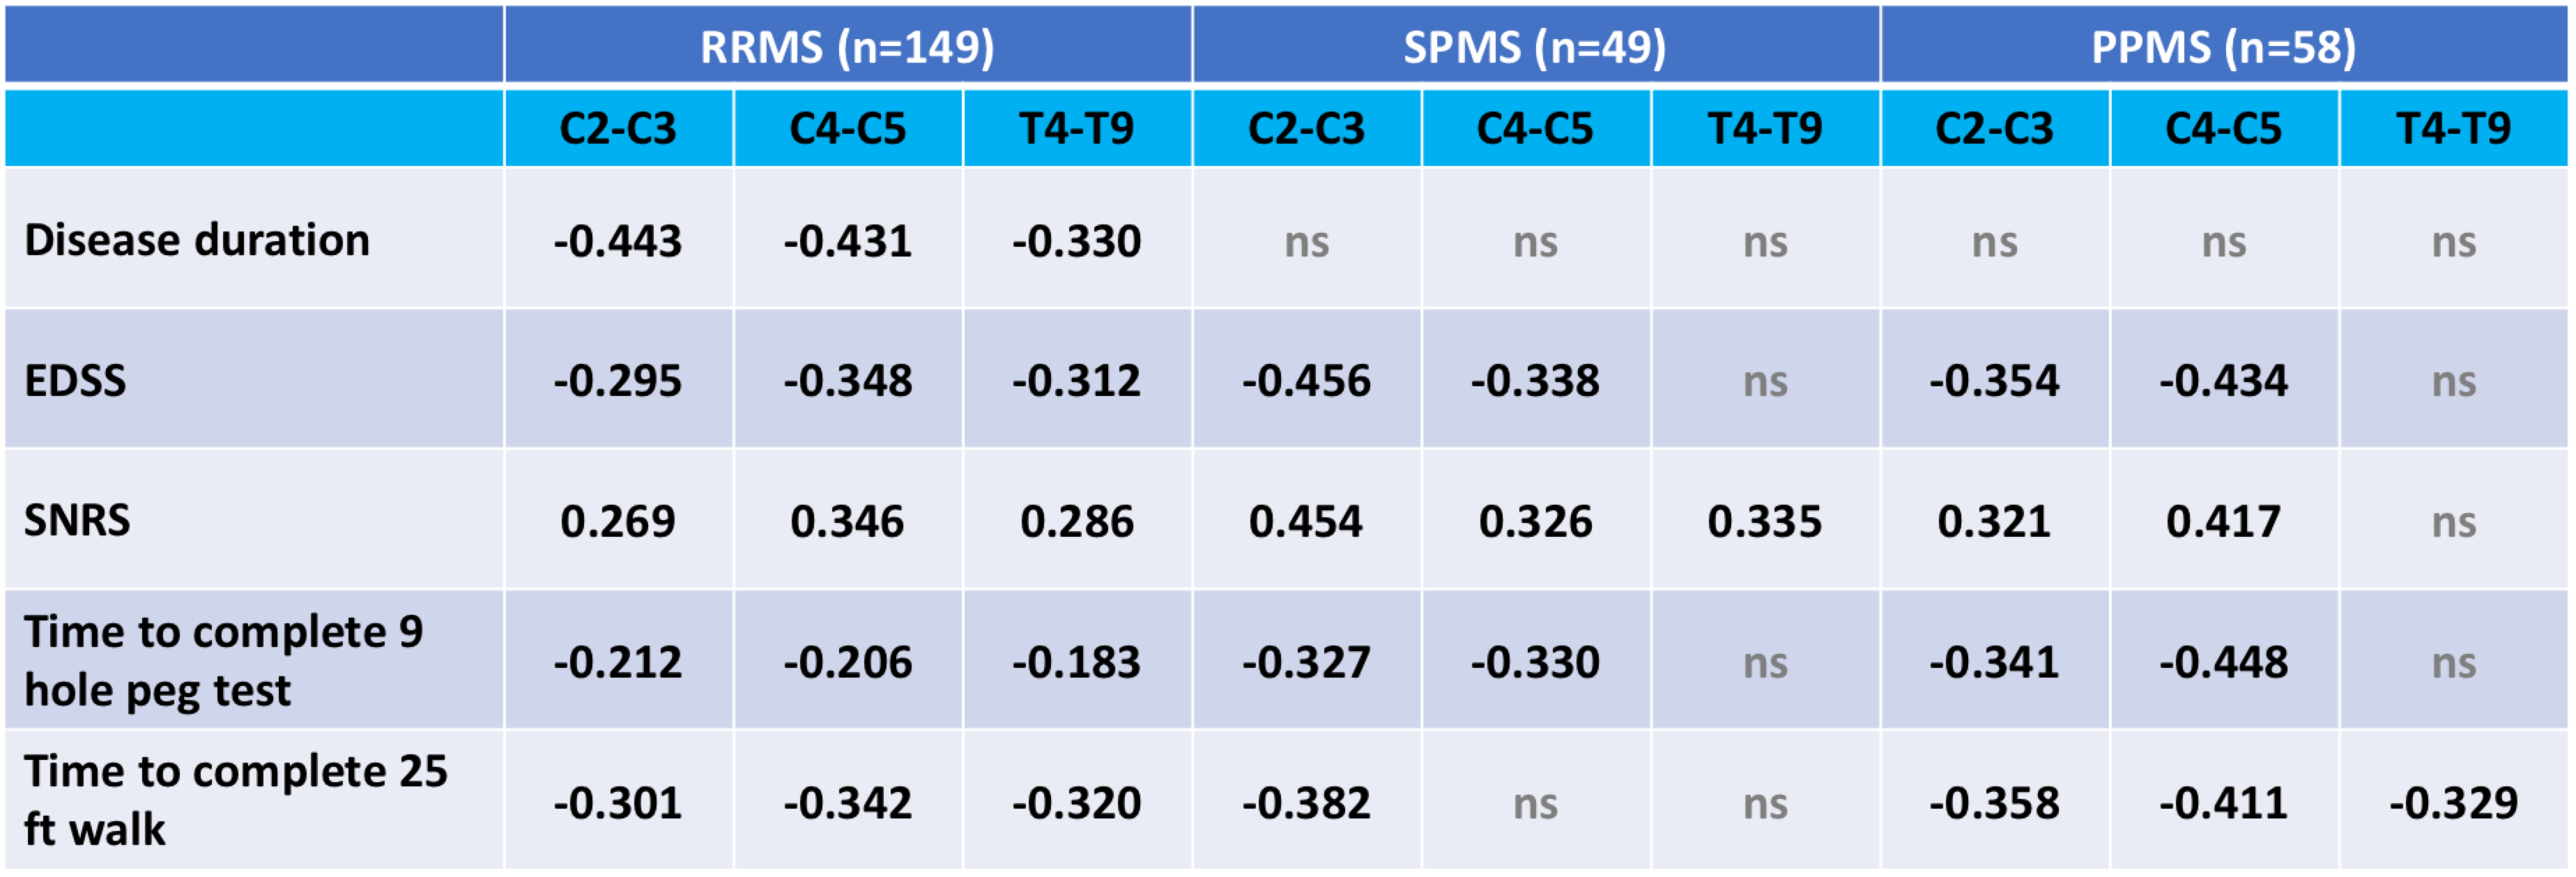
The study included 149 RRMS (age 44 ± 12 years, 70% female), 49 SPMS (age 55 ± 11 years, 65% female), 58 PPMS (age 54 ± 11 years, 55% female), and 48 HC subjects (age 45 ± 14 years, 55% female). Detailed demographic and clinical information for the cohort is shown in Table 1. Compared to HC group, all MS groups had smaller regional SCCSA except RRMS in the T4-10 region (Figure 2). Among the MS cohorts, SPMS and PPMS (progressive forms of MS) had smaller SCCSA in all regions compared to RRMS. Regional SCCSA did not differ significantly among the progressive MS cohorts (Figure 2).SCCSA measures from all regions of the RRMS cohort were significantly correlated to all clinical measures explored herein (|r| between 0.18 and 0.35, Table 2). SCSSA from cervical regions of the progressive MS cohorts were significantly correlated with EDSS, SNRS, 25FtW, and 9HPT (|r| between 0.32 and 0.45) except with SCCSA from C4-5 region and 25FtW in the SPMS cohort. SCCSA from T-regions explained about 10% of the variance in SNRS in SPMS cohorts and in 25FtW in PPMS cohort. Disease duration was significantly correlated with SCCSA only in the RRMS cohort, but this correlation was seen in all C- and T-regions.
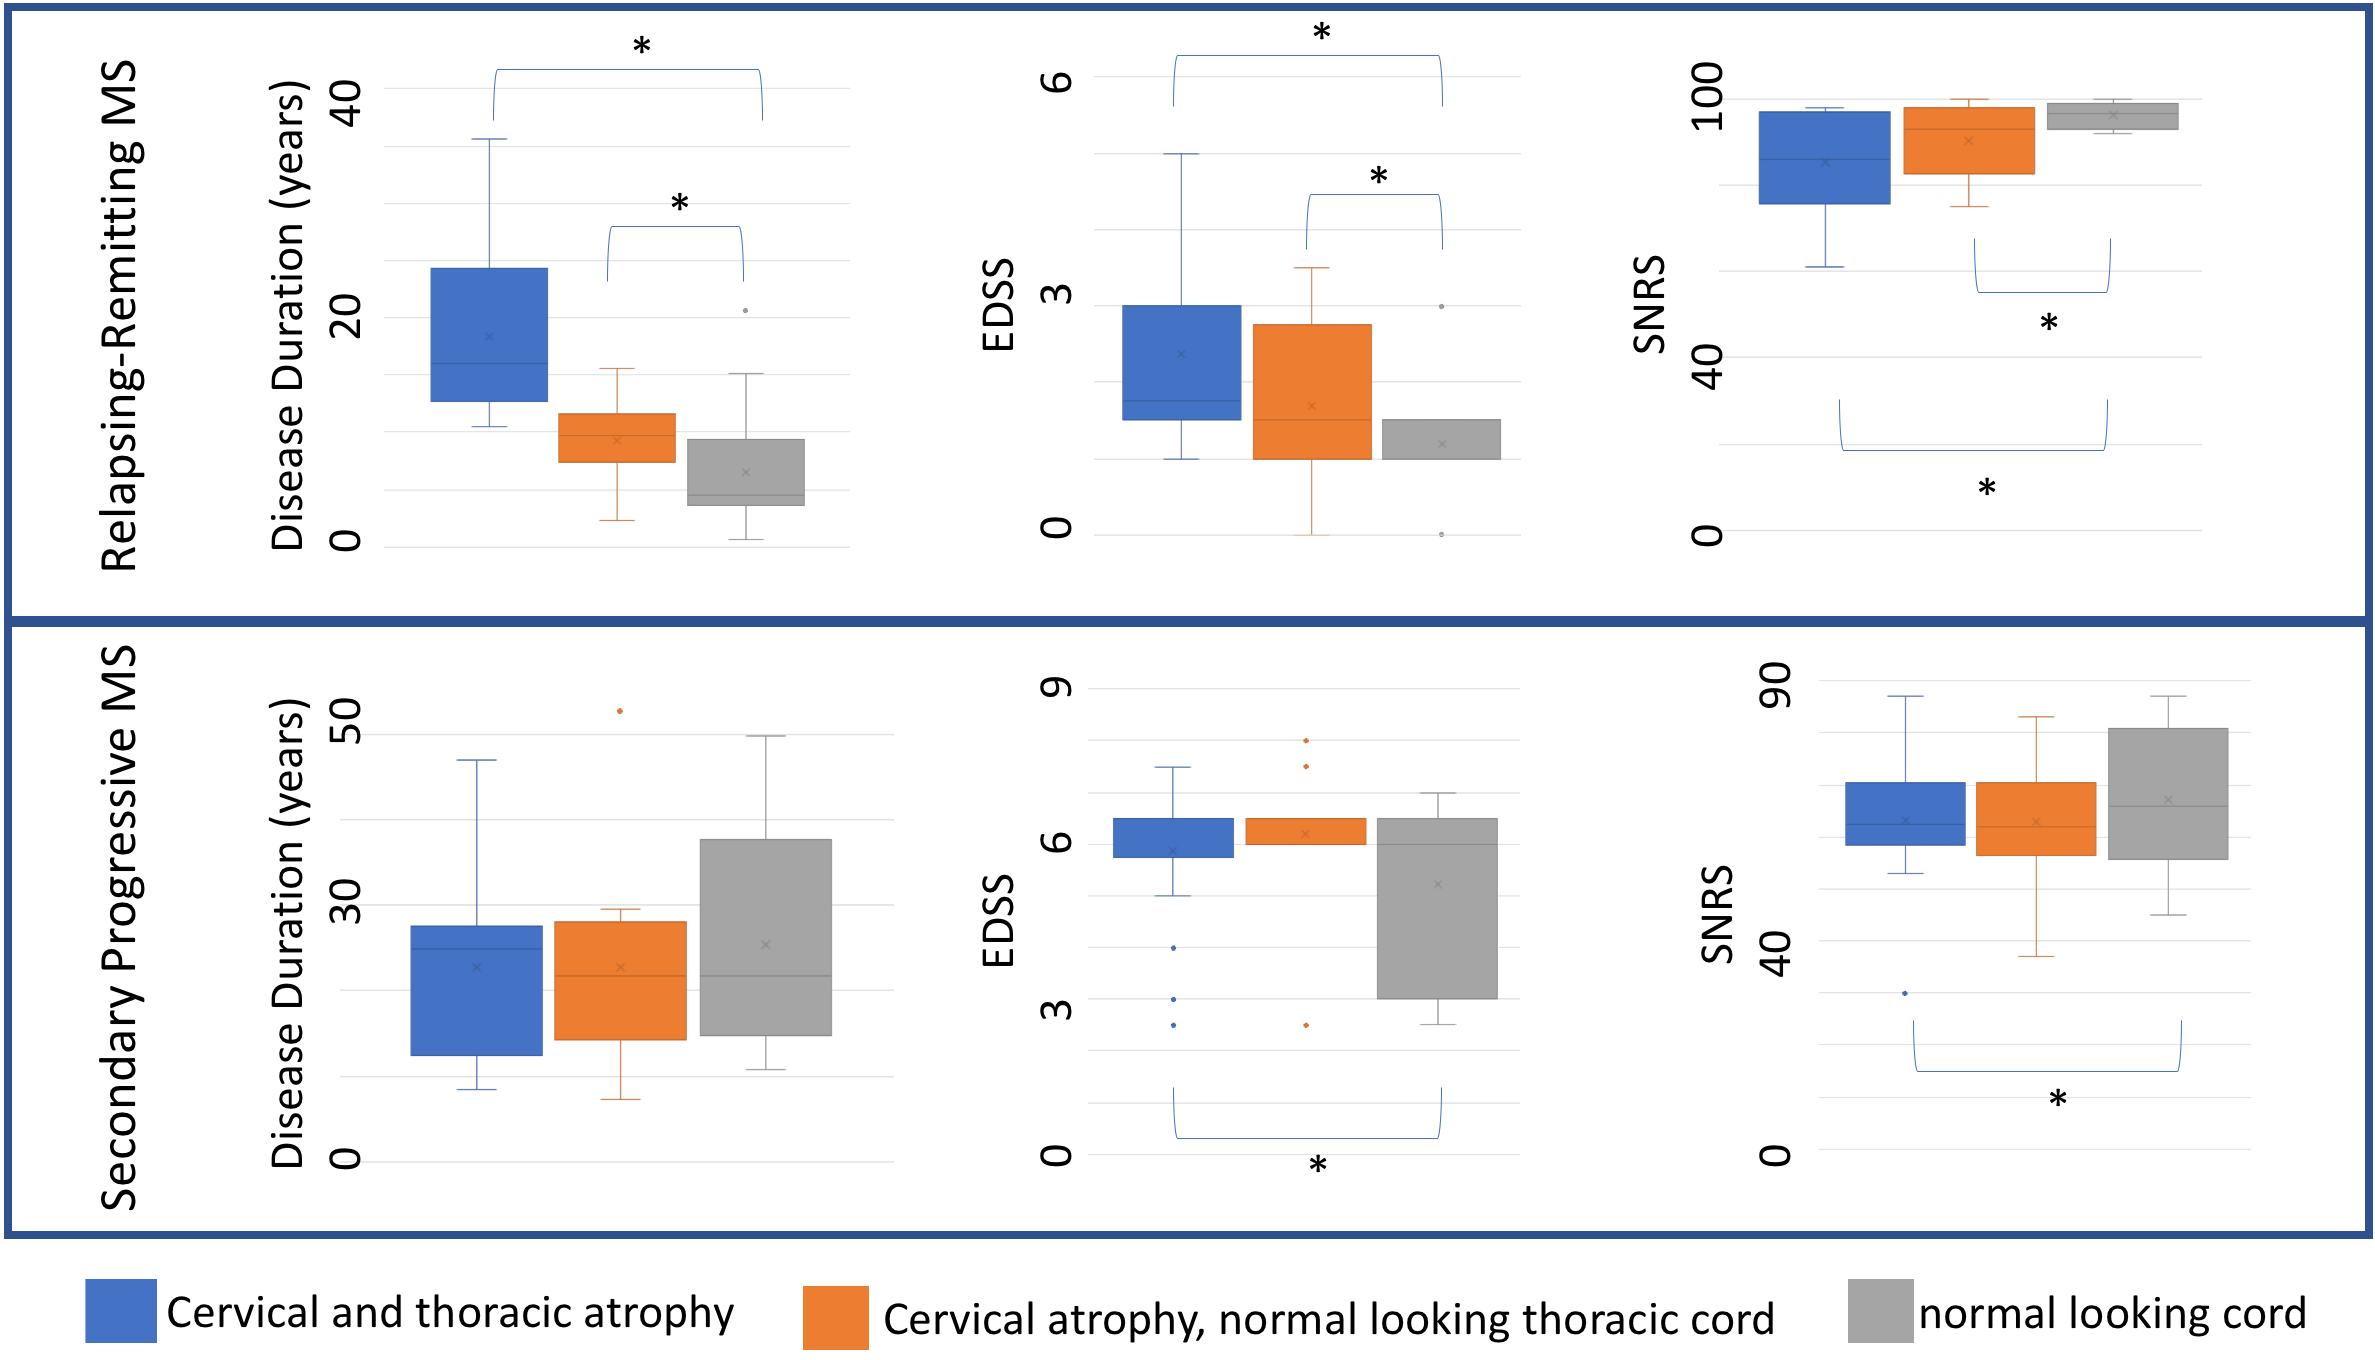
Within the RRMS cohort, C-regions were atrophic in 29 (19%) and T-region was atrophic in 18 subjects (12%), and those with atrophic cord had a significantly higher disease burden and longer disease duration as compared to those having non-atrophic (Figure 3, top row), while these differences were less severe in the SPMS cohort (Figure 3, bottom row). Finally, RRMS subjects with atrophic cord had significantly higher magnitude of correlation with clinical parameters such as SNRS and 9HPT compared to RRMS subjects with non-atrophic cord.
Discussion and Conclusion
SCCSA profile comparisons between HC, RRMS, and SPMS subjects in this cross-sectional study reveals c-spine atrophy early in the disease process, which extends to thoracic regions as disease progresses. Regional SCCSA were correlated with various clinical measures of disability in all MS phenotypes. However, SCCSA measures from RRMS phenotype had the stronger and broader correlations with clinical measures of disability. Subgroup analysis of RRMS cohort based on z-scores revealed that the subset of patients with atrophic-looking cord had a longer disease duration and were more clinically disabled than subjects with non-atrophic cord. The results from this cross-sectional study suggest that cord atrophy starts proximally and early in the disease, extending distally with disease progression. As the disease progresses, this atrophy may decrease, and the correlation with clinical measures drop off suggesting a floor-effect for atrophy. It should be noted that the results could also be biased by the limits of our imaging technique, specifically the resolution, to pick up small volume changes in a thin cord compared to a thick cord. Studying SCCSA patterns, especially in a longitudinal setting, may help in better understanding of the progression in the spinal cord. This study will be expanded to include multivariable analysis, longitudinal observation of SCCSA changes in relation in the context of progressive symptoms, as well as CSF immunological studies.Acknowledgements
Research was funded by the Intramural Research Program at the National Institute of Neurological Disorders and StrokeReferences
1.Losseff, N. A. et al. Spinal cord atrophy and disability in multiple sclerosis. A new reproducible and sensitive MRI method with potential to monitor disease progression. Brain 119 ( Pt 3), 701-708, doi:10.1093/brain/119.3.701 (1996).
2. Bot, J. C. et al. Spinal cord abnormalities in recently diagnosed MS patients: added value of spinal MRI examination. Neurology 62, 226-233, doi:10.1212/wnl.62.2.226 (2004).
3. Valsasina, P. et al. Regional cervical cord atrophy and disability in multiple sclerosis: a voxel-based analysis. Radiology 266, 853-861, doi:10.1148/radiol.12120813 (2013).
4. Liu, W. et al. In vivo imaging of spinal cord atrophy in neuroinflammatory diseases. Ann Neurol 76, 370-378, doi:10.1002/ana.24213 (2014).
5. Azodi, S. et al. Imaging spinal cord atrophy in progressive myelopathies: HTLV-I-associated neurological disease (HAM/TSP) and multiple sclerosis (MS). Ann Neurol 82, 719-728, doi:10.1002/ana.25072 (2017).
6. Kurtzke, J. F. Rating neurologic impairment in multiple sclerosis: an expanded disability status scale (EDSS). Neurology 33, 1444-1452, doi:10.1212/wnl.33.11.1444 (1983).
7. Sipe, J. C. et al. A neurologic rating scale (NRS) for use in multiple sclerosis. Neurology 34, 1368-1372, doi:10.1212/wnl.34.10.1368 (1984).
Figures