0041
Breaking the clinico-radiological paradox in multiple sclerosis using machine learning1Grenoble alpes university, Grenoble, France, 2Sydney Imaging Lab, Sydney university, Sydney, Australia, 3Univ. Grenoble Alpes, Inserm, U1216, Grenoble Institute Neurosciences, Grenoble, France, 4Pixyl Medical, Grenoble, France, 5Lille Catholic University, Lille, France, 6Laboratoire d'informatique de Grenoble, Grenoble, France, 7Claude Bernard Lyon 1 University, Lyon, France, 8Lyon University Hospital, Lyon, France, 9Observatoire Français de la Sclérose en Plaques, INSERM 1028 et CNRS UMR 5292, Lyon, France, 10EUGENE DEVIC EDMUS Foundation against multiple sclerosis, Lyon, France, 11CREATIS, CNRS UMR 5220 - INSERM U1206, Lyon, France
Synopsis
MRI is central to the study of white matter lesions in multiple sclerosis (MS). To date, the distribution of MS lesions, as evaluated on FLAIR imaging, has not been linked to patients’ disability prediction. Based on an international data challenge with 1500 MS patients and ground truth 2-year Expanded Disability Status Scale (EDSS), we have proposed an adaptive machine learning framework to predict the clinical disability. Here, we report the encouraging finding that our algorithm predicts the 2-year EDSS score with an accuracy estimated to 81%, only based on a single initial FLAIR sequence, added to sex and gender information.
INTRODUCTION
MS is the leading cause of non-traumatic disability among young people, especially women. Life expectancy is 6 years less than the French average. MRI is the modality of choice to explore MS patients in the clinical routine, based on its ability to show white matter lesions using FLAIR sequences. Unfortunately, the clinical course of MS based on the load of FLAIR lesions is known to be unpredictable, which has led to the concept of “clinico-radiological paradox”.It is not clear whether this paradox relies on a lack of information, for example regarding the gray matter MS injuries, or due to the absence of appropriate tools to analyze the white matter spatial distribution of MS lesions. Interestingly, WM lesion evolution is a good predictor of treatment efficiency in therapeutic trials. Predicting clinical disability from FLAIR imaging is a real challenge, particularly without longitudinal data and using various MR scanners for the images acquisition. Our team of radiologists and neuroimaging data scientists have participated in the “French days of radiology” 2019 Challenge, where the goal was to predict the Expanded Disability Status Scale (EDSS) at two years of 500 MS patients based on their age, gender and FLAIR MRI, using a training dataset of 1000 MS patients.
METHODS
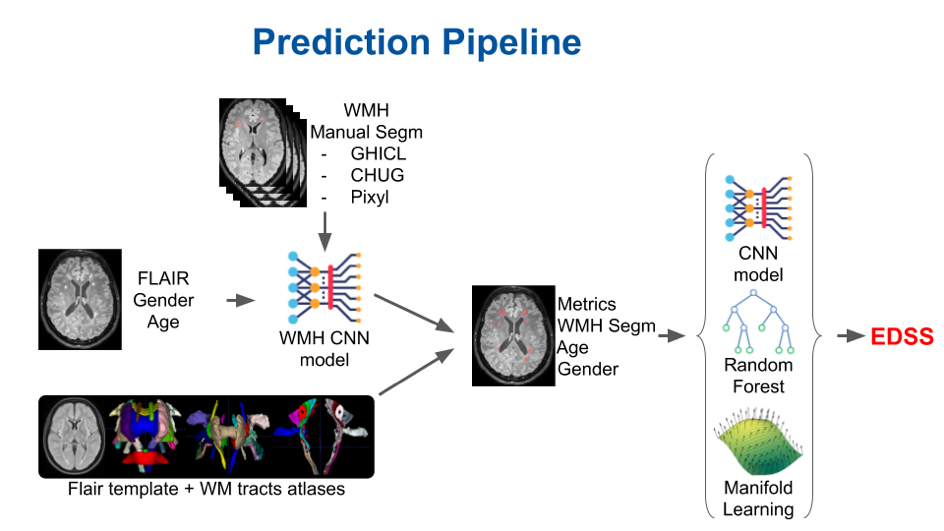
Data confidentiality and safety are ensured according to the recommendations of the French Commission Nationale Informatique et Libertés. Our population is part of the OFSEP (Observatoire de la Sclérose en Plaques) cohort. OFSEP has received approval for storing clinical, biological, and imaging data for research purpose [1]. Patients give informed consent for their data to be stored in the database and used for research, in France and abroad.The cohort has been registered to clinicaltrials.gov under the number NCT02889965. FLAIR images are first corrected for inhomogeneities using the N4 algorithm [2], and coregistered to a common home-made FLAIR template in the Montreal Neurological Institute space using the ANTS library [3]. White Matter Hyperintensities (WMH) are segmented by a convolutional neural network (CNN) based on a multi-level patch-based series of convolutions and max pools in TensorFlow. The CNN is trained on hundreds of FLAIR images from multiple MRI manufacturers, labeled by experts, augmented using noise, inhomogeneities and geometric deformations. Then, using the patient to template coregistration, the average lesion load per fiber tract was computer using the John Hopkins University labels and the sensorimotor atlases of main brain white matter tracts [4, 5].
Finally, our prediction model relies on the aggregation of different complementary predictors: A CNN trained on FLAIR images and MS lesion segmentation, Manifold Learning and Random Forests (https://scikit-learn.org) on whole brain lesion volume, lateral ventricle volume and the lesion load of the 130 white matter tracts. By coupling anatomical knowledge and manual segmentation of FLAIR MS lesions by radiologists, with machine learning methods, the neuroimaging data scientists trained the models on 90% of the training dataset and performed the validation on the 10% remaining subjects.
RESULTS
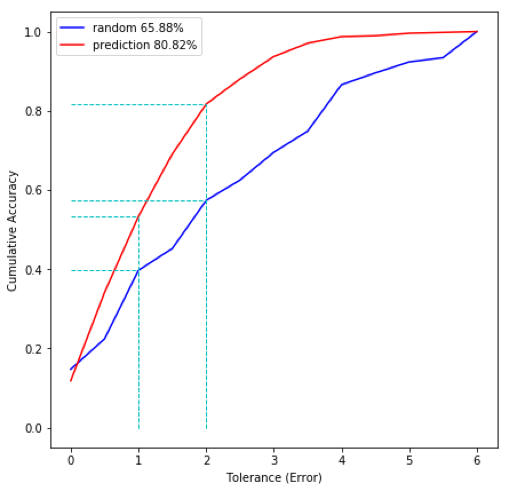
We have achieved a Mean Square Error of MSE=2.2 on the validation dataset. During the challenge on 500 additional subjects, we obtained an MSE=3 and scored first. A MSE equal to 3 corresponds to a mean EDSS error estimated as being 1.8. For comparison purpose, the EDSS random (picked up from the training dataset) MSE was estimated as being 17.20.The regression error characteristic (REC) curve gave a surface prediction of 81%, while the surface random prediction was of 66%.The low EDSS values were better predicted using manifold learning-based classification and random forest while the higher EDSS values were optimally estimated using CNN classifiers.
The white matter tracts that were mainly linked to our EDSS estimation were: the corona radiata, the cerebellar peduncle, the thalamic radiation, the sagittal striatum, the external capsule, the uncinate fasciculus, and the corticospinal tract.
DISCUSSION
We have demonstrated that an association of 3 different supervised and unsupervised machine learning methods were both efficient on a broad range of MRI scanners, including 2D and 3D-FLAIR sequences, and on relatively small subsets of patients in dedicated EDSS ranking score.Indeed, the association of the 3 different algorithms, ie. random forests, CNN and manifold learning analysis, has allowed to predict the clinical disability even when CNN classification algorithm failed to do so due to data sparsity in low EDSS scores.
In 2011, France launched a “big epidemiological and research tool” for MS by granting the OFSEP cohort. This national registry combines not only clinical data but also standardized MRI and biological samples. Currently, OFSEP includes over 68,000 records, more than 50% of the French cases identified in the national insurance database [1].
While not perfect, our algorithm had the ability to predict two-year clinical disability with a mean EDSS error of 1.7, only based on a unique FLAIR sequence, added to basic clinical information such as age and gender. The EDSS score is the most widely used measure of disability in MS and includes eight functional system clinical evaluation and has been accepted by the health authorities as a robust marker of treatment efficiency.
CONCLUSION
The “clinico-radiological paradox” between patient disability and multiple sclerosis lesions was dependent on human analyze limitation, rather than lack of imaging information.Acknowledgements
This work has been supported by a grant provided by the French State and handled by the "Agence Nationale de la Recherche," within the framework of the "Investments for the Future" program, under the reference ANR-10-COHO-002.References
1. Vukusic S, Casey R, Rollot F, et al (2018) Observatoire Français de la Sclérose en Plaques (OFSEP): A unique multimodal nationwide MS registry in France. Mult Scler Houndmills Basingstoke Engl 1352458518815602. https://doi.org/10.1177/1352458518815602
2. Tustison NJ, Avants BB, Cook PA, et al (2010) N4ITK: improved N3 bias correction. IEEE Trans Med Imaging 29:1310–1320. https://doi.org/10.1109/TMI.2010.2046908
3. Avants BB, Tustison NJ, Song G, et al (2011) A reproducible evaluation of ANTs similarity metric performance in brain image registration. NeuroImage 54:2033–2044. https://doi.org/10.1016/j.neuroimage.2010.09.025
4. Wakana S, Caprihan A, Panzenboeck MM, et al (2007) Reproducibility of quantitative tractography methods applied to cerebral white matter. NeuroImage 36:630–644. https://doi.org/10.1016/j.neuroimage.2007.02.049
5. Hua K, Zhang J, Wakana S, et al (2008) Tract probability maps in stereotaxic spaces: analyses of white matter anatomy and tract-specific quantification. NeuroImage 39:336–347. https://doi.org/10.1016/j.neuroimage.2007.07.053
Figures