0040
Diffusion Histology Imaging Classifies Lesions in Multiple Sclerosis1Radiology, Washington University School of Medicine, Saint Louis, MO, United States, 2Biomedical Engineering, Washington University, Saint Louis, MO, United States, 3Keck School of Medicine, The University of Southern California, Los Angeles, CA, United States, 4Neurology, Washington University School of Medicine, Saint Louis, MO, United States
Synopsis
MS lesions have heterogeneous pathology, including inflammation, demyelination, axonal injury, and neuronal loss. Our laboratory has developed a diffusion basis spectrum imaging (DBSI) technique to address the shortcomings of MRI-based MS. Primary DBSI metrics have been demonstrated to be associated with MS pathologies in animal models and human tissue. We propose that profiles of multiple DBSI metrics can identify important patterns within MS lesions and normal appearing white matter. Here we report that Diffusion Histology Imaging (DHI), an improved approach that combines a deep neural network (DNN) algorithm with DBSI-derived diffusion metrics, accurately detected and classified various MS lesion subtypes.
Introduction
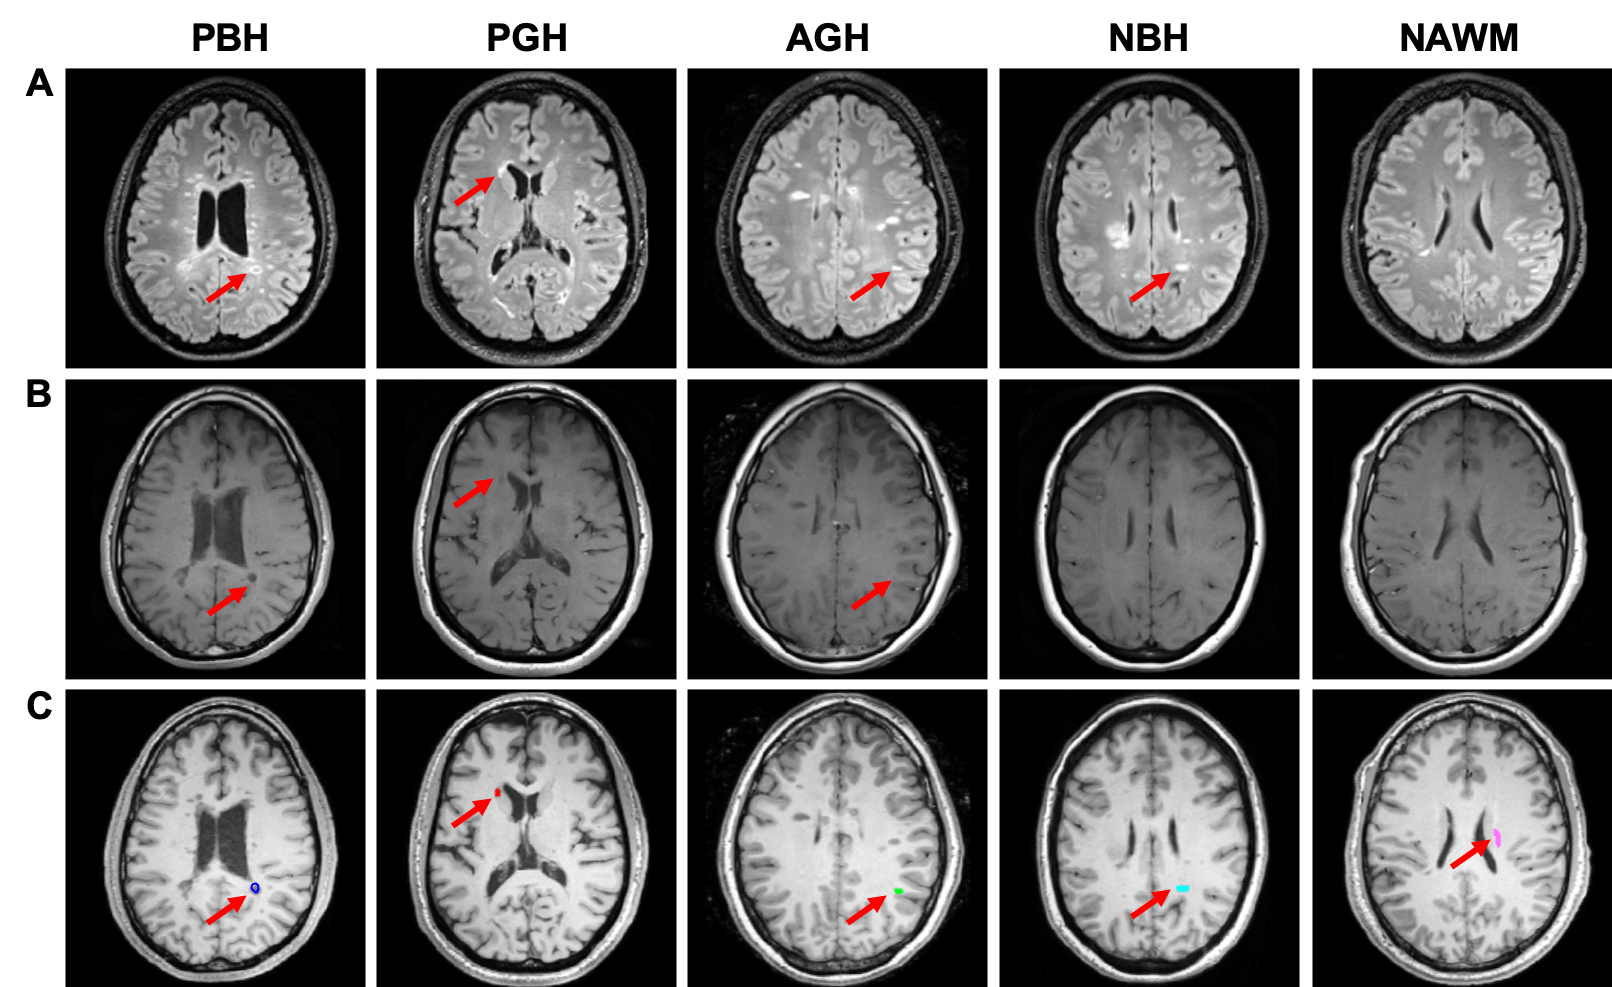
Multiple sclerosis (MS) is an inflammatory demyelinating central nervous system (CNS) disorder that affects over 600,000 people in the US.1 Conventional MRI (cMRI) is often used to characterize and quantify MS lesions in the CNS,2 where the lesions and their subtypes are identified and classified based on image intensity using different MR sequences.3 Hypointense areas of white matter (WM) on T1-weighted imaging (T1WI) are commonly known as “black holes” (BHs) and “gray holes” (GHs), depending upon the level of hypointensity. BHs and GHs persisting for at least 12 months are markers of focal tissue injury in MS and are known as “persistent black holes” (PBHs) and “persistent gray holes” (PGHs).4 PBH are considered to contain more severe axonal loss compared with other MS lesion subtypes. The BH and GH that have persisted for less than 12 months are markers for inflammation and are known as “acute black holes” (ABH) and “acute gray holes” (AGH). Other T2-weighted imaging (T2WI) hyperintense non-black/gray-hole lesions were defined as non-black hole (NBH) T2W lesions. While standard cMRI is sensitive in detecting these MS lesions, it requires clinical experience to categorize the lesion subtype, in addition to longitudinal follow-up.5Our laboratory previously developed diffusion basis spectrum imaging (DBSI),6, 7 and demonstrated its ability to quantitatively characterize various pathologies that underlie MRI lesions.8, 9 We introduced a novel diffusion histology imaging (DHI) approach that combines a deep artificial neural network (DNN) algorithm with improved DBSI analysis. We tested the accuracy of DHI in detecting and classifying various MS lesion subtypes, and compared it to cMRI, DTI and MTR.
Materials and Methods
Thirty-eight people with MS were enrolled after providing written informed consent. Patients were imaged on a 3.0T Siemens Trio scanner. Axial DWI were acquired using a multi-b value scheme (99 directions, maximum b-value 1500 s/mm2): TR=10,000 ms; TE=120 ms; in-plane resolution=2×2×2 mm3; total acquisition time=15 min. Standard T1WI, FLIAR-T2WI and magnetization transfer images (MTR) were also acquired. Total 499 lesions were classified by an experienced neurologist (Fig. 1). DBSI metrics were calculated using an in-house software developed with MATLAB.Total 43,261 imaging voxels from 499 MS lesions were split into training, validation, and testing sets with a ratio of 8:1:1. We compared four different models, including DBSI-DNN (i.e., DHI), DTI-DNN, MTR-DNN and cMRI-DNN (including T1WI and T2WI). DNN models were developed using TensorFlow framework10 in Python. Generally, DNN models were equipped with ten fully connected hidden layers as well as batch normalization and dropout layers for model optimization and regularization. The hyper-parameters of the network architecture and optimization algorithm were chosen through a combination of grid search and manual tuning. Confusion matrices were calculated and used to illustrate the MS lesion classes where DNN prediction contradicts neurologist’s diagnoses. One-versus-rest classification strategy was used to perform ROC and precision-recall analysis on each DNN model for discerning specific lesion/tissue type.
Results
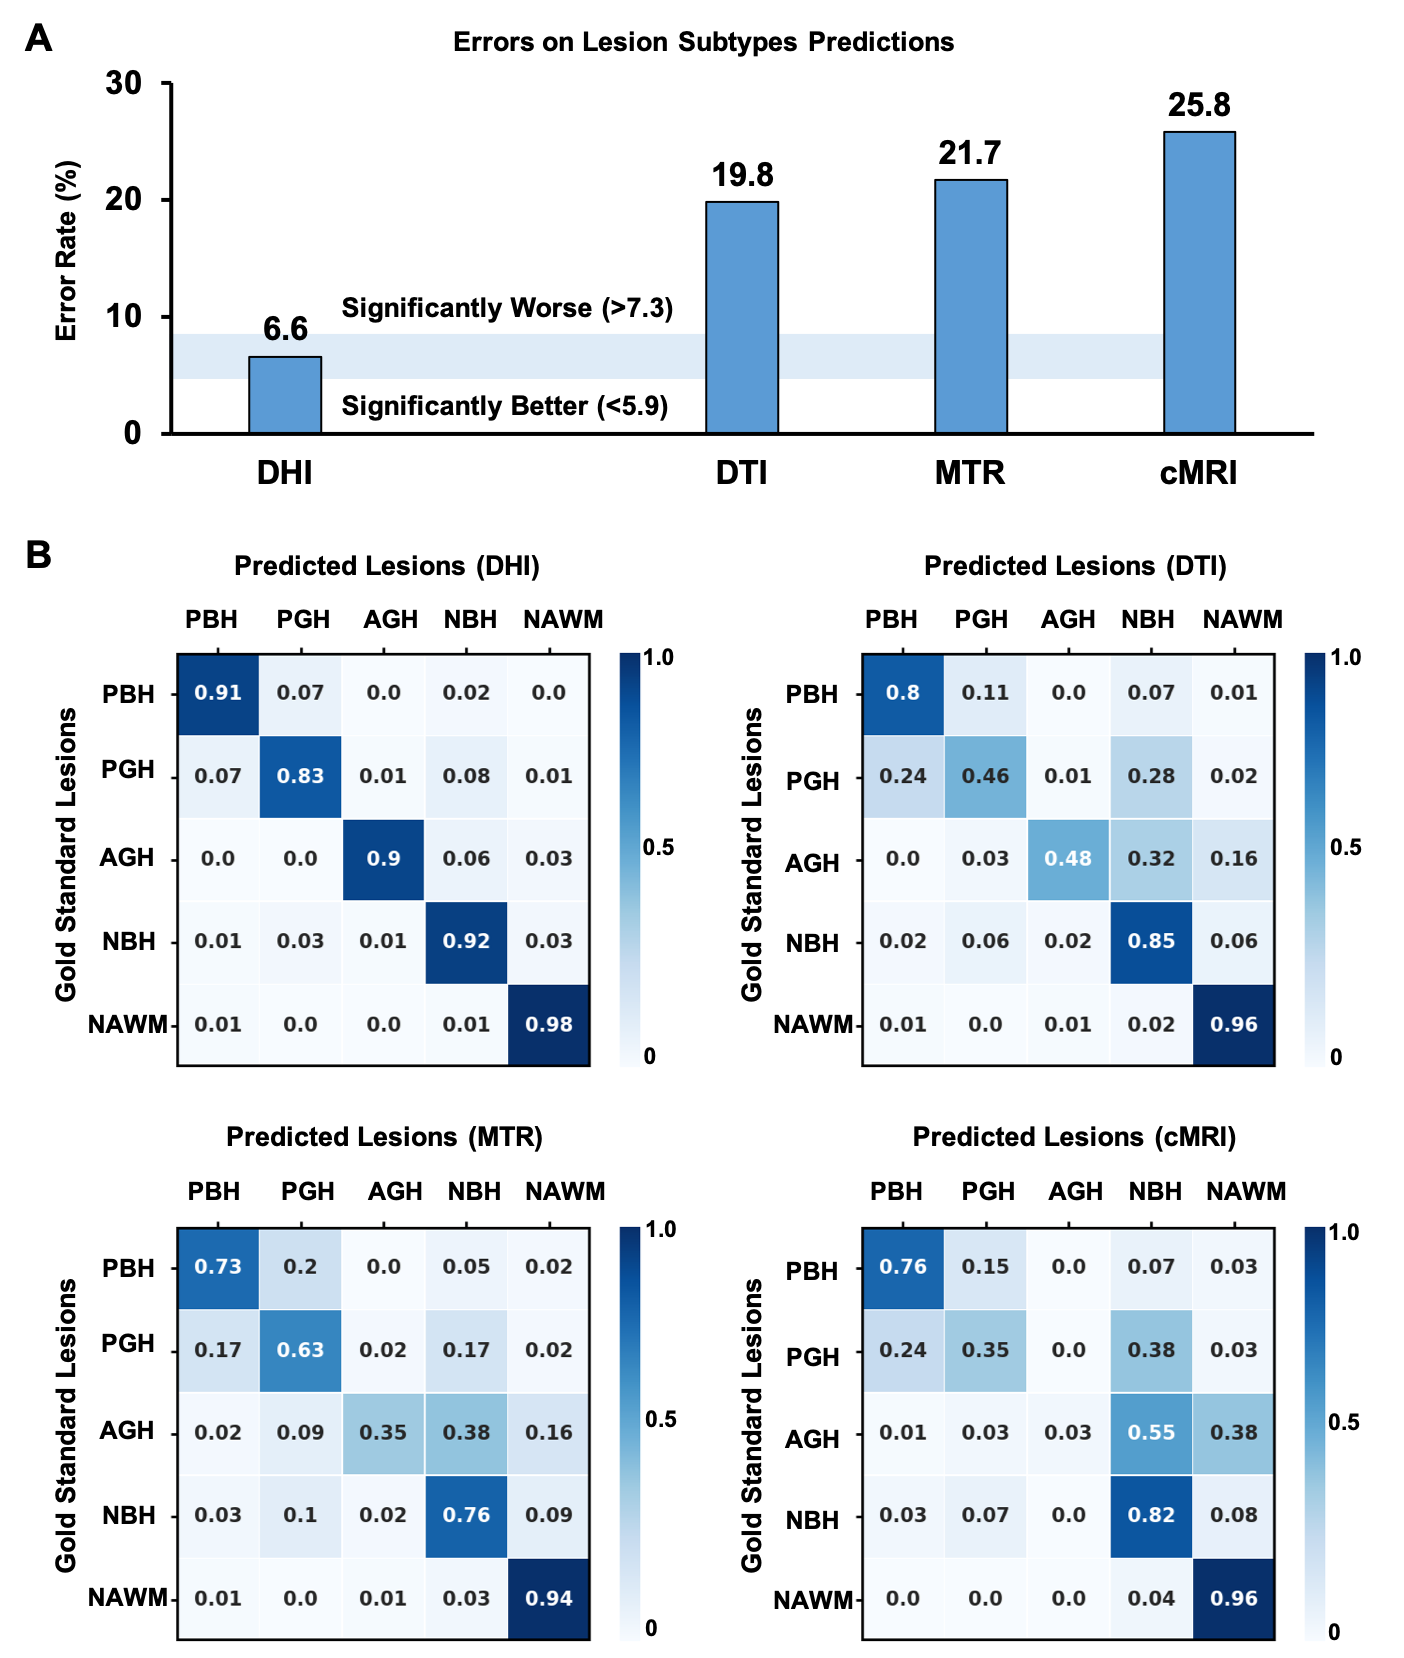
Distribution profiles were created using metrics derived from conventional MRI, DTI, DBSI, and MTR for different MS lesion types (Fig. 2). Overall, the five lesion subtypes showed a similar hierarchical pattern regardless of the imaging metric used. Upon visual examination of the distributions, most of the imaging metrics showed a contain level of distribution differences but no individual metrics was sufficient to discriminate lesions types using regular statistical comparisons. DNN was the better choice to recognize the patterns of such complexity in lesions.For independent test dataset (n=4326), DHI model achieved a great overall concordance with expert neurologist’s determinations of all five lesion subtypes with a total error rate of only 6.6%, which is significantly lower than DTI-DNN (19.8%), MTR-DNN (21.7%) and cMRI-DNN (25.8%) (Fig. 3A). Additionally, DBSI-DNN discriminated PBH, PGH, AGH, T2W, and NAWM with positive prediction rates of 91.3%, 83.4%, 90.1%, 92.3% and 97.9%, respectively, outperforming other three models (Fig. 3B).
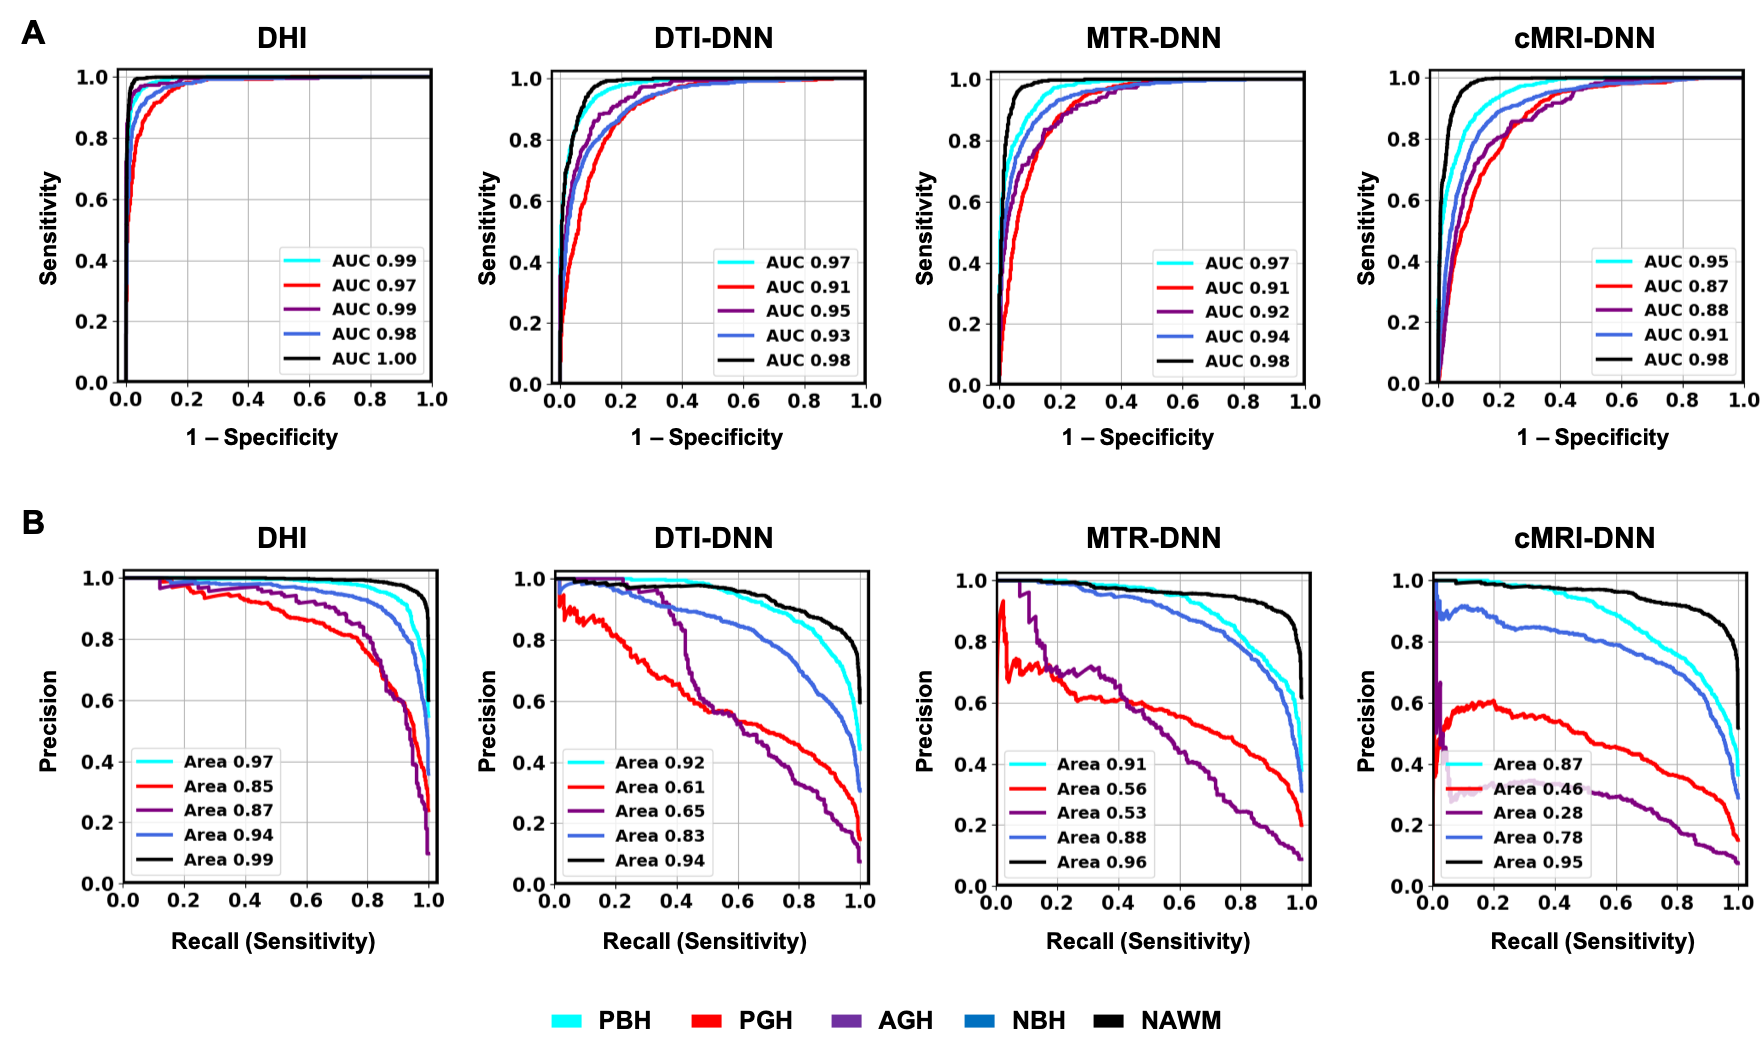
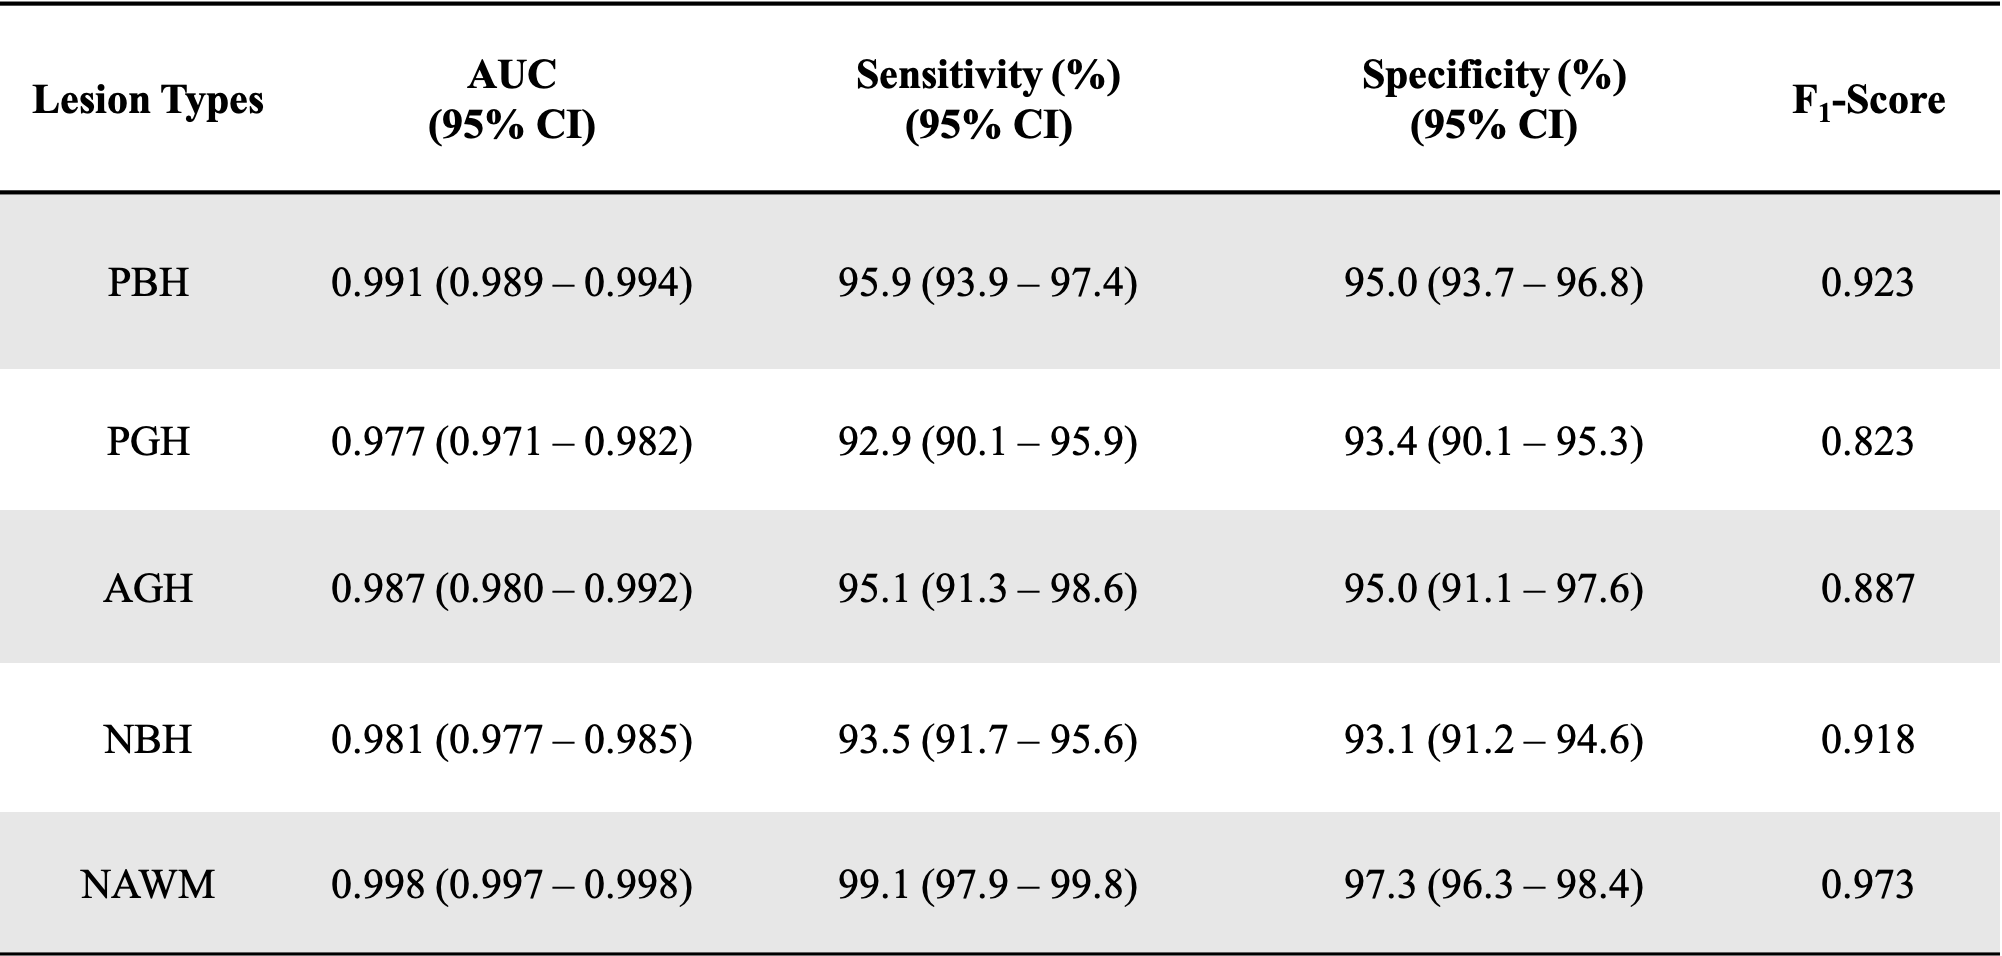
DHI demonstrated best performance on both ROC analyses, with highest ROC-AUC values (Fig. 4A). DTI-DNN, MTR-DNN and cMRI-DNN ROC displayed AUC values higher than 0.860, however, ROC analysis is insensitive to class imbalance, and could overestimate model performance. Precision-recall curves provide complementary information to ROC, but CTI-DNN, MTR-DNN and cMRI-DNN did not perform as well as DBSI-DNN on precision-recall analyses (Fig. 4B). We found that DHI performed best of the 4 models, with PBH F1-score of 0.923, PGH F1-score of 0.823, and AGH F1-score of 0.887 (Table 2).
Discussions and Conclusions
Here we showed that DBSI metrics combined with DNN enabled accurate classification of MS lesions, which is important because different MS lesion subtypes are associated with different clinical outcomes. A quantitative method to distinguish individual MS lesion subtype could improve patient monitoring and potentially be useful as an outcome measure in clinical trials.11 DHI, i.e., DBSI-based DNN model, demonstrates great promise as a marker of lesion severity, in particular in its ability to assess axonal loss. Future additional longitudinal studies with larger cohorts, different scanners, and multiple centers are imperative to explore the possibilities of applying DHI on a broader scope.Acknowledgements
This study was supported by the National Institutes of Health (NIH) P01 NS059560, U01 EY025500, and National Multiple Sclerosis Society (NMSS) RG-1701-26617.References
1. Wallin MT, Culpepper WJ, Campbell JD, et al. The prevalence of MS in the United States A population-based estimate using health claims data. Neurology. 2019 Mar 5;92(10):E1029-E40.
2. Bakshi R, Thompson AJ, Rocca MA, et al. MRI in multiple sclerosis: current status and future prospects. Lancet Neurol. 2008;7(7):615-25.
3. Filippi M, Rocca MA, Ciccarelli O, et al. MRI criteria for the diagnosis of multiple sclerosis: MAGNIMS consensus guidelines. Lancet Neurol. 2016 Mar;15(3):292-303.
4. Riva M, Ikonomidou VN, Ostuni JJ, et al. Tissue-Specific Imaging Is a Robust Methodology to Differentiate In Vivo T1 Black Holes with Advanced Multiple Sclerosis-Induced Damage. Am J Neuroradiol. 2009 Aug;30(7):1394-401.
5. Palace J. MAKING THE DIAGNOSIS OF MULTIPLE SCLEROSIS. Journal of Neurology, Neurosurgery & Psychiatry. 2001;71(suppl 2):ii3-ii8.
6. Cross AH, Song SK. "A new imaging modality to non-invasively assess multiple sclerosis pathology". Journal of neuroimmunology. 2017 Mar 15;304:81-5.
7. Wang Y, Wang Q, Haldar JP, et al. Quantification of increased cellularity during inflammatory demyelination. Brain : a journal of neurology. 2011 Dec;134(Pt 12):3590-601.
8. Shirani A, Sun P, Schmidt RE, et al. Histopathological correlation of diffusion basis spectrum imaging metrics of a biopsy-proven inflammatory demyelinating brain lesion: A brief report. Multiple sclerosis. 2018 Jul 1:1352458518786072.
9. Wang Y, Sun P, Wang Q, et al. Differentiation and quantification of inflammation, demyelination and axon injury or loss in multiple sclerosis. Brain : a journal of neurology. 2015 May;138(Pt 5):1223-38.
10. Mart, #237, Abadi n, et al. TensorFlow: a system for large-scale machine learning. Proceedings of the 12th USENIX conference on Operating Systems Design and Implementation; Savannah, GA, USA. 3026899: USENIX Association; 2016. p. 265-83.
11. van Waesberghe JHTM, Kamphorst W, De Groot CJA, et al. Axonal loss in multiple sclerosis lesions: Magnetic resonance imaging insights into substrates of disability. Ann Neurol. 1999 Nov;46(5):747-54.
Figures