0039
A comparison of phase image and quantitative susceptibility mapping in identifying inflammation in chronic multiple sclerosis lesions
Xianfu Luo1,2, Ulrike W. Kaunzner3, Thanh D. Nguyen1, Yeona Kang4, Elizabeth Sweeney5, Weiyuan Huang1, Yi Wang1, and Susan Gauthier3
1Department of Radiology, Weill Medical College of Cornell University, New York, NY, United States, 2Department of Radiology, Northern Jiangsu People's Hospital, Yangzhou, China, 3Department of Neurology, Weill Medical College of Cornell University, New York, NY, United States, 4Department of Radiology/Nuclear Medicine, Weill Medical College of Cornell University, New York, NY, United States, 5Department of Healthcare Policy and Research, Weill Medical College of Cornell University, New York, NY, United States
1Department of Radiology, Weill Medical College of Cornell University, New York, NY, United States, 2Department of Radiology, Northern Jiangsu People's Hospital, Yangzhou, China, 3Department of Neurology, Weill Medical College of Cornell University, New York, NY, United States, 4Department of Radiology/Nuclear Medicine, Weill Medical College of Cornell University, New York, NY, United States, 5Department of Healthcare Policy and Research, Weill Medical College of Cornell University, New York, NY, United States
Synopsis
Both MR phase imaging and quantitative susceptibility mapping (QSM) are used to assess the presence of chronic active multiple sclerosis lesions. It is important to evaluate which measure can detect ongoing inflammation in chronic active lesions most accurately. This study combined PK11195-PET with QSM versus phase imaging, and demonstrated that QSM can detected higher uptake of PK11195, as compared to phase imaging.
Introduction
Chronic active multiple sclerosis (MS) lesions, a subset of chronic MS lesions, have been shown to contain iron-laden, activated microglia and macrophages on histopathology and have been linked to greater tissue damage. Clinical studies are currently utilizing various gradient echo (GRE) approaches to identify chronic active MS lesions, however it remains unclear which approach most accurately detects lesions with continuous inflammation. Phase imaging provides a tool to qualitatively assess for the presence of iron in various tissue types, and has been used for the detection of chronic active lesions in MS patients1,2. However, because the local phase is affected by magnetic sources in the surrounding tissue, the phase pattern may not represent the true magnetic susceptibility pattern. Quantitative susceptibility mapping (QSM) can be used as post-processing method, applying a magnetic field deconvolution technique to further refine susceptibility imaging3-5. It overcomes problems encountered with other GRE approaches, like the occurrence of blooming artifacts, and provides accurate quantification and localization of the magnetic sources. We previously determined that lesions with a hyperintense rim on QSM demonstrated higher PET-TSPO uptake utilizing PK11195-PET (PK-PET) to demonstrate that QSM can identify chronic lesions with persistent inflammation6. This study utilized PK-PET to evaluate the ability of phase imaging to detect ongoing inflammation in chronic MS lesions as compared to QSM.Materials and methods
Patient SelectionThirty-three patients with MS were enrolled into this cross-sectional, retrospective study. Concomitant MRI and PK-PET imaging were obtained and clinical data were collected, included the following: gender, age, Expanded Disability Status Scale scores (EDSS), disease duration, and treatment duration.
MR Imaging and image Processing
Brain MRIs were performed on 3T MR imaging scanners. The scanning protocol consisted of standard sequences for anatomic structure, multiecho 3D-GRE imaging for QSM. The acquisition parameters for multiecho GRE were the following: FOV 24 cm, TR 49 –58 ms, TE1/TE 4.5– 6.7/4.1– 4.8 ms, last TE 47.7 ms, acquisition matrix 320 – 416× 205–320, readout bandwidth 244 –260 Hz/pixel, axial slice thickness 3 mm, flip angle 15°-20°,acceleration factor 2, number of averages 1. The scan time was around 4 minutes and 30 seconds (48 slices), varying slightly with brain superior-inferior dimensions. QSM was reconstructed from complex GRE images using a fully automated morphology-enabled dipole inversion (MEDI 0) method zero-referenced to the ventricular CSF. All the conventional images and the follow-up QSM images were co-registered to the baseline GRE magnitude images. Lesions were identified and manually traced on T2WI image then overlaid and further adjusted if necessary on QSM image. ITK-SNAP software was used to trace lesion and obtain regional volume and QSM measurements. Based on their appearance relative to the surrounding normal-appearing white matter (NAWM), lesions were classified into three lesion types: QSM isointense (QSM-), QSM hyperintense with rim (QSM rim+) and without (QSM rim-).The susceptibility value of the adjacent NAWM was subtracted from the lesion susceptibility to offset the influence of local fiber orientation. Chronic lesions on phase imaging were divided into lesions with presence of hypointense signal on phase (phase positive), or absence of phase signal.
PET imaging
PET imaging was obtained using a first-generation PET tracer, PK11195, able to detect activated microglia and macrophages. Summed PET images were co-registered to their corresponding MRI scans. The lesion activity was referenced to PK11195 volume of distribution ratio (VTr), defined as the ratio of VT within a specific lesion and was calculated to control for normal physiological variability.
Statistical Analysis
Our primary objective was to assess VTr in phase+/QSM rim+ lesions as compared to phase +/QSM rim- lesions. We used a linear mixed effects model with a fixed effect for lesion type and lesion volume and a random effect for patient to account for the correlation among lesions within a patient with VTr as an outcome
Results
The cohort of 30 patients included 18 women and 12 men, aged 43.8±14.3 years, with disease duration 13.1±11.9 years and EDSS = 2.5±2.3. Twenty-four patients had relapsing remitting MS and six patients had secondary progressive MS. A total of 394 chronic MS lesions were identified based on T2/FLAIR images. A total of 215 (54.5%) lesions demonstrated a hypointense rim or a solid hyperintensity on phase. A total of 253 (64.2%) lesions were hyperintense on QSM and among those lesions, 43 (10.9%) were QSM rim+. All QSM rim+ lesions were phase positive. VTr within phase+/QSM rim+ lesions (1.05 ± 0.02898) was significantly higher compared to phase+/QSM rim- lesions (0.9676 ±0.01573, p=0.001).Discussion and Conclusion
The combination of PK-PET with QSM versus phase demonstrates that QSM rim+ lesions are associated with a higher uptake of PK11195, as compared to phase+/QSM rim- lesions. This indicates that QSM rim+ lesions might detected the subset of chronic active lesions with highest level of inflammation as compared to phase imaging. Phase imaging might detect a broader range of chronic MS lesions, and not exclusively lesions with the most severe inflammation. In conclusion, QSM might be a more sensitive in-vivo tool in the detection of chronic active MS lesions as compared to phase, and might be the most accurate measure in the detection of lesions with most severe inflammation.Acknowledgements
No acknowledgement found.References
1. Bagnato F, Hametner S, Yao B, et al. Tracking iron in multiple sclerosis: a combined imaging and histopathological study at 7 Tesla. Brain 2011;134:3602-15.
2. Absinta M, Sati P, Gaitan MI, Maggi P, Cortese IC, Filippi M, et al. Seven-tesla phase imaging of acute multiple sclerosis lesions: a new window into the inflammatory process. Ann Neurol 2013; 74(5): 669-78
3. Eskreis-Winkler S, Deh K, Gupta A, et al. Multiple sclerosis lesion geometry in quantitative susceptibility mapping (QSM) and phase imaging. J Magn Reson Imaging 2015;42:224-229
4. Chen W, Gauthier SA, Gupta A, et al. Quantitative susceptibility mapping of multiple sclerosis
lesions at various ages. Radiology 2014;271:183-92.
5. Wisnieff C, Ramanan S, Olesik J, Gauthier S, Wang Y, Pitt D. Quantitative susceptibility mapping (QSM) of white matter multiple sclerosis lesions: Interpreting positive susceptibility and the presence of iron. Magnetic resonance in medicine 2015;74:564-70.
6. Kaunzner UW, Kang Y, Zhang S,et al. Quantitative susceptibility mapping identifies inflammation in a subset of chronic multiple sclerosis lesions. Brain. 2019 Jan 1;142(1):133-145.
Figures
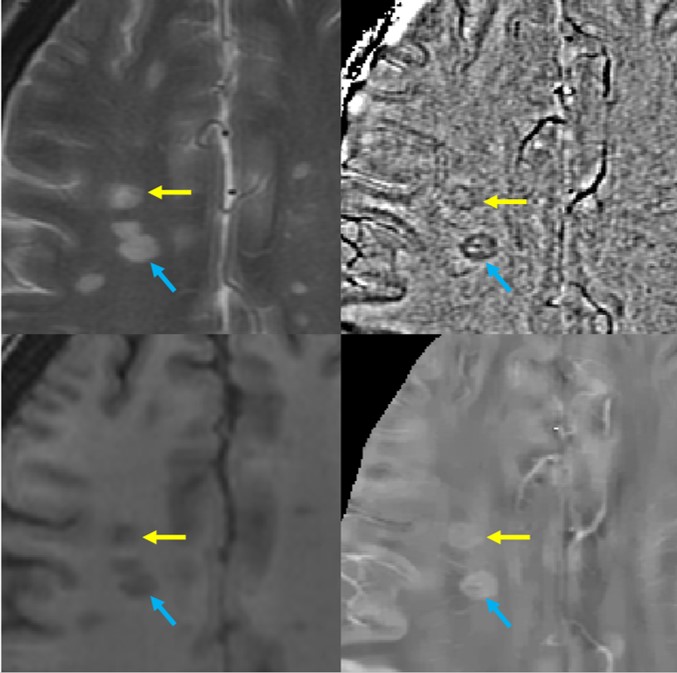
Figure 1. An example of a 43-year-old RRMS patient with two lesions located at the right semi-oval center that have rim appearance on both phase and QSM images. The VTr of lesions was similar, 1.02 and 0.99, respectively.
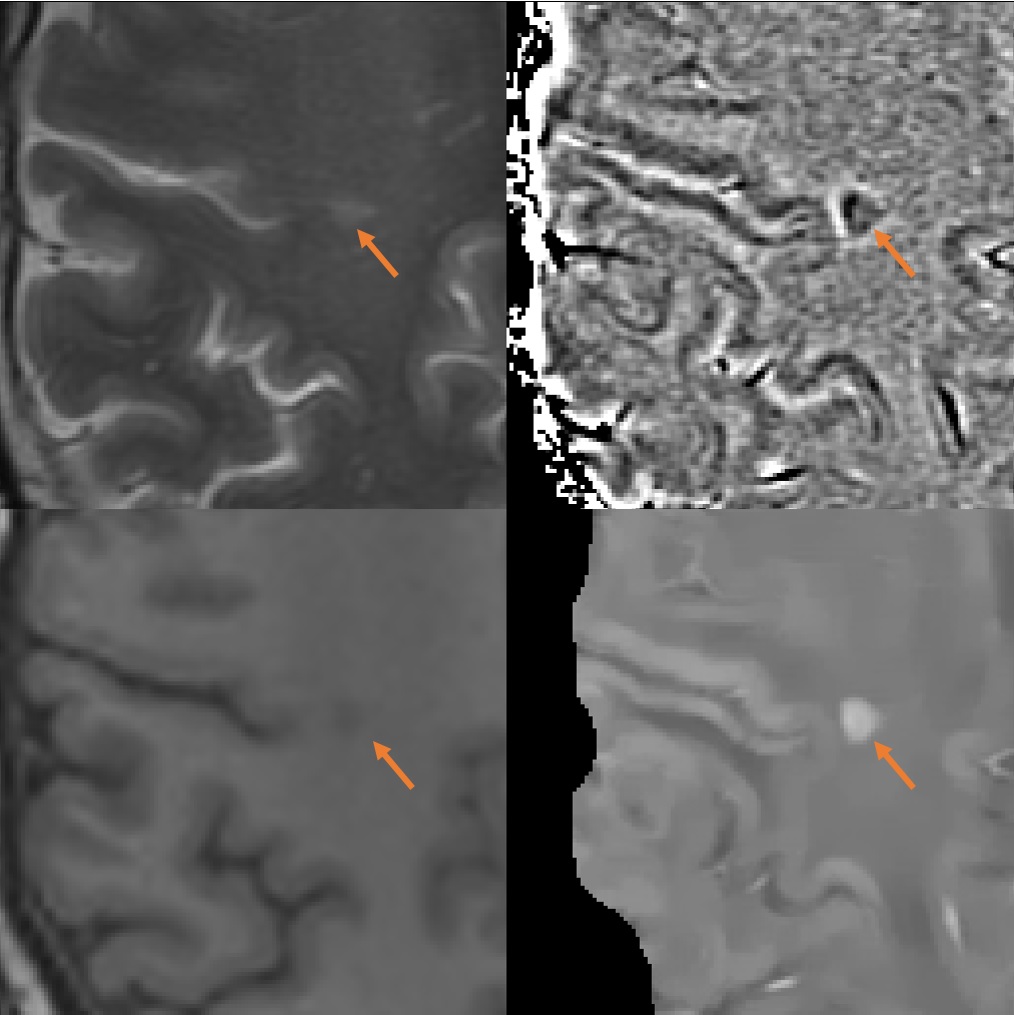
Figure 2. An example of a 45-year-old patient with a lesion located at the right semi-oval center. The lesion has a dark rim on the phase image, but appears solid without rim appearance on QSM. The VTr of the lesion was 0.79.
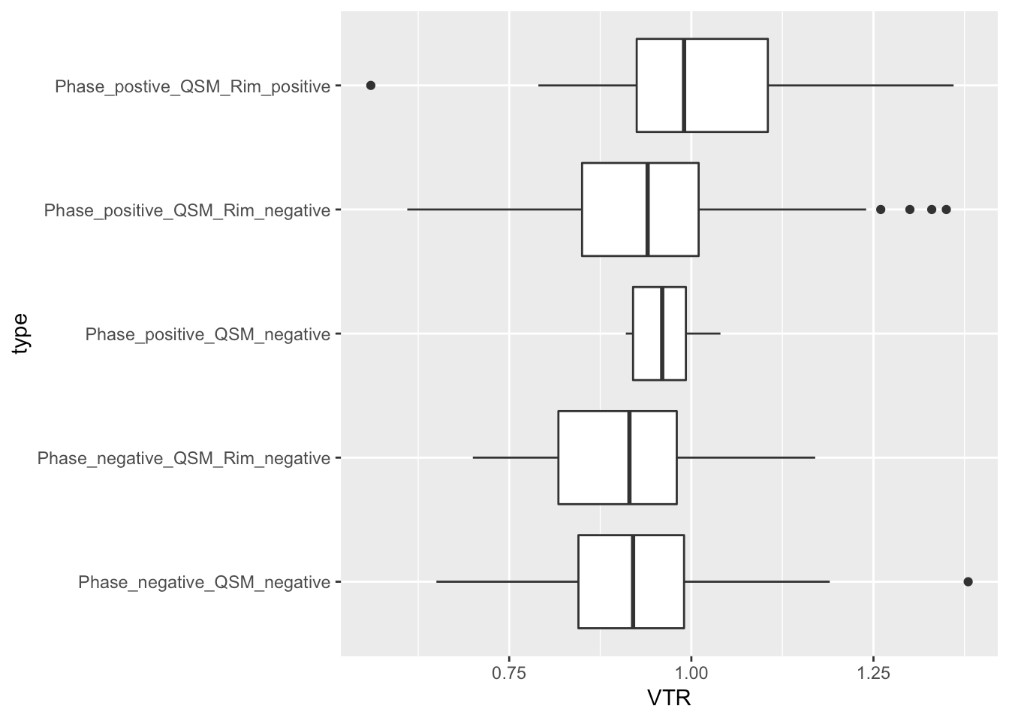
Figure 3. Plots VTr of each group with phase positive / negative and QSM rim+ / rim-. Only the phase positive QSM rim+ lesions had a statistically significant difference from the reference group (phase negative/QSM negative). In particularly, phase positive QSM rim positive lesions exhibit significant higher VTr than Phase positive QSM Rim negative lesions.