0038
Comparison of mFFE & Axial T2-Weighted Fast-Spin-Echo Sequences for Lesion Detection in Low-Disability Multiple Sclerosis Patients1Vanderbilt University Institute of Imaging Science, Nashville, TN, United States, 2Meharry Medical College, Nashville, TN, United States, 3Radiology & Radiological Sciences, Vanderbilt University Medical Center, Nashville, TN, United States, 4Biomedical Engineering, Vanderbilt University, Nashville, TN, United States, 5Clinical Neurology, Vanderbilt University Medical Center, Nashville, TN, United States
Synopsis
In multiple sclerosis (MS), detection of lesions in the spinal cord with MRI is important for diagnosis and monitoring of disease progression. Despite improved clinical MRI sequences, motion and pulsation artifact remain a challenge for small lesion identification. We sought to compare sensitivity for lesion detection between multi-echo gradient echo (mFFE) and T2-weighted fast-spin-echo (T2-FSE) sequences at 3T in 16 relapsing-remitting MS patients with low disability. By comparing lesion fraction and average lesion burden, we demonstrated that mFFE has greater sensitivity for spinal cord lesions than T2-FSE.
Introduction
Spinal cord (SC) MRI is integral for diagnosis and monitoring disease progression in multiple sclerosis (MS), yet conventional MRI struggles to identify the magnitude of disease in the SC. One standard clinical recommendation for SC imaging in MS is axial T2-weighted fast-spin-echo (T2-FSE), yet poor resolution and pulsation artifacts limit sensitivity to small lesions and assessment of disease burden.1,2 Studies show that multi-echo gradient echo (mFFE) MRI can be complementary and/or superior to the T2-FSE image for lesion detection due to improved resolution, sensitivity to spin-density changes, and reduction in pulsation artifacts.1,2 We compared mFFE to conventional T2-FSE for lesion sensitivity in relapsing-remitting MS (RRMS) patients with low disability by assessing overall lesion fraction and average lesion burden. In addition, we sought to demonstrate association with clinical disability.Methods
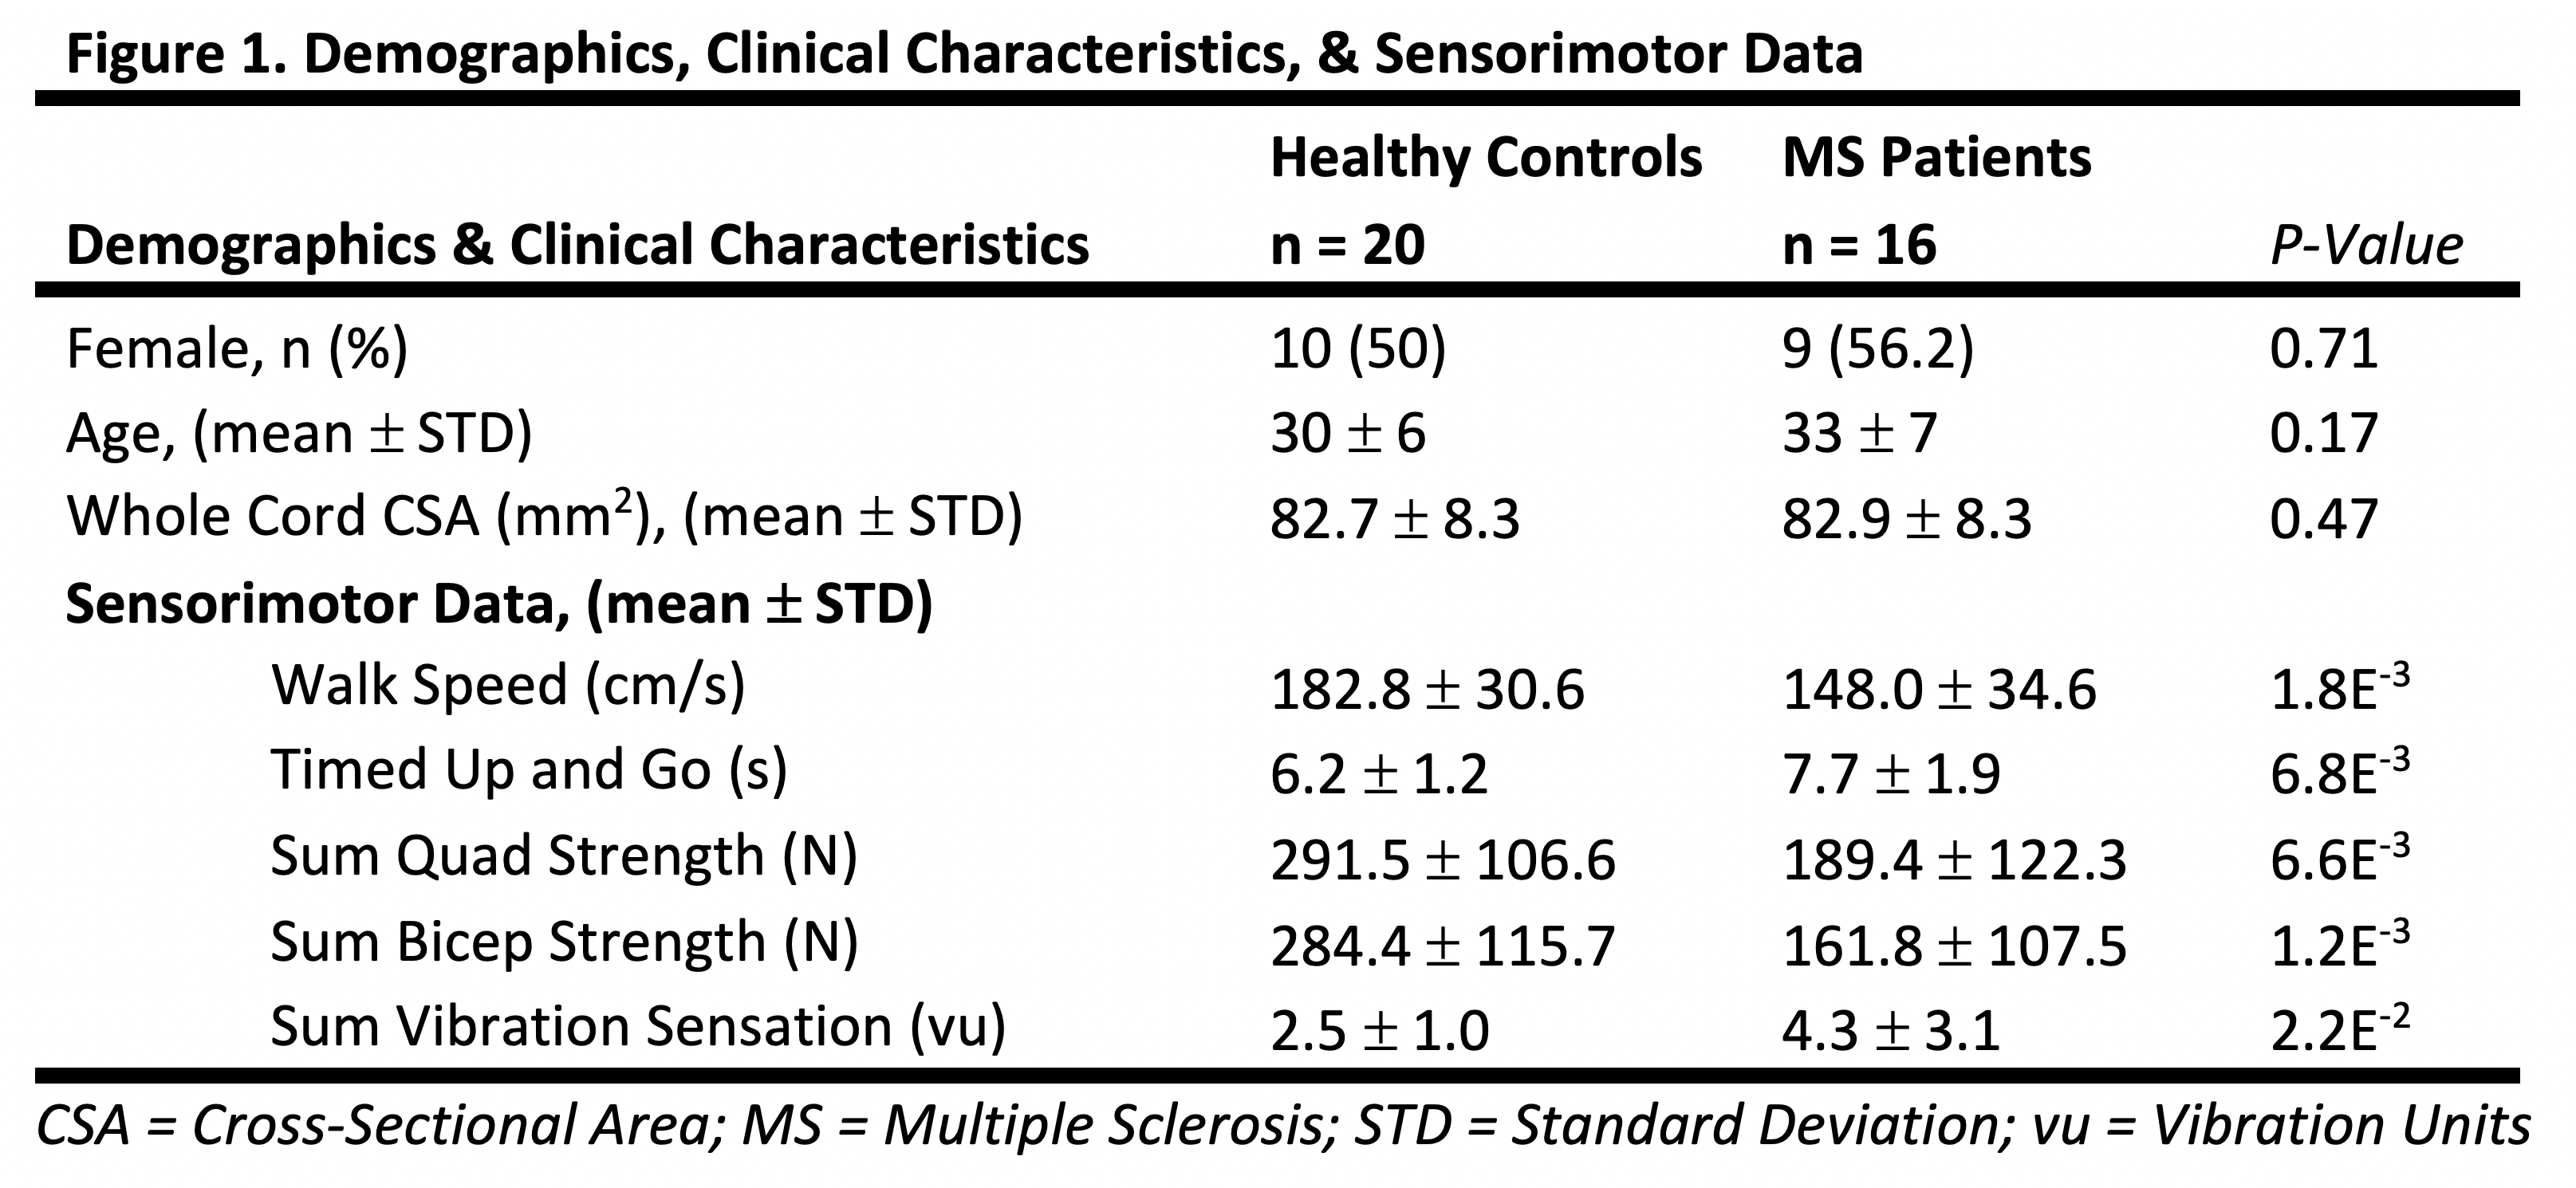
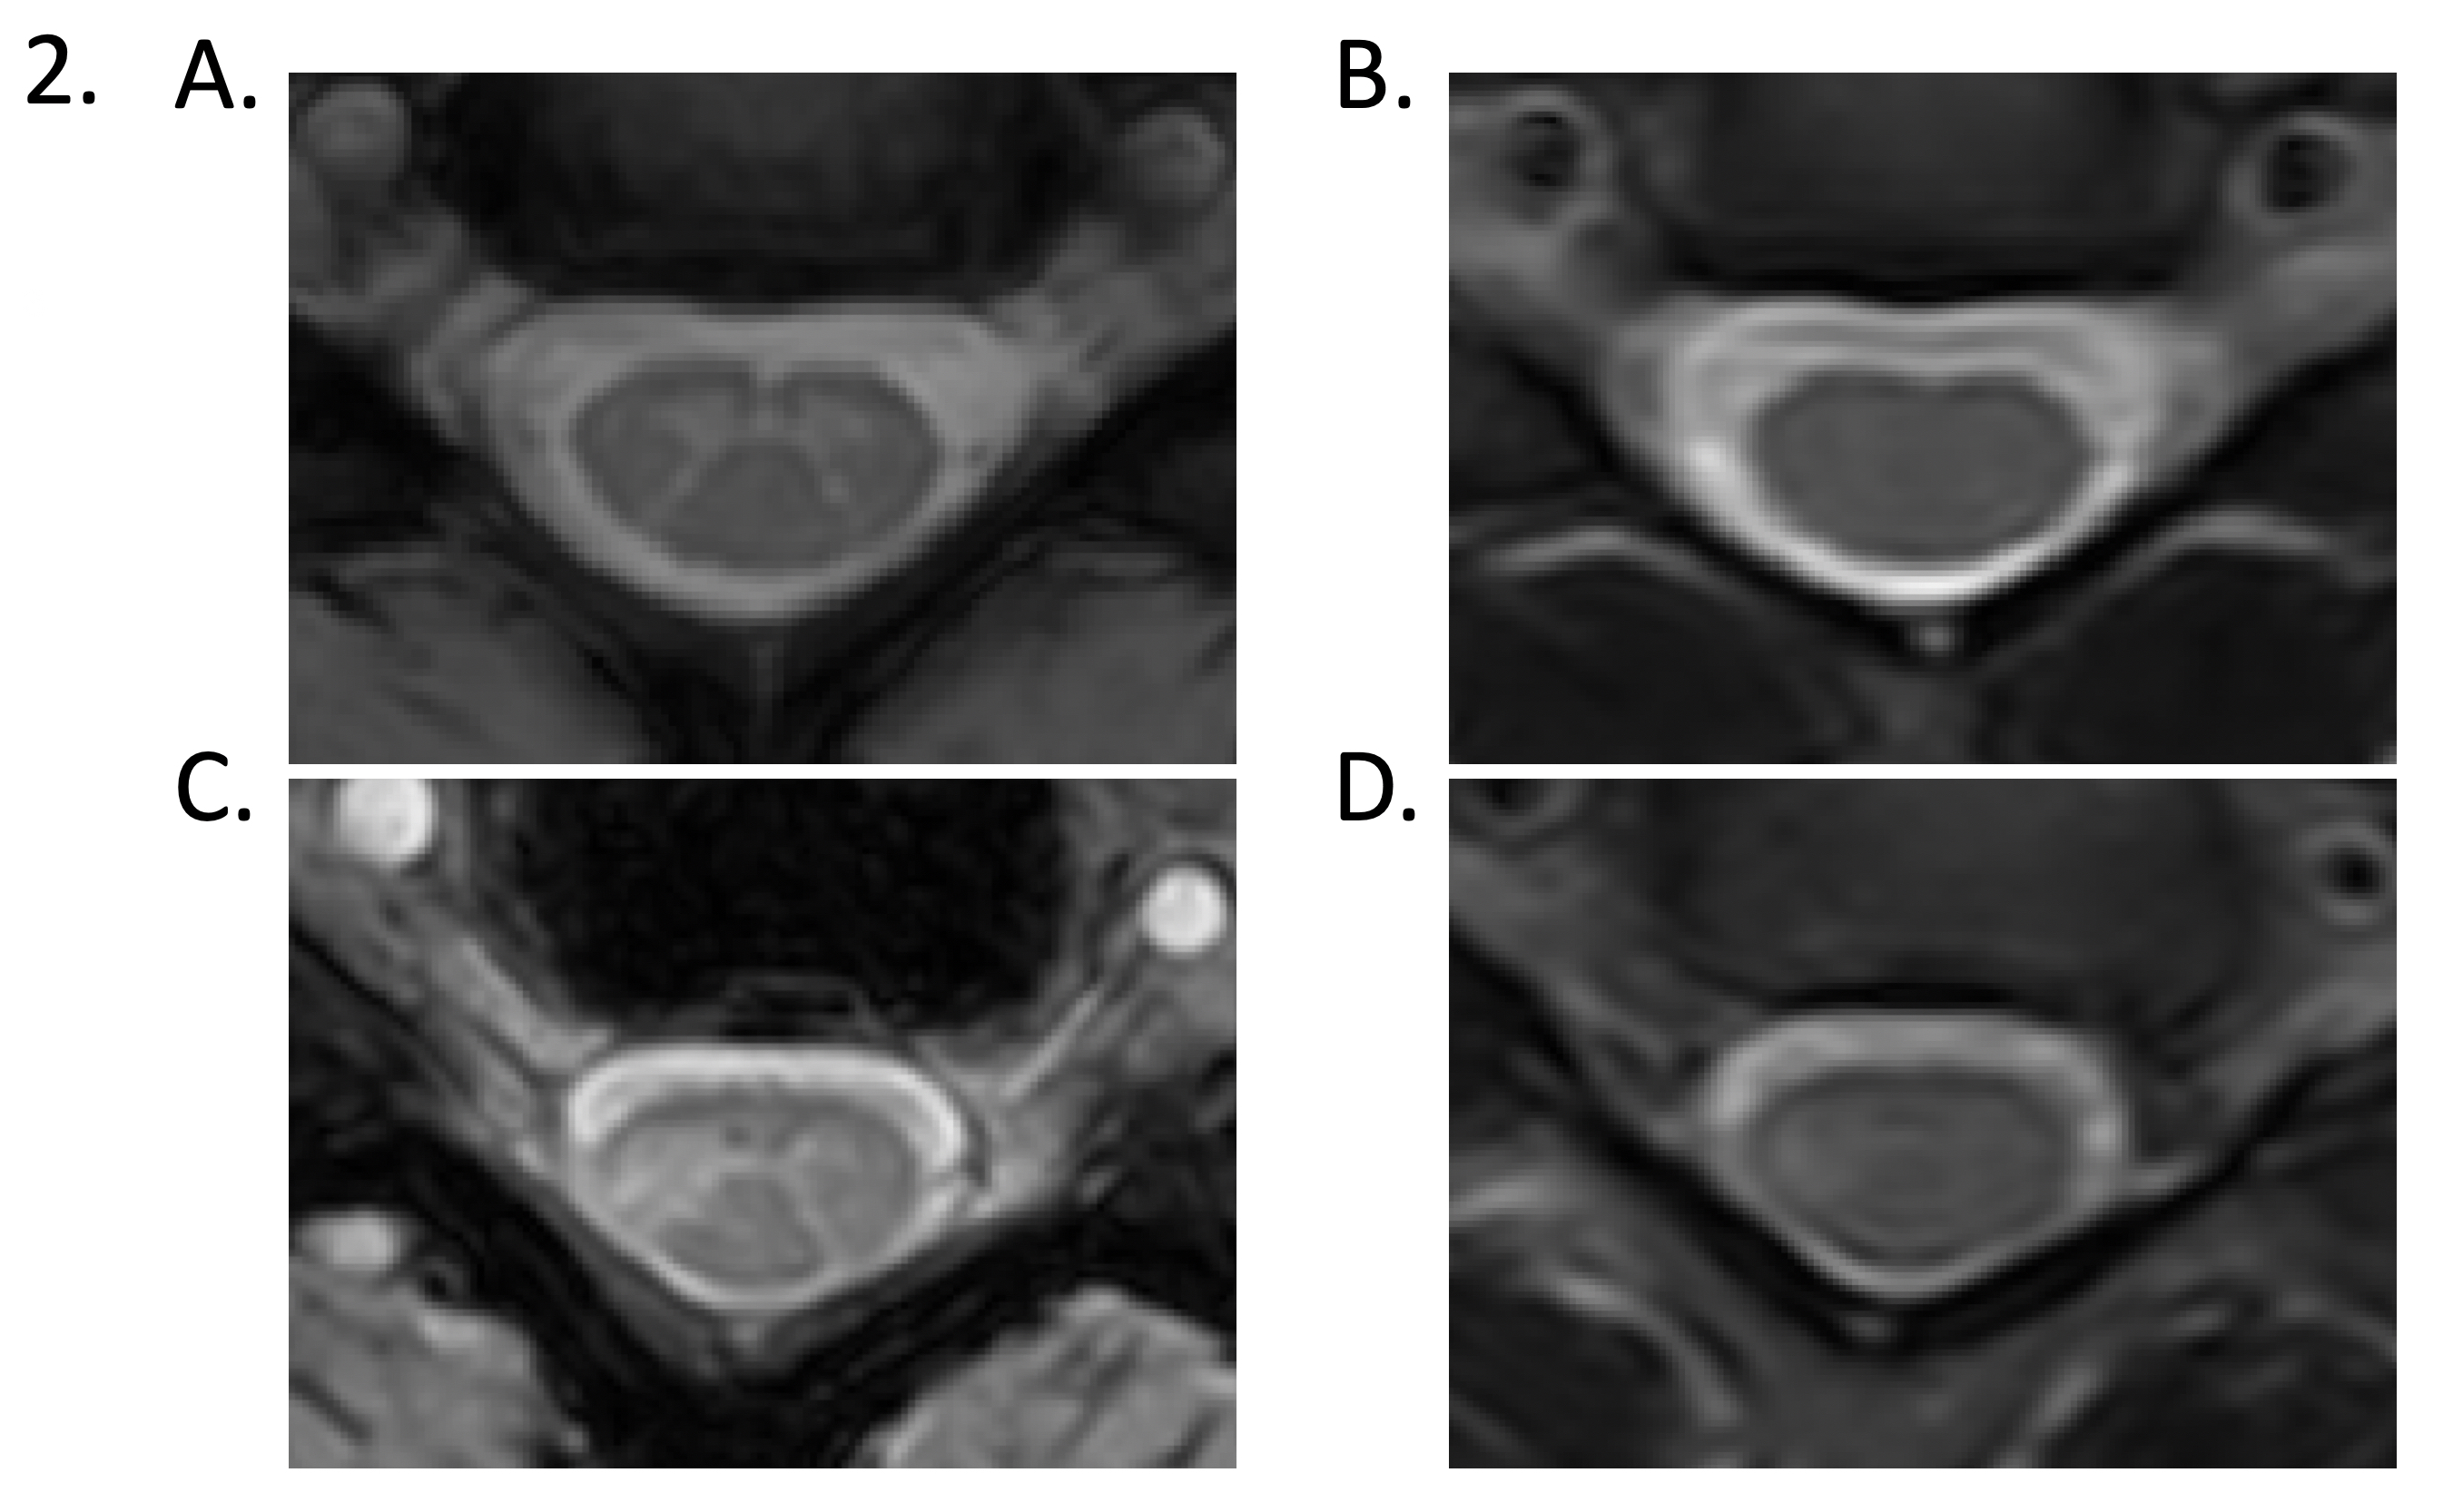
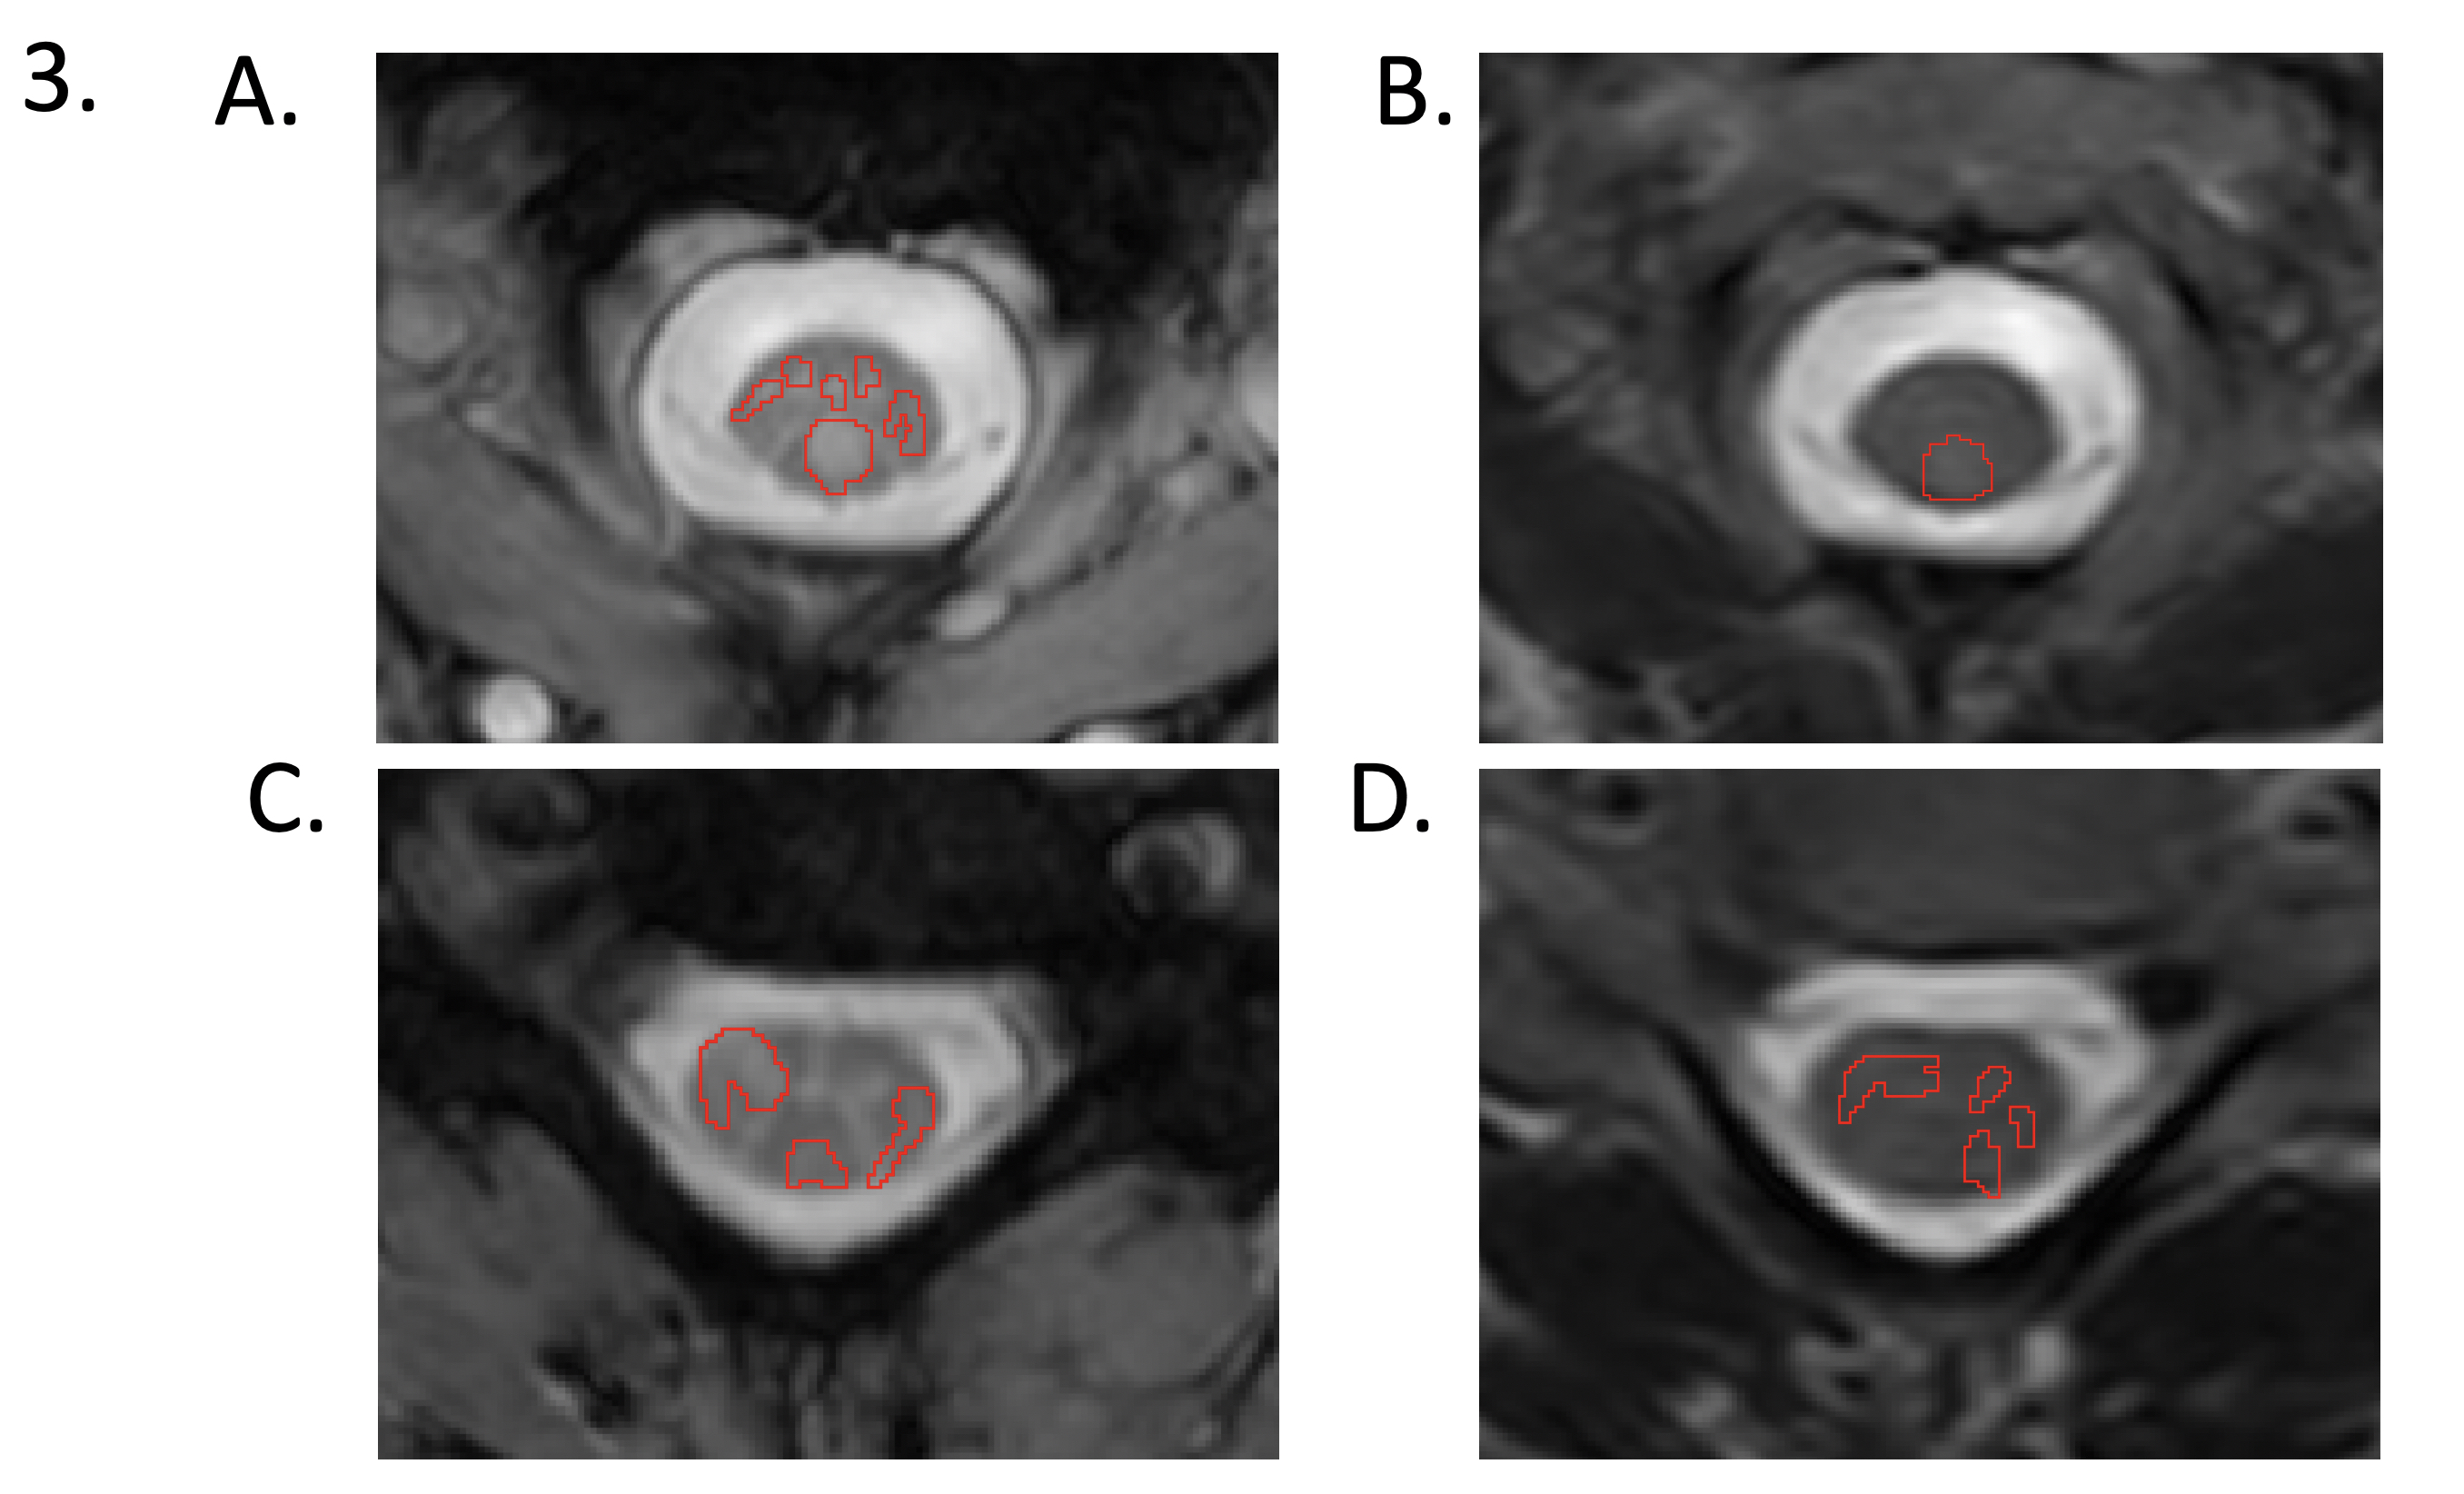
After local IRB approval, we studied 16 low-disability (EDSS < 1.5), RRMS patients and 20 healthy controls using a 3T MRI scanner (Philips Elition). Demographic information is shown in Figure 1. mFFE and T2-FSE images were obtained in all participants in the cervical SC centered at C3/C4 (Figure 2). Relevant scan parameters were: mFFE – TR/TE/deltaTE/alpha = 700/8.0/9.2 ms/28 degrees, acquired resolution = 0.65/0.65/5 mm3 (14 slices), scan time = 5:47 min. Three echoes were obtained and averaged prior to reconstruction. T2-FSE – TR/TE = 2642/85ms, TSE factor = 25, acquired resolution = 0.70/0.99/5 mm3 (14 slices), CS-SENSE = 2 and scan time = 3:18 min. Prior to MRI, all participants underwent sensorimotor testing including timed 25 foot-walk test, timed up and go (TUG) test, quantitative great-toe vibration sensation testing with a Vibratron II, and quadricep and bicep strength measurements with a hand-held dynamometer.Lesions were delineated manually in mFFE and T2-FSE images by a neuroradiologist with greater than 5 years of experience using MIPAV (NIH, Bethesda, MD, USA). mFFE images were segmented using SCT-Propseg to obtain SC cross-sectional area (CSA).3 Lesion fraction was computed for each image type as the percentage of the cervical SC occupied by lesions. Average lesion burden was calculated as the ratio of average lesion CSA to average CSA of the cervical SC.
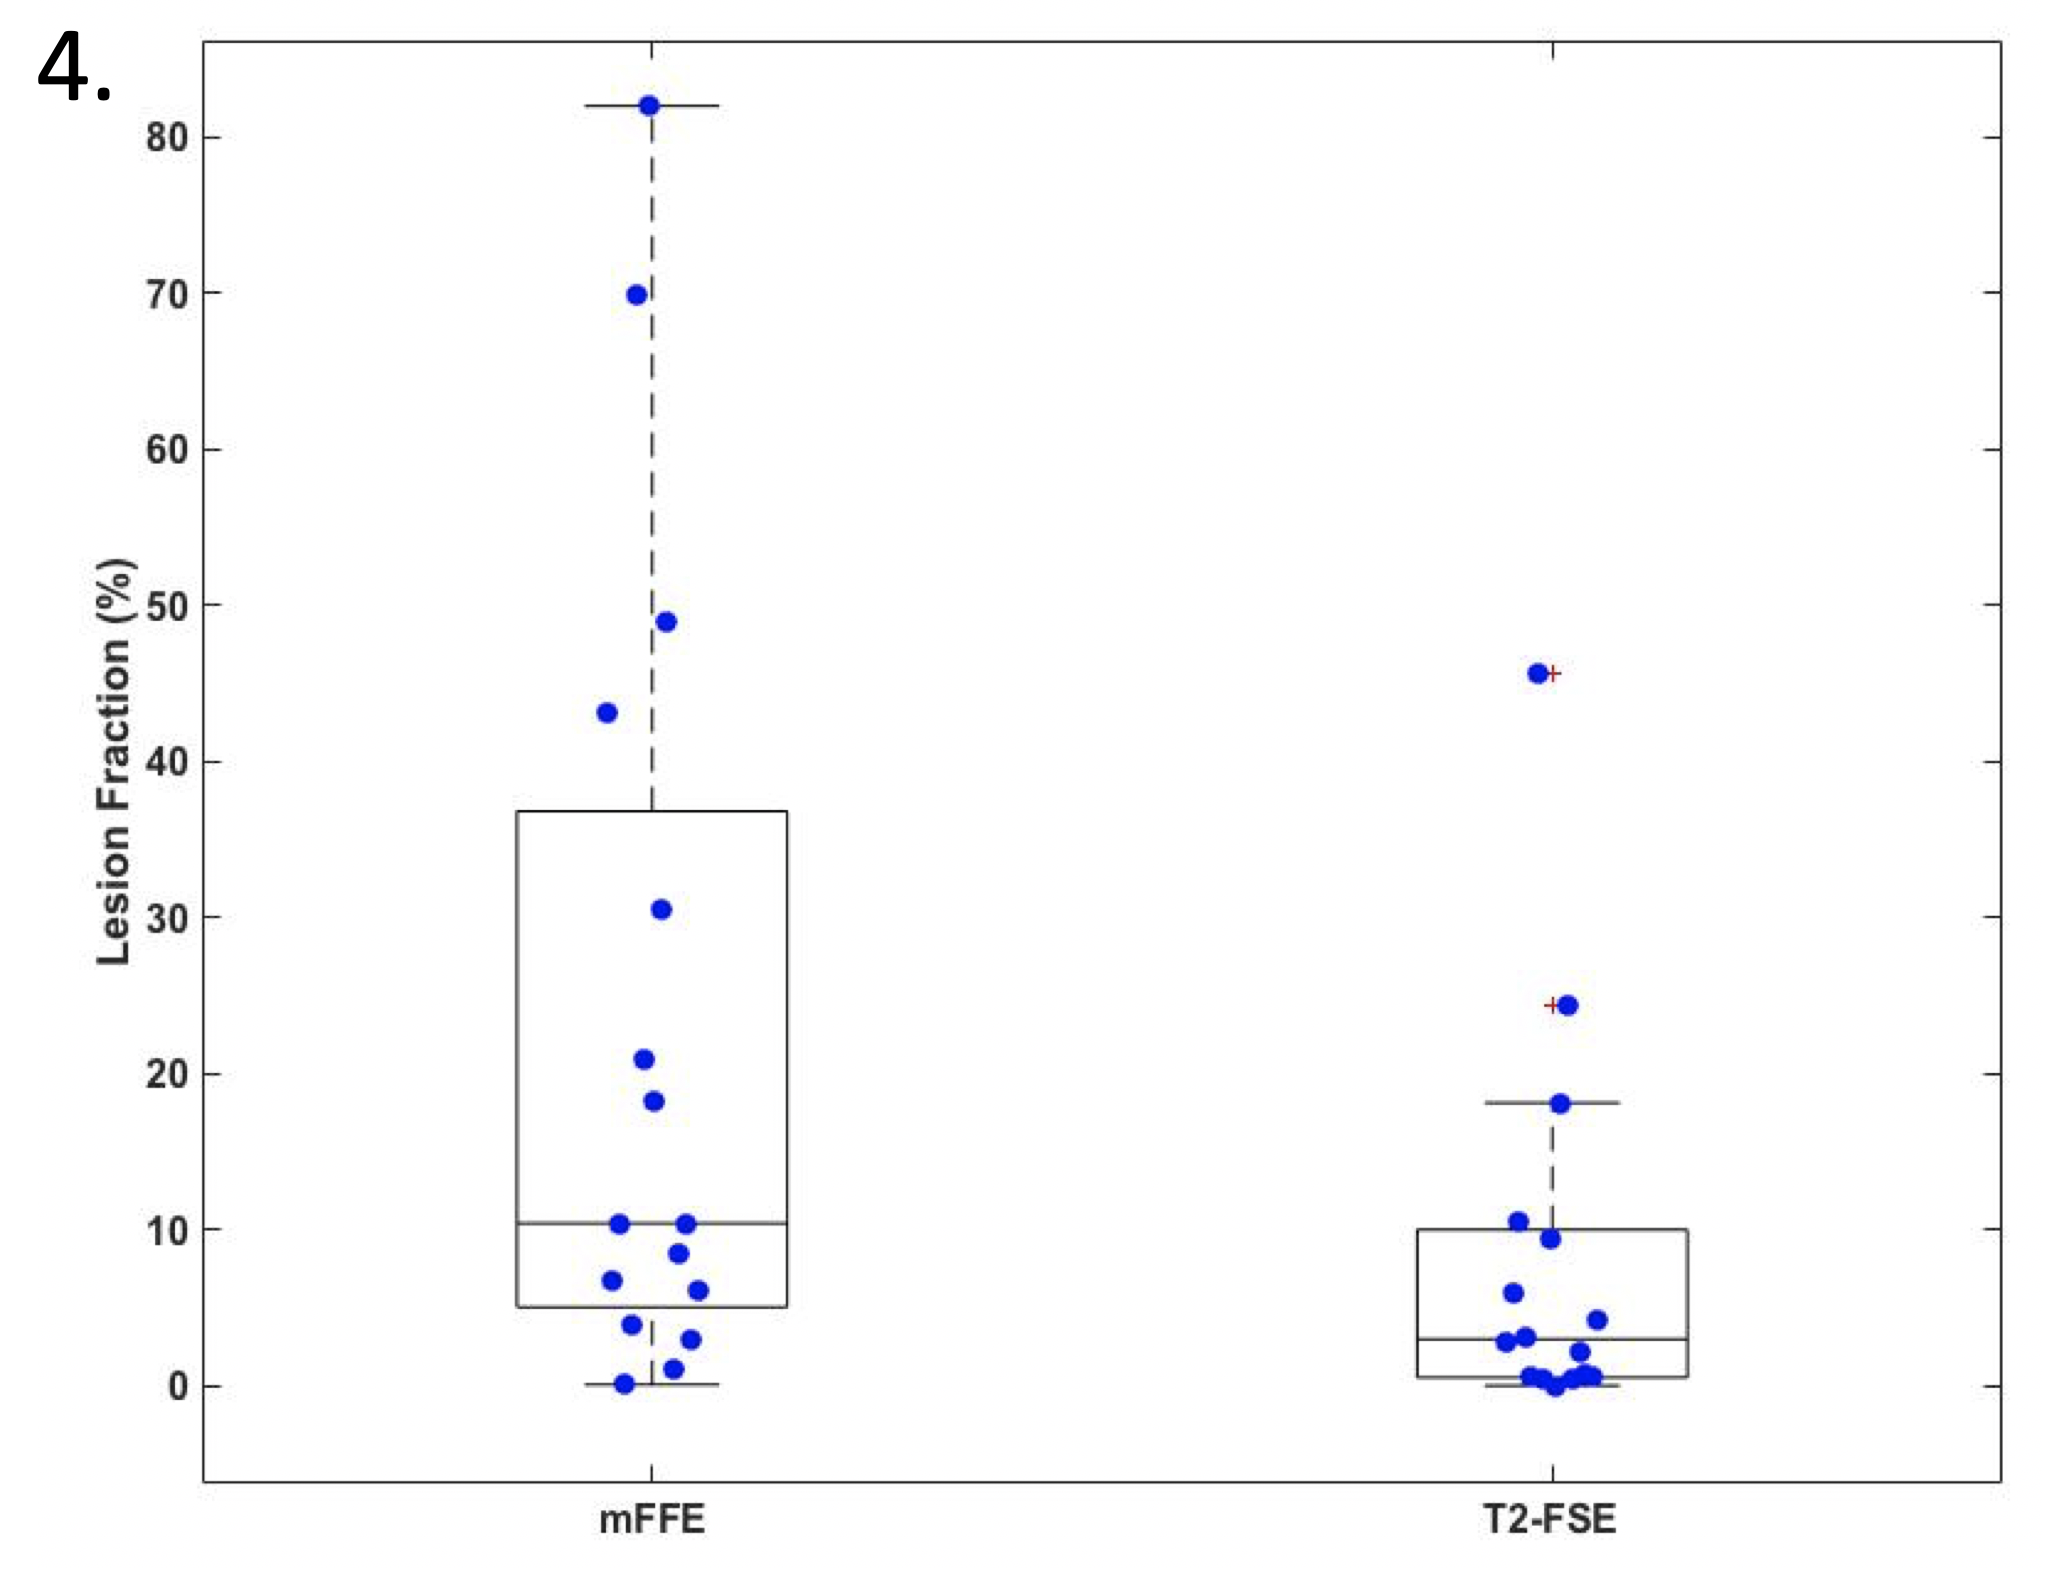
Group differences in age were compared using a two-tailed unpaired t-test, and sex distributions using a Pearson’s Chi-Square test. Mean SC CSA and sensorimotor (SM) data were compared between the two cohorts using a one-tailed unpaired t-test. In patients, associations between lesion fraction and average lesion burden to SM data were examined using a Spearman’s partial correlation with correction for disease duration. Statistical comparisons of lesion fraction and average lesion burden were performed between mFFE and T2-FSE using a paired Wilcoxon Signed-Rank test.
Results
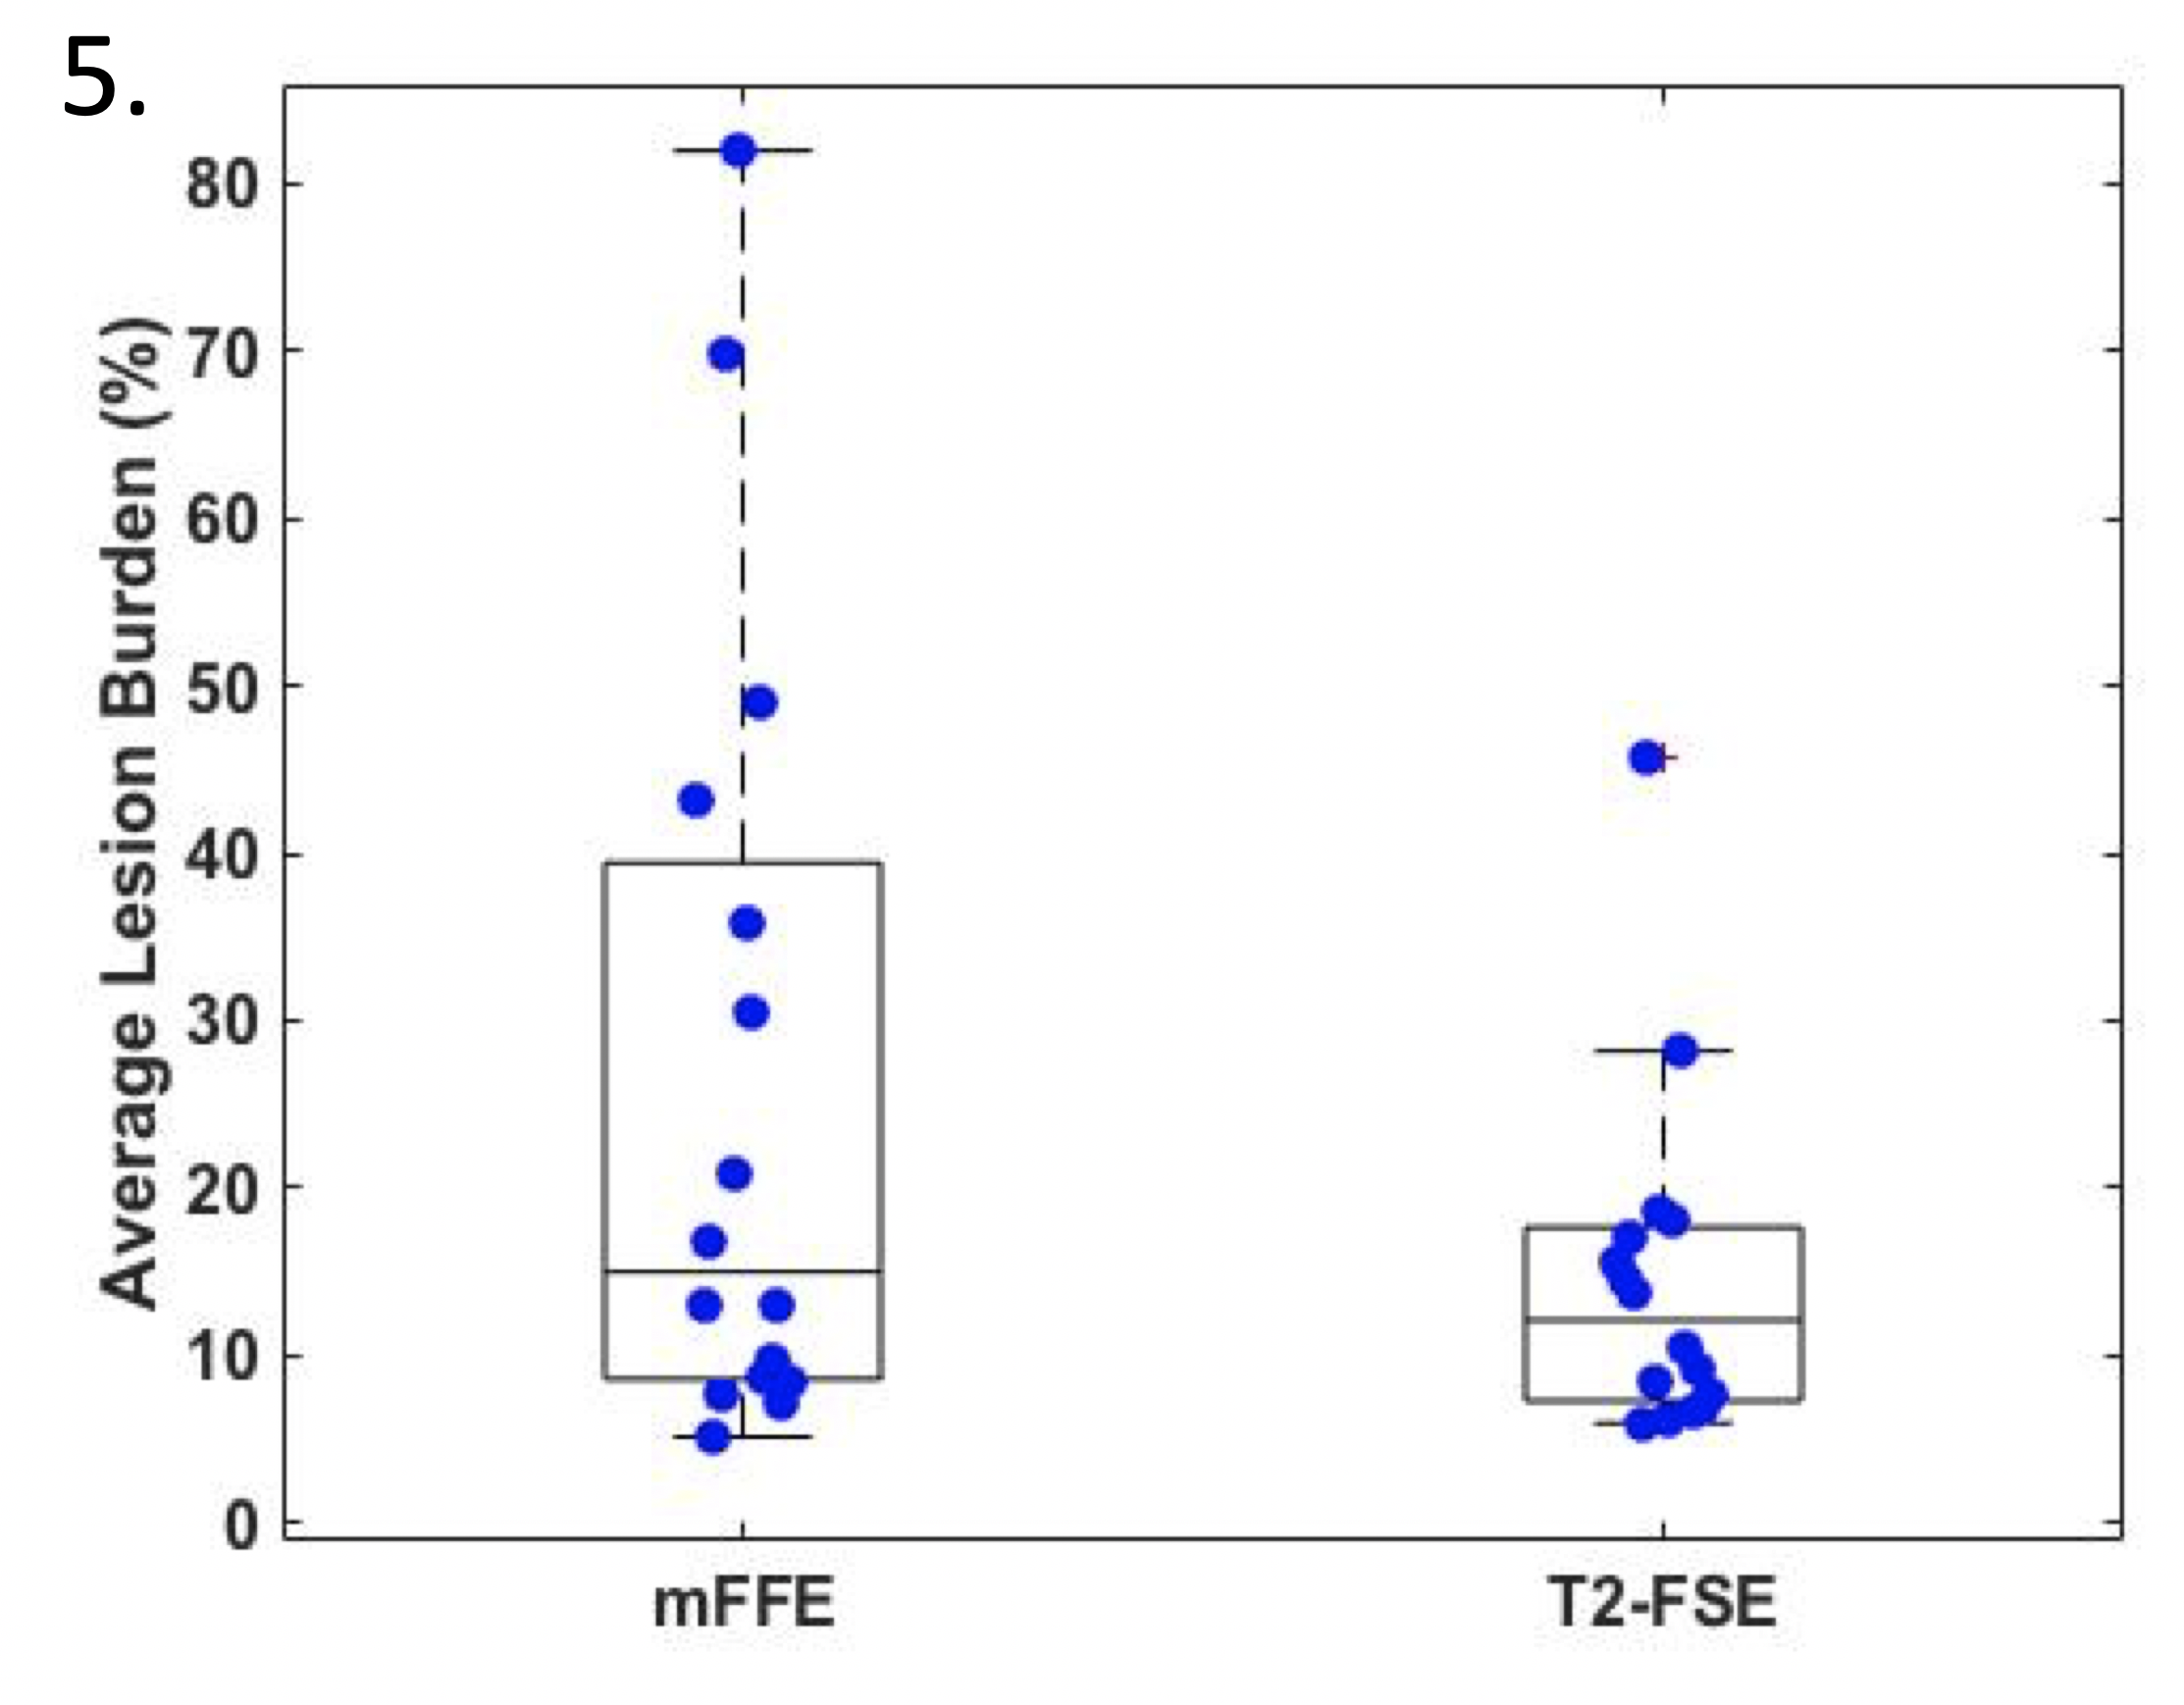
Figure 2 compares mFFE to T2-FSE in a healthy volunteer and an MS patient (EDSS = 0) demonstrating improved gray-white matter (GM/WM) contrast in the mFFE for the healthy volunteer and a greater appreciation of a right lateral column lesion involving both WM and GM. Figure 3 shows manual segmentation of lesions on both imaging contrasts at two different cervical SC levels for an RRMS patient (EDSS = 0).mFFE showed ~2.5 times greater lesion fraction (p = 0.0027) (Figure 4) and ~2 times greater average lesion burden as compared to T2-FSE (p=0.01) (Figure 5). We found no statistically significant group differences in mean cord CSA between mFFE and T2-FSE.
All SM assessments were significantly different between healthy volunteers and patients (Figure 1). However, there were no significant associations among lesion fraction and lesion burden and SM assessment for either mFFE or T2-FSE.
Discussion
We demonstrated that mFFE has greater sensitivity for SC lesions than T2-FSE even in low-disability MS patients, a patient population for whom SC lesion detection is critical. Lesion fraction is a more accurate metric of quantifying the amount of MS lesions in the cervical SC due to the use of true lesion area and whole SC area. We postulate that mFFE images have significantly greater lesion fraction as compared to T2-FSE due to superior GM/WM matter contrast and greater contrast between lesions and surrounding tissue.There were no significant correlations between lesion indices (lesion fraction or average lesion burden) and SM data for either sequence. This may demonstrate that cervical SC changes are present early in the disease process, but other factors contribute to neurological impairment (e.g. brain lesions or thoracic/lumbar SC lesions). The lack of correlation may also be due to small sample size and the need for lesion segmentation focusing on the relationship between column-wise lesions and sensorimotor outputs.4 Identifying column-wise indices of damage may provide better relationships with neurological deficits.5 In addition, our cohort of patients had relatively minor disability, a factor that may further limit functional correlations, but highlights the importance of improved imaging for diagnosis.
Conclusion
We demonstrate that mFFE imaging of the cervical SC is superior for detecting MS lesions in low disability patients when compared to T2-FSE. However, past literature has demonstrated that mFFE images can potentially increase the number of false positives in lesion identification due to the increased contrast.1 mFFE may provide unique, early information for clinical diagnoses, yet should be used in conjunction with T2-FSE for confirmation of disease impact.Acknowledgements
Funding Sources: NIH/NINDS (KO, SS), NMSS (SS), Conrad N. Hilton Foundation (SS), Vanderbilt Chancellor’s Faculty Fellowship (SS). Thank you to the VUIIS Radiology Technologists and the willingness of the participants to join in this study.References
1. Martin, N., Malfair, D., Zhao, Y., et al. Comparison of MERGE and axial T2-weighted fast spin-echo sequences for detection of multiple sclerosis lesions in the cervical spinal cord. AJR Am J Roentgenol, 2012;199(1):157-162.
2. Ozturk, A., Aygun, N., Smith, S.A., et al. Axial 3D gradient-echo imaging for improved multiple sclerosis lesion detection in the cervical spinal cord at 3T. Neuroradiology, 2013;55(4):431-439.
3. De Leener, B., Kadoury, S., & Cohen-Adad, J. Robust, accurate and fast automatic segmentation of the spinal cord. Neuroimage, 2014:98:528-536.
4. Zackowski, K.M., Smith, S.A., Reich, D.S., et al. Sensorimotor dysfunction in multiple sclerosis and column-specific magnetization transfer-imaging abnormalities in the spinal cord. Brain, 2009;132(5):1200-1209.
5. De Leener, B., Taso, M., Cohen-Adad, J., et al. Segmentation of the human spinal cord. Magn Reson Mater Phy, 2016: 29(2):125-153.
Figures