0035
Oxygen Extraction Fraction Mapping using Remote Sensing: Spatially Encoded T2-Relaxation-Under-Spin-Tagging (SE-TRUST)1Wellcome Centre for Integrative Neuroimaging (FMRIB), University of Oxford, Oxford, United Kingdom
Synopsis
This work uses remote sensing methods to encode spatial information of venous blood spins in the brain into the longitudinal magnetisation. This information was then decoded remotely from the blood signal in the superior sagittal sinus. A T2-preparation module allowed venous blood T2 and therefore oxygen extraction fraction, to be mapped. An optimum inversion delay (TI) of 2s was found, and the sensitivity of the method to the spatial origins of the blood spins was verified. Low resolution venous T2 maps were obtained in two healthy volunteers. Average values were comparable to global T2 using conventional TRUST.
Introduction
T2-Relaxation-Under-Spin-Tagging (TRUST) is a method for measuring global oxygen extraction fraction (OEF) via measurement of venous blood T2 in the superior sagittal sinus (SSS). Selective Localised TRUST (SL-TRUST) has been demonstrated to localise venous blood T2 measurements down to a 70x70x80mm3 tissue region1. However, prior knowledge of the tissue area under investigation is required. Here, we present an alternative approach, Spatially-Encoded (SE-)TRUST, which uses remote sensing to produce 2D maps of venous blood T2 and therefore oxygen extraction fraction.Theory
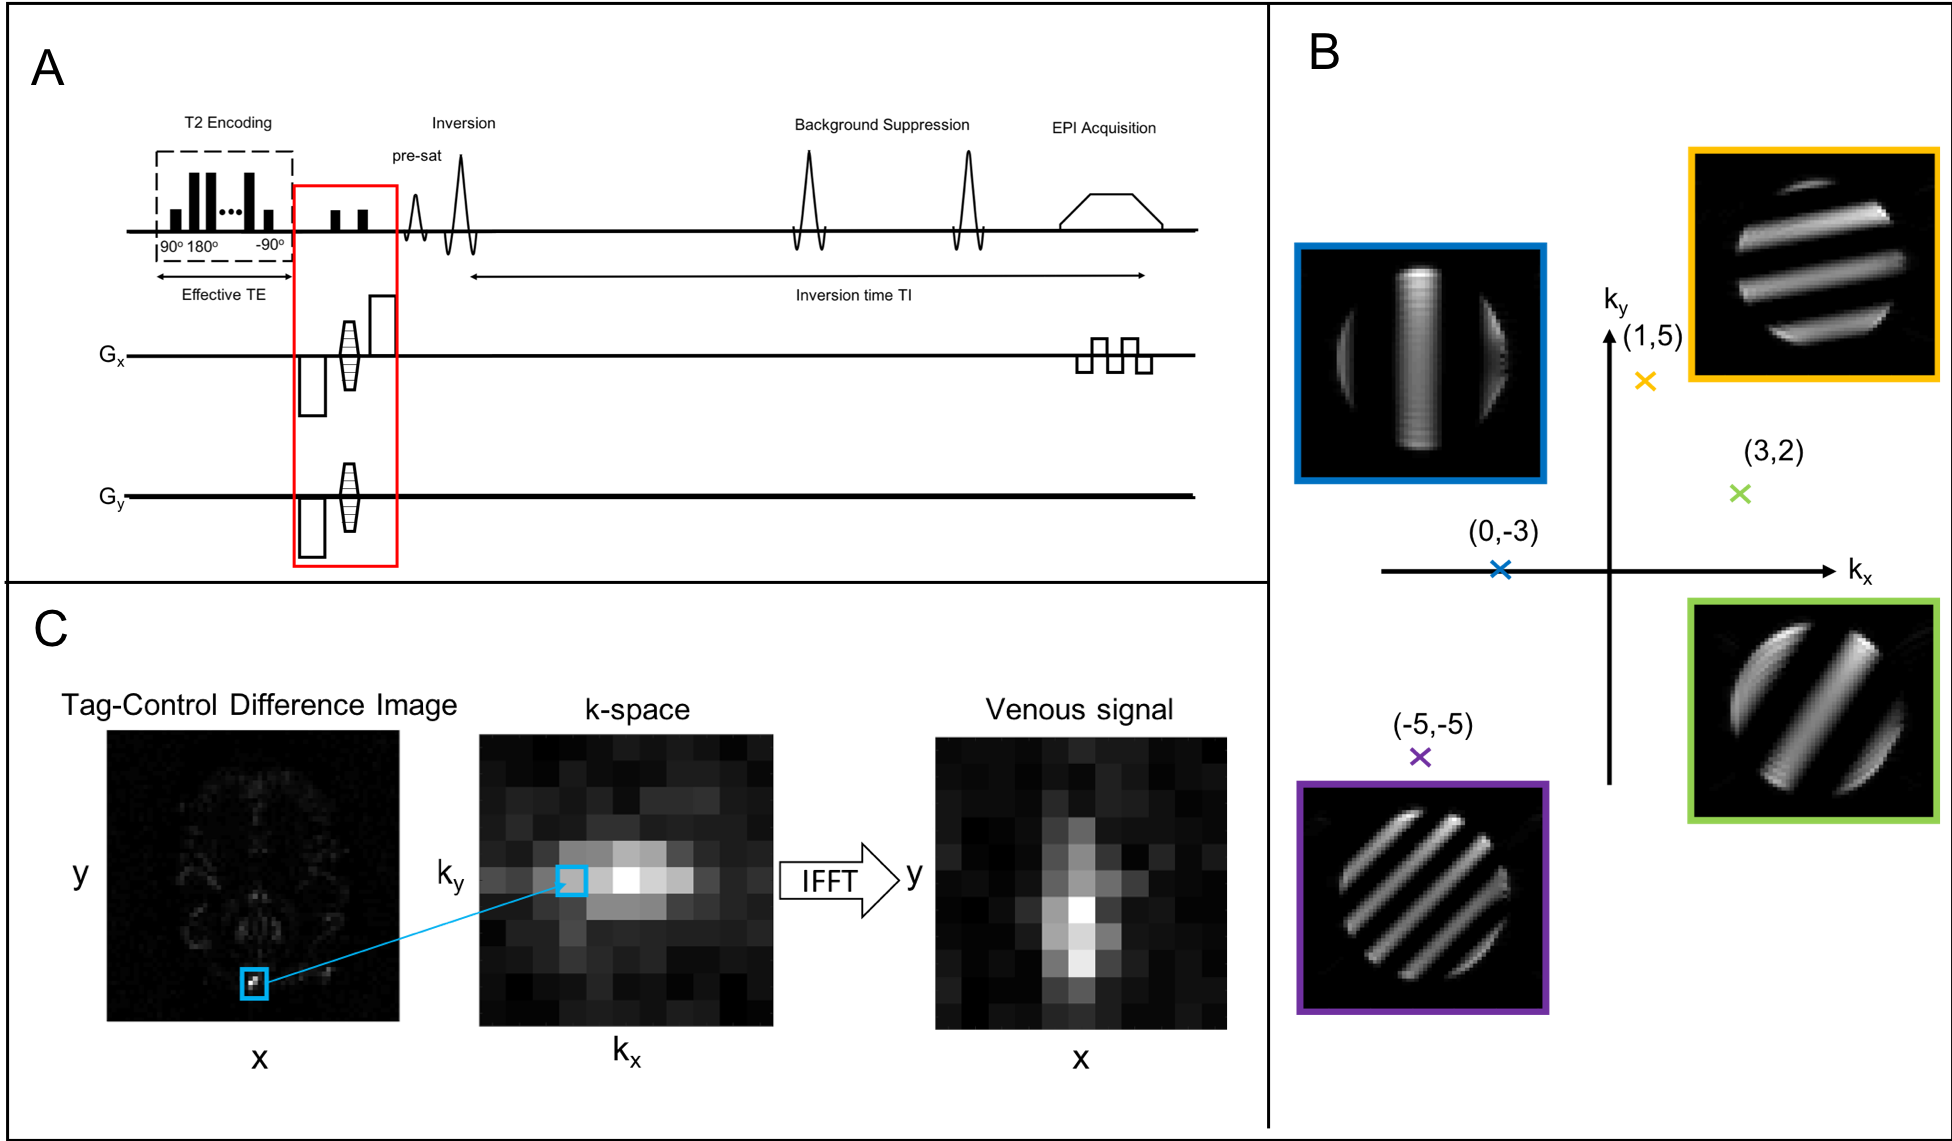
Remote sensing enables the encoding and probing of environments to be separated both temporally and spatially2,3. In the context of this work this enables the spatial origins of venous blood spins to be probed after they leave the brain. A hard 90° pulse is followed by a phase encoding gradient which produces a linear variation in the phase of the spins across the brain. A second 90° pulse flips the magnetisation back along the z-axis, storing a sinusoidally modulated component of the net magnetization along the longitudinal axis, see Fig(1B). This preparation is phase-cycled to acquire both the real and imaginary components (henceforth referred to as the cos and sin components). These components are combined to give $$$S_{z}$$$, the signal in k-space corresponding to the degree of modulation applied:$${S_z} = {S_{cos}} + i{S_{sin}} [1] $$
A 2D k-space matrix is populated in this manner by varying the phase encoding gradients. This k-space matrix is then transformed into image space using an Inverse Fast Fourier Transform (IFFT) thus producing a map which represents the distribution of spins at the time of encoding, see Fig(1C)3.
Methods
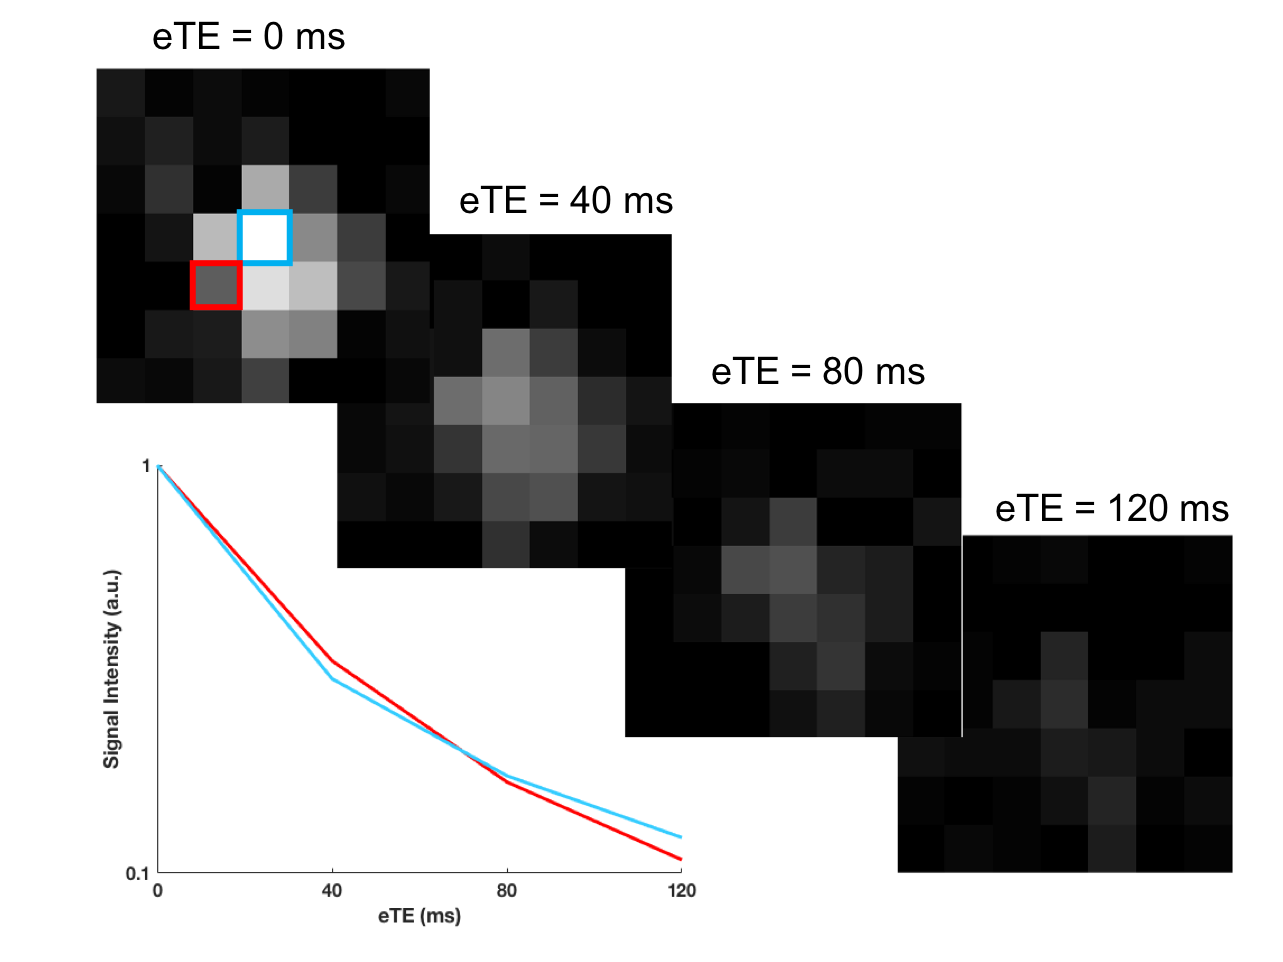
The phase encoding gradients are inserted between a T2-encoding module and a tag-control inversion pulse in SE-TRUST, see Fig(1A). An inversion delay TI allows blood spins to flow into the SSS where they are measured. Background suppression and pairwise subtraction of tag-control images removes static tissue signal and thus leaves an image consisting only of tagged blood spins, which are averaged across a SSS ROI. The real component of the venous blood signal from both the cos and sin phase encoding components are combined using Eq[1] to give each point in the k-space matrix, demonstrated in Fig(1C). Data are acquired for several T2-weightings (eTE = 0, 40, 80, 120 ms), and thus the T2 of each voxel in the map can be calculated assuming mono-exponential decay1. Fig(2) shows the reconstructed maps at multiple T2-weightings and the resulting T2 curves for two representative voxels within the map.As each point in the k-space matrix is sampled independently and requires four acquisitions, for a typical SE-TRUST experiment using TR = 4s, an 11x11 resolution T2 map would take 128 minutes. A partial Fourier reconstruction method, Projection onto Convex Sets (POCS), was therefore used to reduce the acquisition time, only acquiring 70% of k-space4. Despite this, for full eTE experiments, the resolution needed to be reduced to a 7x7 grid, to give a scan duration of 37 minutes.
Results
All maps are displayed with the posterior of the brain along the bottom edge of the images.Fig(3) shows maps at eTE = 0 ms for a variety of inversion times TI = 1400, 1800, 2000, and 2200 ms. TI = 2000 ms gave consistently good reconstructions across multiple subjects, and is therefore the recommended inversion delay for the method at this stage.
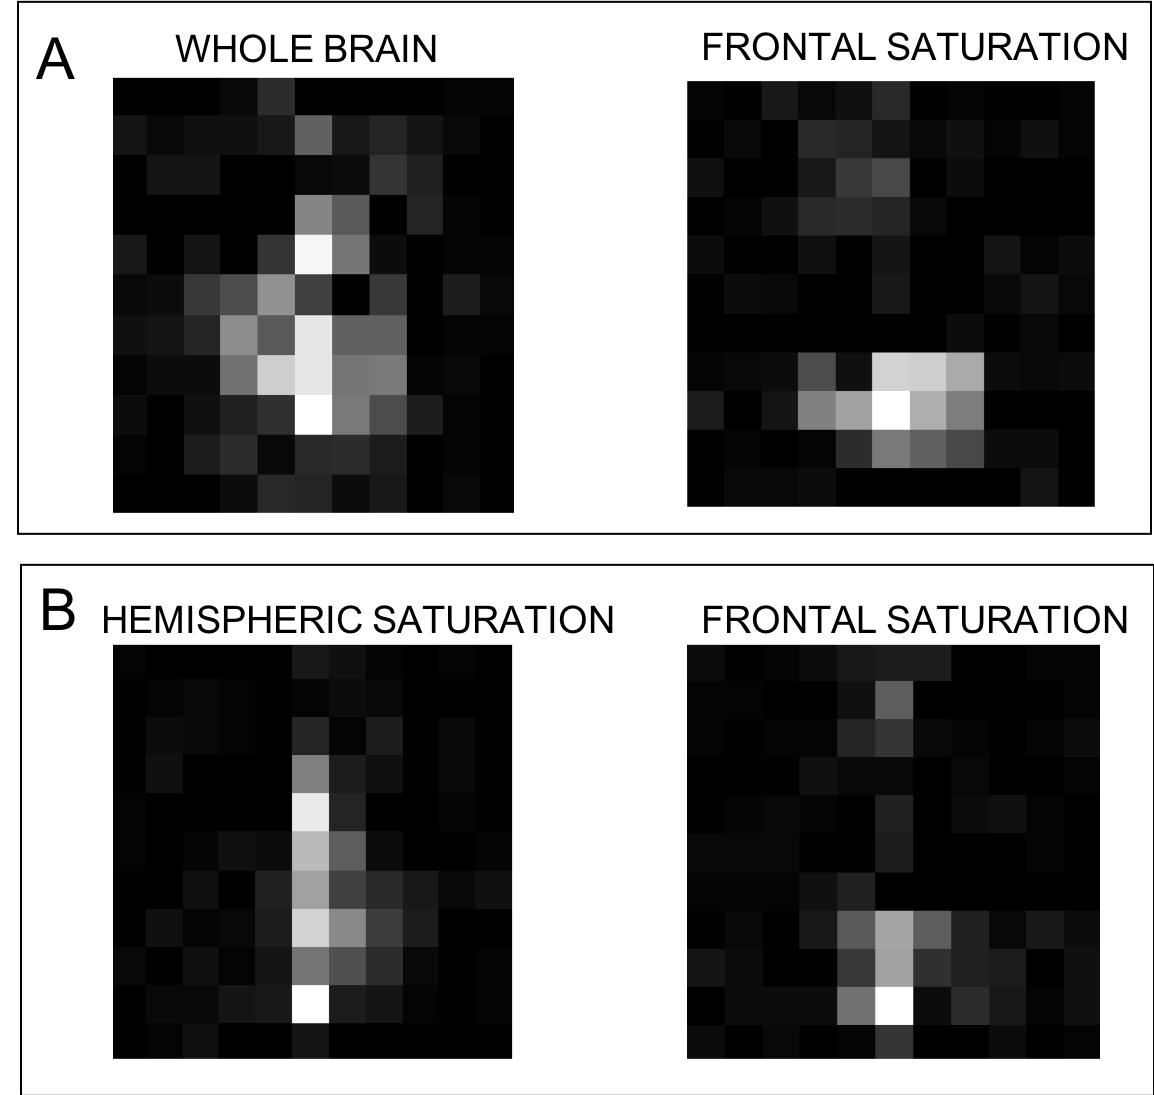
To verify the sensitivity of the remote reconstruction method to the spatial origins of the venous blood spins saturation pulses were inserted after the inversion pulse to spatially saturate and remove signal from particular brain regions. The reconstructed maps, shown in Fig(4), show either zero or reduced signal in the tissue regions that were saturated, demonstrating that the method is indeed sensitive to the spatial location of the spins at the time of phase encoding.
Two full T2 maps in healthy controls were obtained alongside a whole-brain TRUST T2 measurement5 for comparison and are shown in Fig(5). The average T2 across the two maps is 60.3 ± 14.3 ms and 63.1 ± 8.7 ms (mean ± std across all voxels in the brain). In comparison, the TRUST T2 values were found to be 56.16 ms and 56.66 ms, respectively. Although there is some variation within the maps these correspond well with expected T2 values1,5.
Discussion
This work demonstrates preliminary application of remote sensing methods in the brain to measure venous blood T2 and reconstruct maps of cerebral oxygenation. Initial optimisation indicated that TI=2 s gave a good balance between achieving a broad spatial distribution of venous blood spins which contribute to the measurement and signal loss due to T1 decay. We have also demonstrated the sensitivity of the remotely reconstructed maps to the spatial origins of the blood spins. Further work would benefit from the use of a flow phantom in order to investigate the effect of non-uniform flow and blood arrival times3. Further acceleration could be performed using compressed sensing methods which would lend themselves well to this technique, since the sampling of k-space can be truly random. With some further improvements this technique could provide valuable information regarding venous physiology and regional changes in OEF.Acknowledgements
This work was supported by funding from the Engineering and Physical Sciences Research Council (EPSRC) and Medical Research Council (MRC) [grant number EP/L016052/1], the Dunhill Medical Trust and the Royal Academy of Engineering. The Wellcome Centre for Integrative Neuroimaging is supported by core funding from the Wellcome Trust (grant 203139/Z/16/Z).References
[1] O’Brien C, Okell TW, Chiew M, Jezzard P. Volume localized measurement of oxygen extraction fraction in the brain using MRI. Magn Reson Med. 2019;82(4): 1412–1423
[2] Wong E, Guo J. VENTI: Venous Territory Imaging using Remote Sensing. 2013; Proceedings in ISMRM, Salt Lake City, Utah, USA.
[3] Seeley JA, Han SI, Pines A. Remotely detected high-field MRI of porous samples. J Magn Reson 2004;167(2):282-290.
[4] Sezan M, Stark H. Tomographic image reconstruction from incomplete view data by convex projections and direct fourier inversion. IEEE Trans Med Imaging 1984;3(2):91-98.
[5] Lu H, Ge Y. Quantitative evaluation of oxygenation in venous vessels using T2-Relaxation-Under-Spin-Tagging MRI. Magn Reson Med 2008;60(2):357-363.
Figures
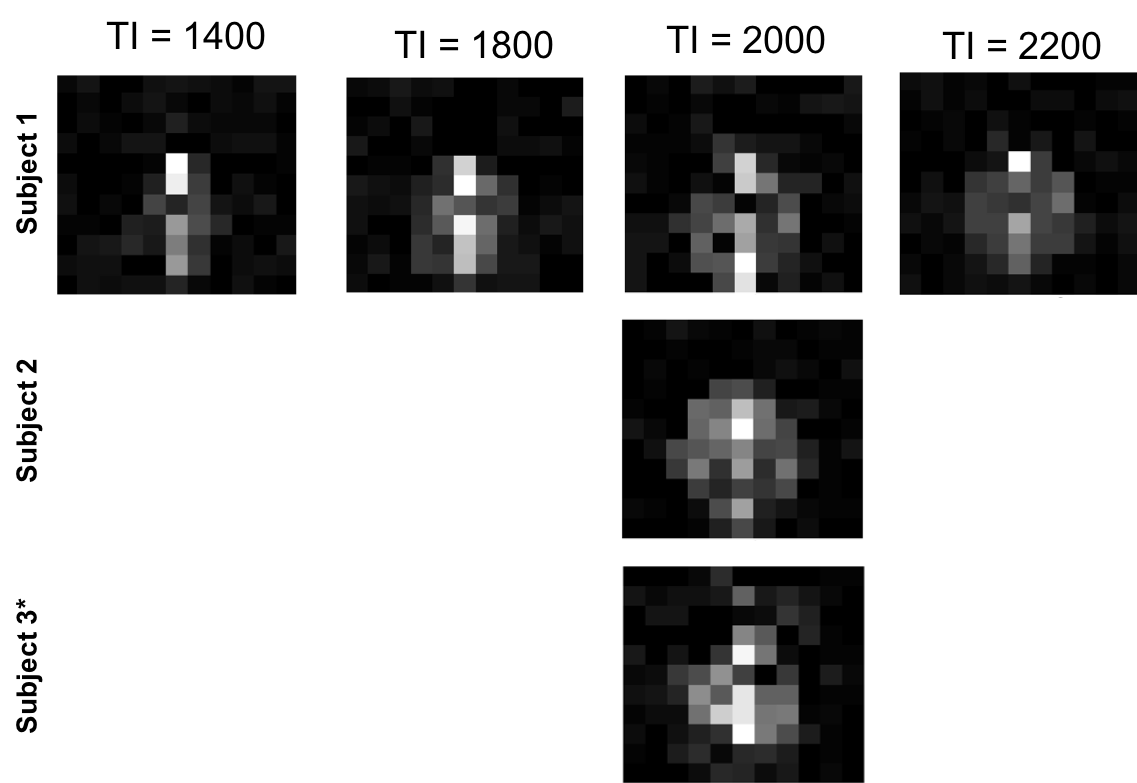
Optimising for TI: At TI = 1400 ms most of the signal appears to be from the occipital lobe and midline, whereas when the TI is extended to TI = 1800 and 2000 ms more of the signal appears to be arriving from the more lateral brain regions. At the maximum tested inversion time of TI = 2200 ms the balance between the number of blood spins arriving versus the inherent T1 decay of the signal appears to reach a stage where there is a net loss of signal. Therefore an inversion delay of TI = 2 s was chosen as being the most appropriate for this work and is demonstrated in 2 additional healthy subjects.