0034
High Resolution Water Exchange Rate Mapping using 3D Diffusion Prepared Arterial Spin Labeled Perfusion MRI1Cornell University, Ithaca, NY, NY, United States, 2Weill Cornell Medicine College, New York, NY, United States, 3Weill Cornell Medicine, New York, NY, United States
Synopsis
In this work, we propose an optimized acquisition for high resolution water exchange rate (kw) mapping, that uses adiabatic RF pulses, 3D fast spin echo readout, regularized inversion to a direct model of the water exchange rate, and fast T1 mapping. Feasibility and superior performance is shown in a regional based analysis in 6 healthy subjects.
Introduction
The blood–brain barrier (BBB) plays a critical role in oxygen and nutrition delivery, clearance of toxic metabolites, and protection of the central nervous system (CNS) from infection1. BBB breakdown is known to play a role early in the course of Alzheimer’s Disease(AD) based on CSF biomarker and imaging data in animal models and in patients. Recently, an Arterial Spin Labeling(ASL) based sequence is introduced to map the signal change in capillary and tissue compartment and derive water exchange rate (kw)2. However, composite RF pulses were used for the diffusion preparation leading to potential artifact near the edge of brain3. Also, The kw fit to the fraction of capillary/tissue signal is very noise sensitive, which is exacerbated further by the low SNR in ASL. We propose to overcome these problems by using an adiabatic RF pulse3 and fit kw directly to the signal equation of the two compartment signal equations.Methods
Algorithm:Recently, a capillary-tissue compartment model of pseudo-continuous ASL (pCASL) signal incorporating the exchange rate of water from blood to tissue was introduced4:
$$\Delta M_{b}(t)=-\frac{2CBF\varepsilon M_{0}\beta }{\lambda}[\frac{e^{-(R_{1a}-R_{1b}\tau_{\alpha})}}{R_{1b}}(e^{-R_1b(t-\delta )}-e^{-R_{1b}t})-e^{-(R_{1a}-\alpha)\tau_{a}}(e^{-\alpha(t-\delta)}-e^{-\alpha t})]\qquad (1)$$
$$\Delta M_{c}(t)=-\frac{2CBF\varepsilon M_{0}e^{-(R_{1a}-R_{1b})\tau_{a}} }{\lambda\alpha}(e^{-\alpha(t-\delta)}-e^{-\alpha t}) \qquad (2)$$
Where $$$\Delta M_{b}(t)$$$ and $$$\Delta M_{c}(t)$$$ are the signal in tissue and capillary compartments, respectively. CBF is cerebral blood flow, which is calculated from ASL data without diffusion preparation pulse5. $$$\varepsilon=0.8$$$ is tagging efficiency6. $$$M_0$$$ is proton density map. $$$\lambda = 0.9mL/g$$$ is the partition coefficient of water in the brain, $$$R_{1a} $$$ and $$$R_{1b} $$$ are longitudinal relaxation rate of blood and tissue, respectively6. We use $$$R_{1a}=0.6/s $$$ and $$$R_{1b} $$$ is acquired using FAST T1 mapping sequence. $$$\tau_a$$$ is arterial transit time and is set to 1.25s for healthy subjects2. $$$\delta = 1.5s$$$ is labeling time. PLD=1.8s is post labeling delay and $$$t=\delta + PLD$$$. $$$\alpha = k_w + R_{1a}$$$ and $$$\beta = \frac{k_w}{k_w+R_{1a}-R_{1b}}$$$ are model paramters. $$$\Delta M_{b}(t)$$$ and $$$\Delta M_{c}(t)$$$ are acquired with/without diffusion preparation pulses2: $$\Delta M_{b}(t)+\Delta M_{c}(t)=b_0 \qquad (3) $$ $$\Delta M_{b}(t)=b_{50} \qquad (4) $$
Where $$$b_0$$$ and $$$b_{50}$$$ are the ASL image acquired with a diffusion preparation pulse that b-value= 0 and 50, respectively. Combining the equations above, $$$b_0$$$ and $$$b_50$$$ can be expressed as function of kw: $$$b_0=f(k_w)$$$ and $$$b_{50}=g(k_w)$$$. We propose to solve kw by minimizing the following equations using the Levenberg–Marquardt algorithm: $$k_w=argmin_{k_w}[||b_{50}-g(k_w)||^2_2+||b_{0}-f(k_w)||^2_2+\lambda||\nabla k_w||^2_2] \qquad (5) $$ where λ = 0.05 is the weighting factor balancing data fidelity and L2 penalty function.
Data acquisition and processing:
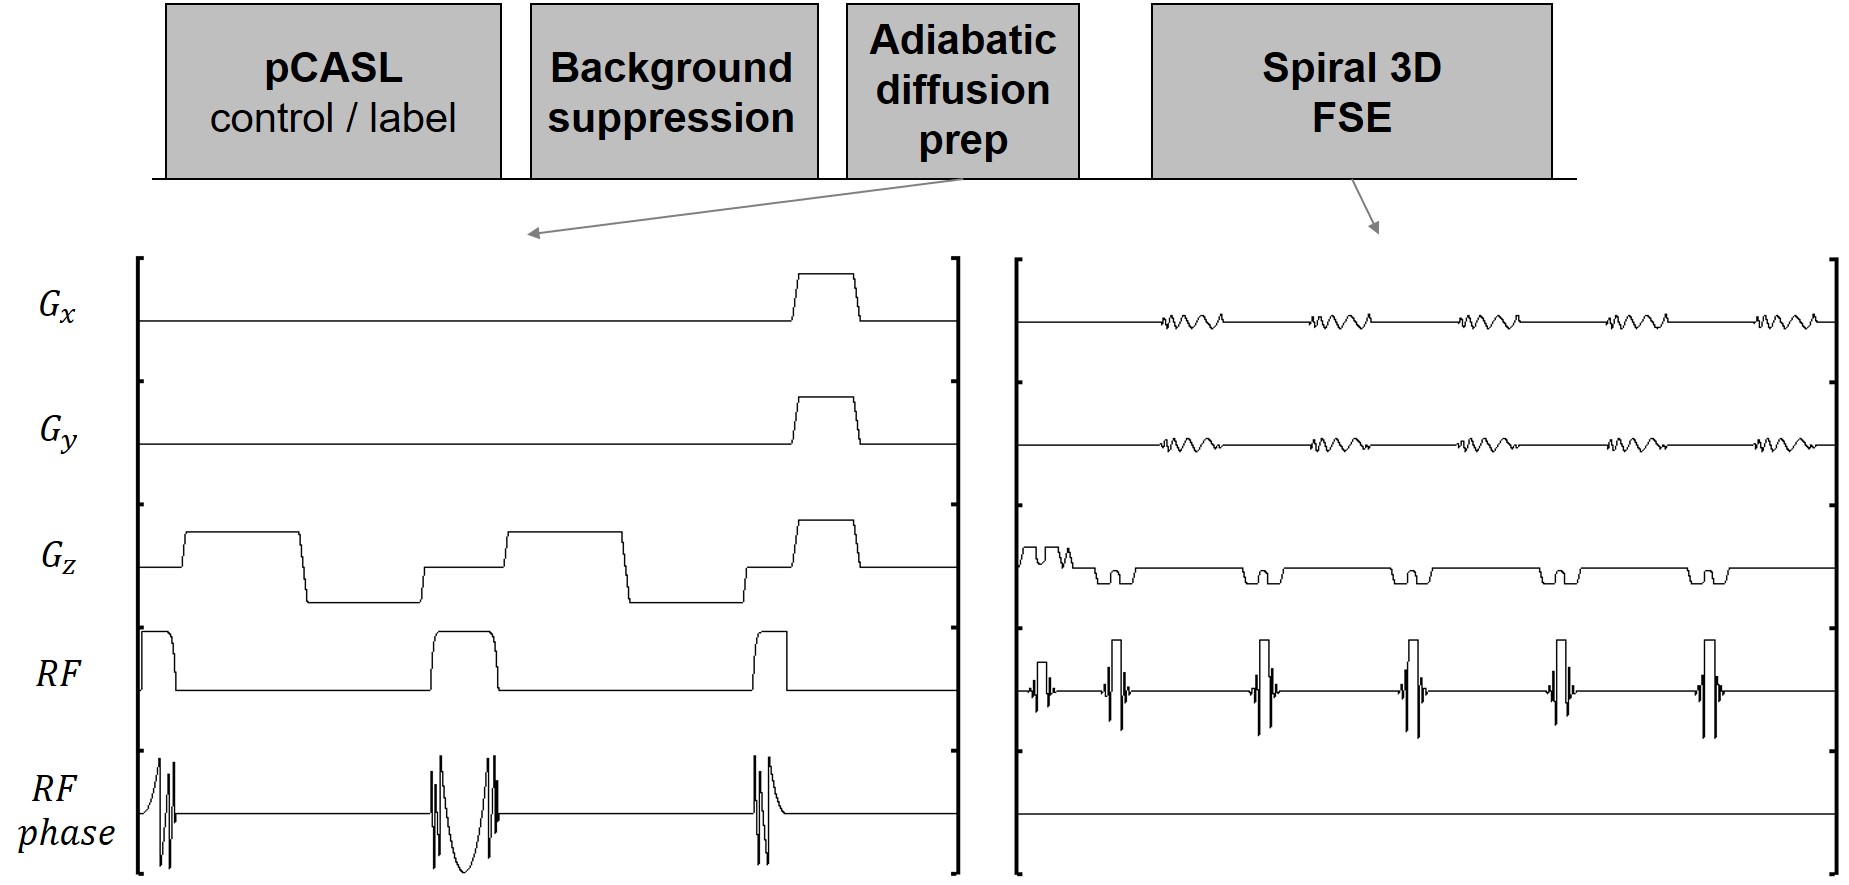
The existing acquisition approach for BBB permeability mapping is based on 3D Cartesian gradient and spin echo (GRASE) pulse sequence design and suffers from low spatial resolution (3.5x3.5x8 mm3) and limited brain coverage1. To translate water exchange rate mapping into routine clinical imaging practice, we have developed an SNR efficient 3D stacks-of-spiral fast spin echo (FSE) pulse sequence for whole brain coverage with robust BIR-4 adiabatic diffusion preparation that can achieve 1.8x1.8x4 mm3 resolution (8-fold improvement compared to GRASE approach) in 4 min, which is shown in figure 1.
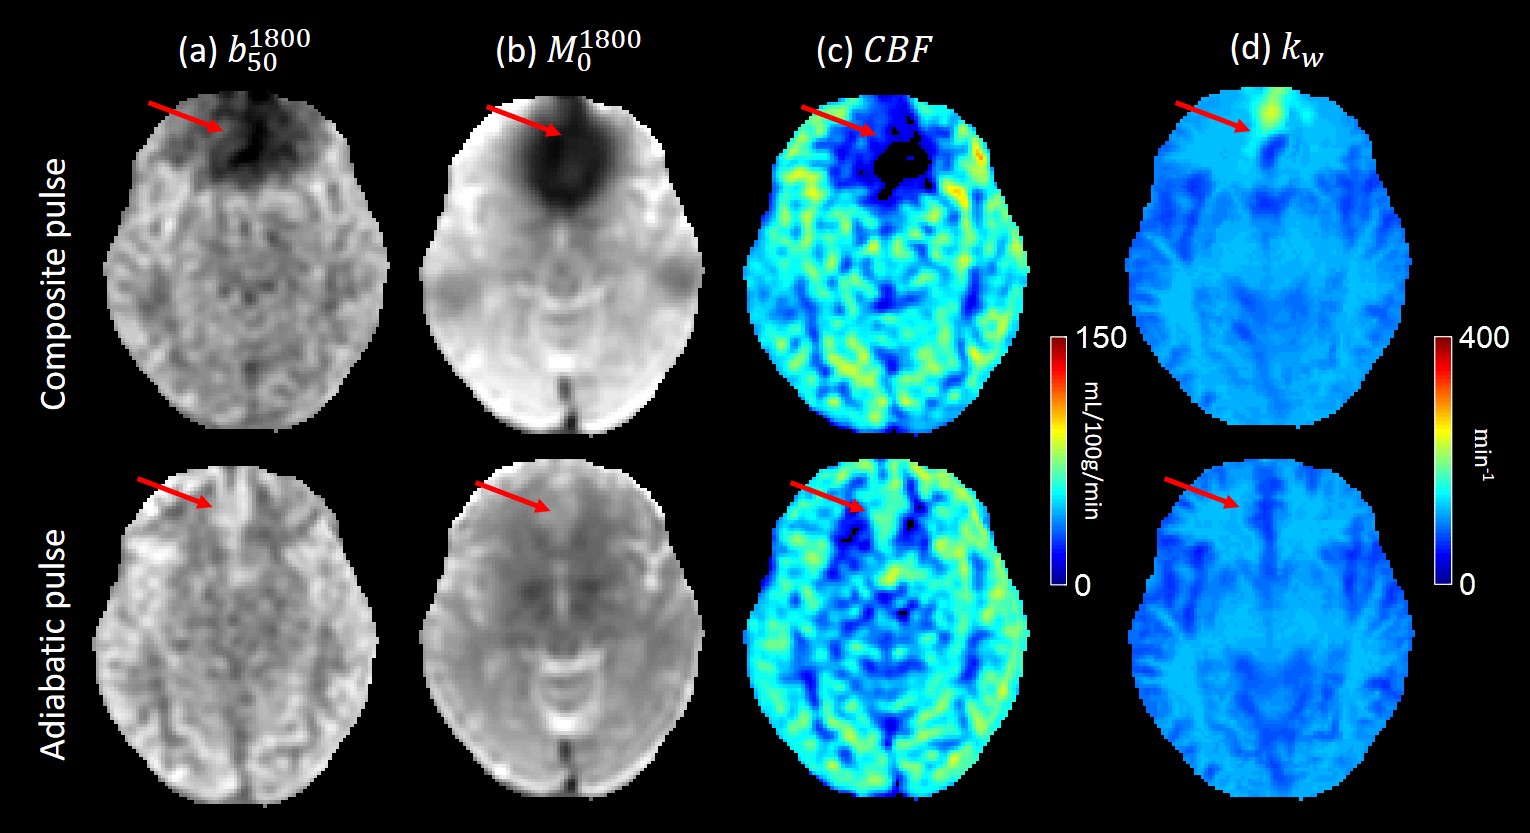
A symmetric nonselective bipolar gradient is applied along z axis to minimize eddy currents. Adiabatic RF pulses3 replace composite pulses to minimize artifacts at brain edge. A comparison of ASL data using these two RF pulses is shown in figure 2. A 3D fast spin echo readout is used to minimize acquisition time. 6 healthy subjects were scanned on a 3T GE scanner. Image parameters were: voxel size 1.875*1.875*4 mm3, field of view 24cm, number of slices 36. Duration of the four diffusion gradient lobes were 8.32ms and the amplitude was 3 gauss/cm resulting in b-value of 50. The kw map was generated using Eq.5 and its value in different anatomical regions is calculated using an AAL atlas7.
Results
The use of composite pulse led to a severe signal loss near the brain periphery in both b50 and M0 images, resulting in a low estimate of CBF and a high estimate of kw. kw maps of 3 healthy subjects are shown in Figure 3. In all six subjects, white matter showed significantly higher kw compared to gray matter, which is consistent with previous studies4. No obvious artifact was observed in the 6 subjects, suggesting the robustness of the sequence. Average kw measurements of all subjects in 8 ROIs related to Alzheimer’s disease are shown in table 1.Discussion and Conclusion
The image quality of water exchange rate mapping based on ASL was substantially improved by the use of adiabatic RF pulses, 3D fast spin echo readout and a direct fit of kw to blood/tissue compartment signal equations. The measured kw values in healthy subjects were similar to those measured in previous work2. However, image resolution and quality was significantly improved while keeping scanning time the same. However, in our current method arterial transit time (ATT) was assumed to be constant. This assumption may not hold on AD patients. In previous work2, ATT was calculated independently requiring 2 more sequences. Thus, further work will include solving ATT and kw at the same time with minimum scan time increase.Acknowledgements
References
1. Daneman R, Prat A. The blood–brain barrier. Cold Spring Harb Perspect Biol. 2015;7: a020412.
2. Shao X, Ma S J, Casey M, et al. Mapping water exchange across the blood–brain barrier using 3D diffusion‐prepared arterial spin labeled perfusion MRI[J]. Magnetic resonance in medicine, 2019, 81(5): 3065-3079.
3. Nguyen T D, de Rochefort L, Spincemaille P, et al. Effective motion‐sensitizing magnetization preparation for black blood magnetic resonance imaging of the heart[J]. Journal of Magnetic Resonance Imaging: An Official Journal of the International Society for Magnetic Resonance in Medicine, 2008, 28(5): 1092-1100.
4. St. Lawrence K S, Owen D, Wang D J J. A two‐stage approach for measuring vascular water exchange and arterial transit time by diffusion‐weighted perfusion MRI[J]. Magnetic resonance in medicine, 2012, 67(5): 1275-1284. 5. Buxton R B. Quantifying CBF with arterial spin labeling[J]. Journal of Magnetic Resonance Imaging: An Official Journal of the International Society for Magnetic Resonance in Medicine, 2005, 22(6): 723-726. 6. Lu H, Clingman C, Golay X, van Zijl PC. Determining the longitudinal relaxation time (T1) of blood at 3.0 Tesla. Magn Reson Med. 2004;52:679–682.
5. Buxton R B. Quantifying CBF with arterial spin labeling[J]. Journal of Magnetic Resonance Imaging: An Official Journal of the International Society for Magnetic Resonance in Medicine, 2005, 22(6): 723-726.
6. Lu H, Clingman C, Golay X, van Zijl PC. Determining the longitudinal relaxation time (T1) of blood at 3.0 Tesla. Magn Reson Med. 2004;52:679–682.
7. Automated Anatomical Labeling of Activations in SPM Using a Macroscopic Anatomical Parcellation of the MNI MRI Single-Subject Brain. N. Tzourio-Mazoyer, B. Landeau, D. Papathanassiou, F. Crivello, O. Étard, N. Delcroix, B. Mazoyer, and M. Joliot. NeuroImage 2002, 15 :273-289
Figures