0032
Assessing Repeatability of Blood Brain Barrier Permeability Measure Using Contrast-free MRI
Amnah Mahroo1, Nora-Josefin Breutigam1, and Matthias Günther1,2
1MR Physics, Fraunhofer Institute for Digital Medicine MEVIS, Bremen, Germany, 2MR-Imaging and Spectroscopy, University of Bremen, Bremen, Germany
1MR Physics, Fraunhofer Institute for Digital Medicine MEVIS, Bremen, Germany, 2MR-Imaging and Spectroscopy, University of Bremen, Bremen, Germany
Synopsis
Disrupted blood brain barrier (BBB) is reported to be one of the causes in various neuropathological diseases1. We assessed the quantified permeability of BBB using blood to tissue water exchange dynamics by employing multi-echo ASL sequence in five healthy individuals. A repeated measurement was conducted to assess the robustness and precision of the method. The average gray matter values were 357 ± 62 ms which are in-accordance with the literature reported values.
Purpose
To evaluate the feasibility and precision of the blood to brain tissue water transfer dynamics as a surrogate biomarker of blood brain barrier permeability using contrast-free MRI.Introduction
The blood brain barrier is a dynamic structure that regulates and maintains the microenvironment in the brain1. Interest in assessment of the functionality and integrity of BBB using MRI is increasing, but measuring BBB permeability in humans is not straight forward2. The use of dynamic contrast enhanced MRI shows promising results but increasing concerns3 about deposition of gadolinium-based contrast agents in the brain suggest that a contrast-free MRI approach should be developed and explored. Arterial Spin Labeling (ASL) is a non-invasive, contrast-free MRI method that uses the spins in the blood as a tracer for measuring 4. 3T, the transverse relaxation (T2) of the labeled spins differs significantly between blood and brain tissue5, which can be used to estimate the exchange dynamics (T_exch) of the spins when moving across the BBB6. In this abstract, we employed a multi-echo (multi-TE) ASL sequence to harness this property of the spins. To determine the feasibility of this approach, we acquired data from five healthy subjects. In addition, we tested the precision of this method by repeated measurement. In order to address the high variability of arterial transit times (ATT), especially in potential patients, we have chosen a Free Lunch approach with long inflow time (TI).Methods
ImagingFive healthy volunteers (ages 21-30 years, 2 females) were examined at 3T (MAGNETOM Skyra, SIEMENS Healthineers AG). A multi-TE Hadamard pseudo-continuous (pCASL) sequence with 3D-GRASE readout was used. Two FOCI pulses (2*T1) were used for background suppression. All measurements were acquired with a matrix size of 64x128x16 and voxel size of 3.1x3.1x4.0 mm. A Hadamard-8 matrix with a sub-bolus duration of 400 ms, Free Lunch bolus of 1800 ms and a post-labeling delay (PLD) of 200 ms was used for the pCASL acquisitions. The resulting seven TIs were 600 ms, 1000 ms, 1400 ms, 1800 ms, 2200 ms, 2400 ms and 4400 ms. Every TI was acquired at six different echo times (TE) (12.9 ms, 38.8 ms, 64.7 ms, 90.5 ms, 116.4 ms and 143.2 ms). M0 image was acquired to quantify the perfusion values (TE: 12.94, TR: 5.5 s). A repeated measurement after five minutes in the same session was acquired to evaluate the repeatability and precision of the imaging protocol.
Post-Processing
The two-compartment multi-TE ASL model as described by Gregori6 was incorporated in FMRIB Software Library (FSL) v6.0.1 FABBER framework8. The Hadamard encoded labeled and control images were motion corrected and registered to M0 image using SPM 129. The images were decoded and a single echo dataset (TE = 12.9 ms) with seven TIs was extracted from the multi-TE data to analyze quantified perfusion and ATT maps using the Buxton model in FSL BASIL8. The voxel-wise T_exch parameter was estimated using non-linear fitting tool FABBER in FSL from the multi-TE dataset. The T_exch maps were registered to structural image and gray and white matter masks were applied to estimate the subject-specific mean T_exch values. The second measurement was used to test the robustness and repeatability of the measure. Finally, the T_exch maps were registered to MNI 152 standard space to compare the pattern of T_exch maps across the subjects. The averaged T_exch map was created by averaging the two measurement from all subjects.
Results
Figure 1 shows a multi-TE ASL dataset from one single subject as an example. The single TE dataset generated reliable perfusion and ATT values as shown in Table 1 and 2. The estimated ‘T_exch’ parameter yielded an averaged gray matter value of 363 ± 53 ms and 351 ± 76 ms from the first and second measurement, respectively. There are no significant differences between the T_exch values in two measurements (p=0.79). Figure 2 shows T_exch maps from the two measurements for all five subjects. Table 1 and 2 present calibrated perfusion, ATT and T_exch parameter values from the two measurements. Figure 3 displays the standard MNI-152 T1 image, averaged T_exch map and normalized difference of T_exch map from the two measurements.Discussion and Conclusion
The aim of this pilot study was to optimize the contrast-free MRI method which can provide repeatable and quantified BBB permeability maps. The mean T_exch value for gray matter was 357 ± 62 ms, averaged across all subjects and their repeated measurements. This value is in the same range as reported in the literature6. The results show that the T_exch measure across the five subjects was consistent with acceptable deviations, demonstrating the feasibility of the method. The good repeatability of the technique is also reflected in the repeated measurement (Table 1 and Table 2). Since, it is not known before the measurement whether a patient has prolonged ATT, our results show that the selected long TI can provide feasible T_exch maps in healthy subjects. However, further research is needed to validate the T_exch values and to compare them with the gold standard PET brain permeability values. Furthermore, the practicality and reliability of this method has to be assessed in a clinical environment by testing this method on patients with impaired BBB.Acknowledgements
This project has received funding from the European Union’s Horizon 2020 research and innovation programme under the Marie Sklodowska-Curie grant agreement No 765148References
- Thrippleton, M.J., et al., Quantifying blood-brain barrier leakage in small vessel disease: Review and consensus recommendations. Alzheimers Dement, 2019. 15(6): p. 840-858.
- Varatharaj, A., et al., Blood-brain barrier permeability measured using dynamic contrast-enhanced magnetic resonance imaging: a validation study. Journal of Physiology-London, 2019. 597(3): p. 699-709.
- Gulani V, et al., Gadolinium deposition in the brain: summary of evidence and recommendations. The Lancet Neurology. 2017 Jul 1;16(7):564-70.
- Koretsky A. P. Early development of arterial spin labeling to measure regional brain blood flow by MRI. Neuroimage. 2012 Aug 15;62(2):602-7.
- Wells A., Siow B., Lythgoe F. and Thomas L. Measuring biexponential transverse relaxation of the ASL signal at 9.4 T to estimate arterial oxygen saturation and the time of exchange of labeled blood water into cortical brain tissue. Journal of Cerebral Blood Flow & Metabolism. 2013 Feb;33(2):215-24.
- Gregori J., Schuff N., Kern R. and Günther M., T2‐based arterial spin labeling measurements of blood to tissue water transfer in human brain. Journal of Magnetic Resonance Imaging. 2013 Feb;37(2):332-42.
- Buxton R.B., et al., A general kinetic model for quantitative perfusion imaging with arterial spin labeling. Magnetic resonance in medicine. 1998 Sep;40(3):383-96.
- Chappell M. A., Groves A. R., Whitcher B. and Woolrich M. W. Variational Bayesian inference for a non-linear forward model. IEEE Transactions on Signal Processing 2009 57(1):223-236.
- Penny W. D. , et al., editors. Statistical parametric mapping: the analysis of functional brain images. Elsevier; 2011 Apr 28.
Figures

Figure 1: Single (middle) slice ASL
maps of a single subject. Along the TI axes, the effect of T1 relaxation can be
seen, also the signal evolves and diffuses in the brain due to inflow of the
labeled spin. The T2 relaxation occurs along the TE axes.

Figure 2:
T_exch maps registered to standard MNI-152 (2mm) space for comparison across the five
subjects and their respective repeated measurements.
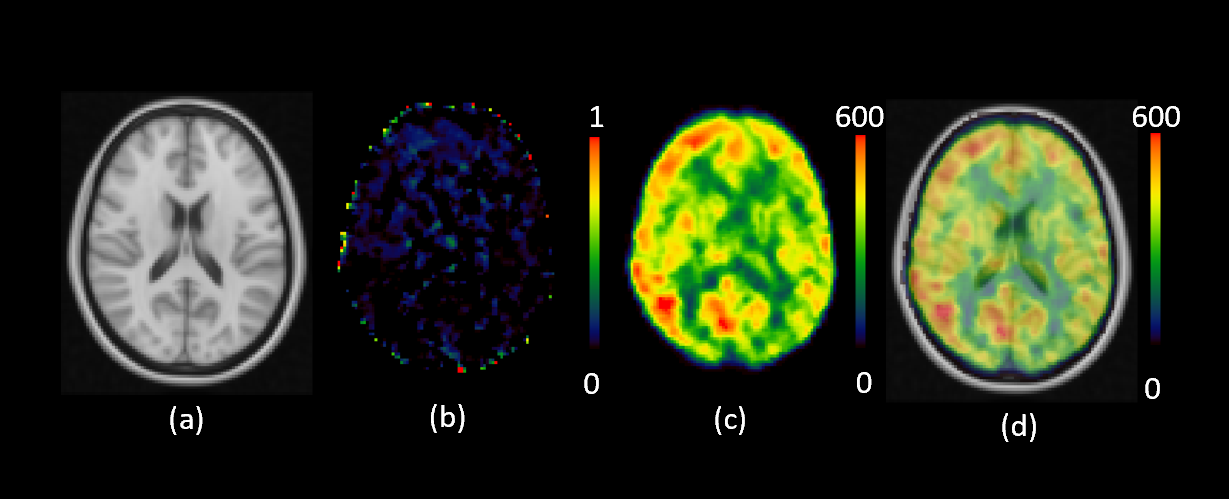
Figure 3:
Averaged T_exch Map registered to MNI Standard Space. (a) shows the standard
MNI-152 T1 Brain (2mm). (b) shows normalized difference of T_exch from
measurement 1 and 2. (c) shows the averaged T_exch map generated by taking mean
across all subjects and their repetitions. (d) The averaged T_exch map overlaid
on the standard MNI-152 T1 image.
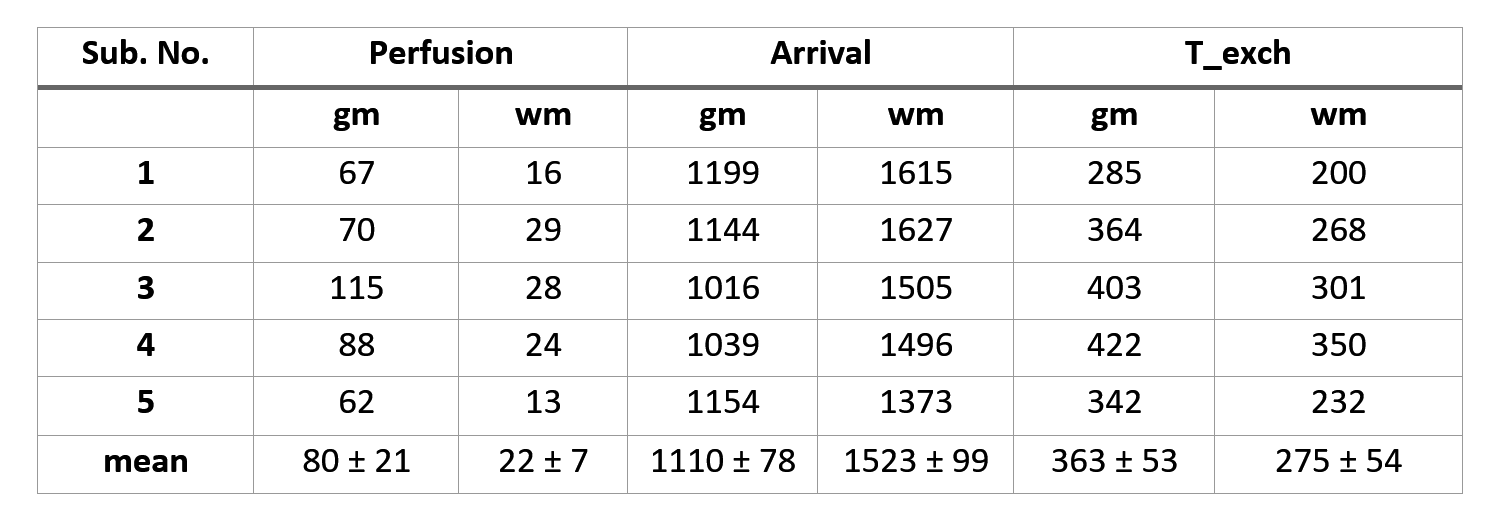
Table 1: Quantified Perfusion (ml/100gm/min), arrival time
(ms) and T_exch (ms) values for all five subjects from measurement 1. (gm =
gray matter, wm = white matter)
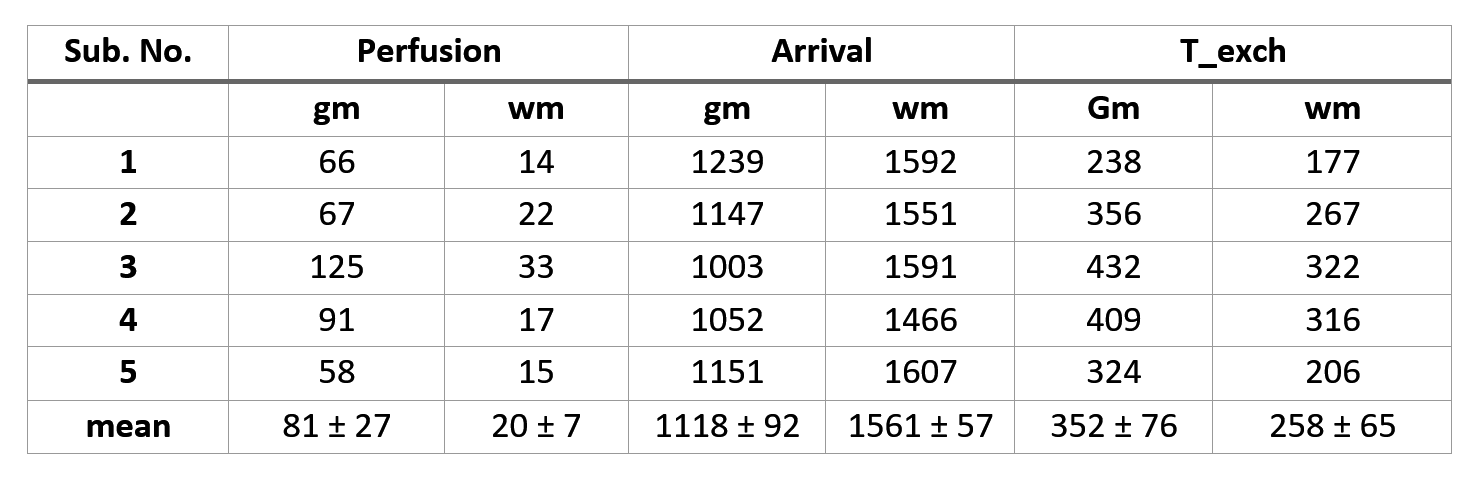
Table 2:
Quantified Perfusion (ml/100gm/min), arrival time (ms) and T_exch (ms) values
for all five subjects from measurement 2. (gm = gray matter, wm = white matter)