0030
Calibration of patient-specific computational models of cerebral blood flow in cerebrovascular disease using arterial spin labeling1Biomedical Engineering, University of Michigan, Ann Arbor, MI, United States, 2fMRI Laboratory, University of Michigan, Ann Arbor, MI, United States, 3Surgery, University of Michigan, Ann Arbor, MI, United States
Synopsis
Collateral flow patterns in the circle of Willis play a major role in maintaining adequate blood supply to the brain in the presence of cerebrovascular occlusive disease. In this work, we present a strategy to quantify collateral flow by calibrating patient-specific computational fluid dynamic models of cerebral blood flow with perfusion data from arterial spin labeling. For a patient with right carotid stenosis, the collateral flow patterns in the circle of Willis obtained with the calibrated computational model show good agreement with territorial perfusion maps acquired with vessel-selective arterial spin labeling.
Introduction
In the presence of cerebrovascular occlusive disease, adequate blood supply to the brain relies on a network of collateral pathways through the circle of Willis (CoW) and a change in distal vascular resistance through cerebral autoregulation. Considering the high anatomical variability of the CoW, there is a need to quantify the vasculature’s capability to compensate for a flow reduction due to stenosis to make predictions about vascular deficits and/or assist surgical planning. In vessel-selective pseudo-continuous arterial spin labeling (VS-PCASL), individual arteries are magnetically labeled to measure the perfusion territory in the brain. While VS-PCASL provides detailed territorial information about the blood supply at the tissue level, a quantitative description of flow in the large arteries supplying the brain remains unavailable. In contrast, 4D MRI Flow can provide quantitative information on flow in large arteries but intracranial applications have been limited by the spatial resolution necessary to accurately capture the flow in the small cerebral arteries. Patient-specific computational fluid dynamic (CFD) models of blood flow have been widely used to calculate flow and pressure in the cardiovascular system. Some of the advantages of CFD over imaging include spatial and temporal resolution as well as the ability to predict changes in hemodynamics following surgical procedures. However, previous approaches of modeling patient-specific cerebral blood flow have heavily relied on literature-based assumptions about the flow distribution in the CoW1, limiting their applicability for clinical use. In this work, we present a strategy to quantify collateral flow in the CoW by combining arterial spin labeling perfusion imaging with CFD. The CFD model is calibrated using imaging data of global brain perfusion (non-selective PCASL), anatomy, and flow to match patient-specific hemodynamics. The simulated collateral flow is validated against VS-PCASL using Lagrangian particle tracking.Methods
MRI protocol:Non-selective cardiac-triggered PCASL images are acquired in a volume covering the entire brain cortex. A pre-scan is performed to compensate for off-resonance in the label plane. Additionally, VS-PCASL images are acquired for all four main brain-supplying arteries using Super-selective PCASL2,3. The anatomy of the large arteries in the neck and head is collected with a 3D TOF and combined with the anatomy of the aortic arch, which is acquired with a T1-weighted SPGR. Flow measurements at the levels of the ascending aorta, supra aortic vessels, and carotid bifurcation are acquired with phase-contrast MRI.
Computational Modeling:
Computational modeling is performed using the in-house software CRIMSON (www.crimson.software), an advanced modeling environment for patient-specific hemodynamic analysis. The large arteries are reconstructed based on the anatomical data. Each vessel outflow is coupled with a 3-element Windkessel model to represent the distal vascular bed. The inflow at the ascending aorta is prescribed based on the measured flow.
Calibration:
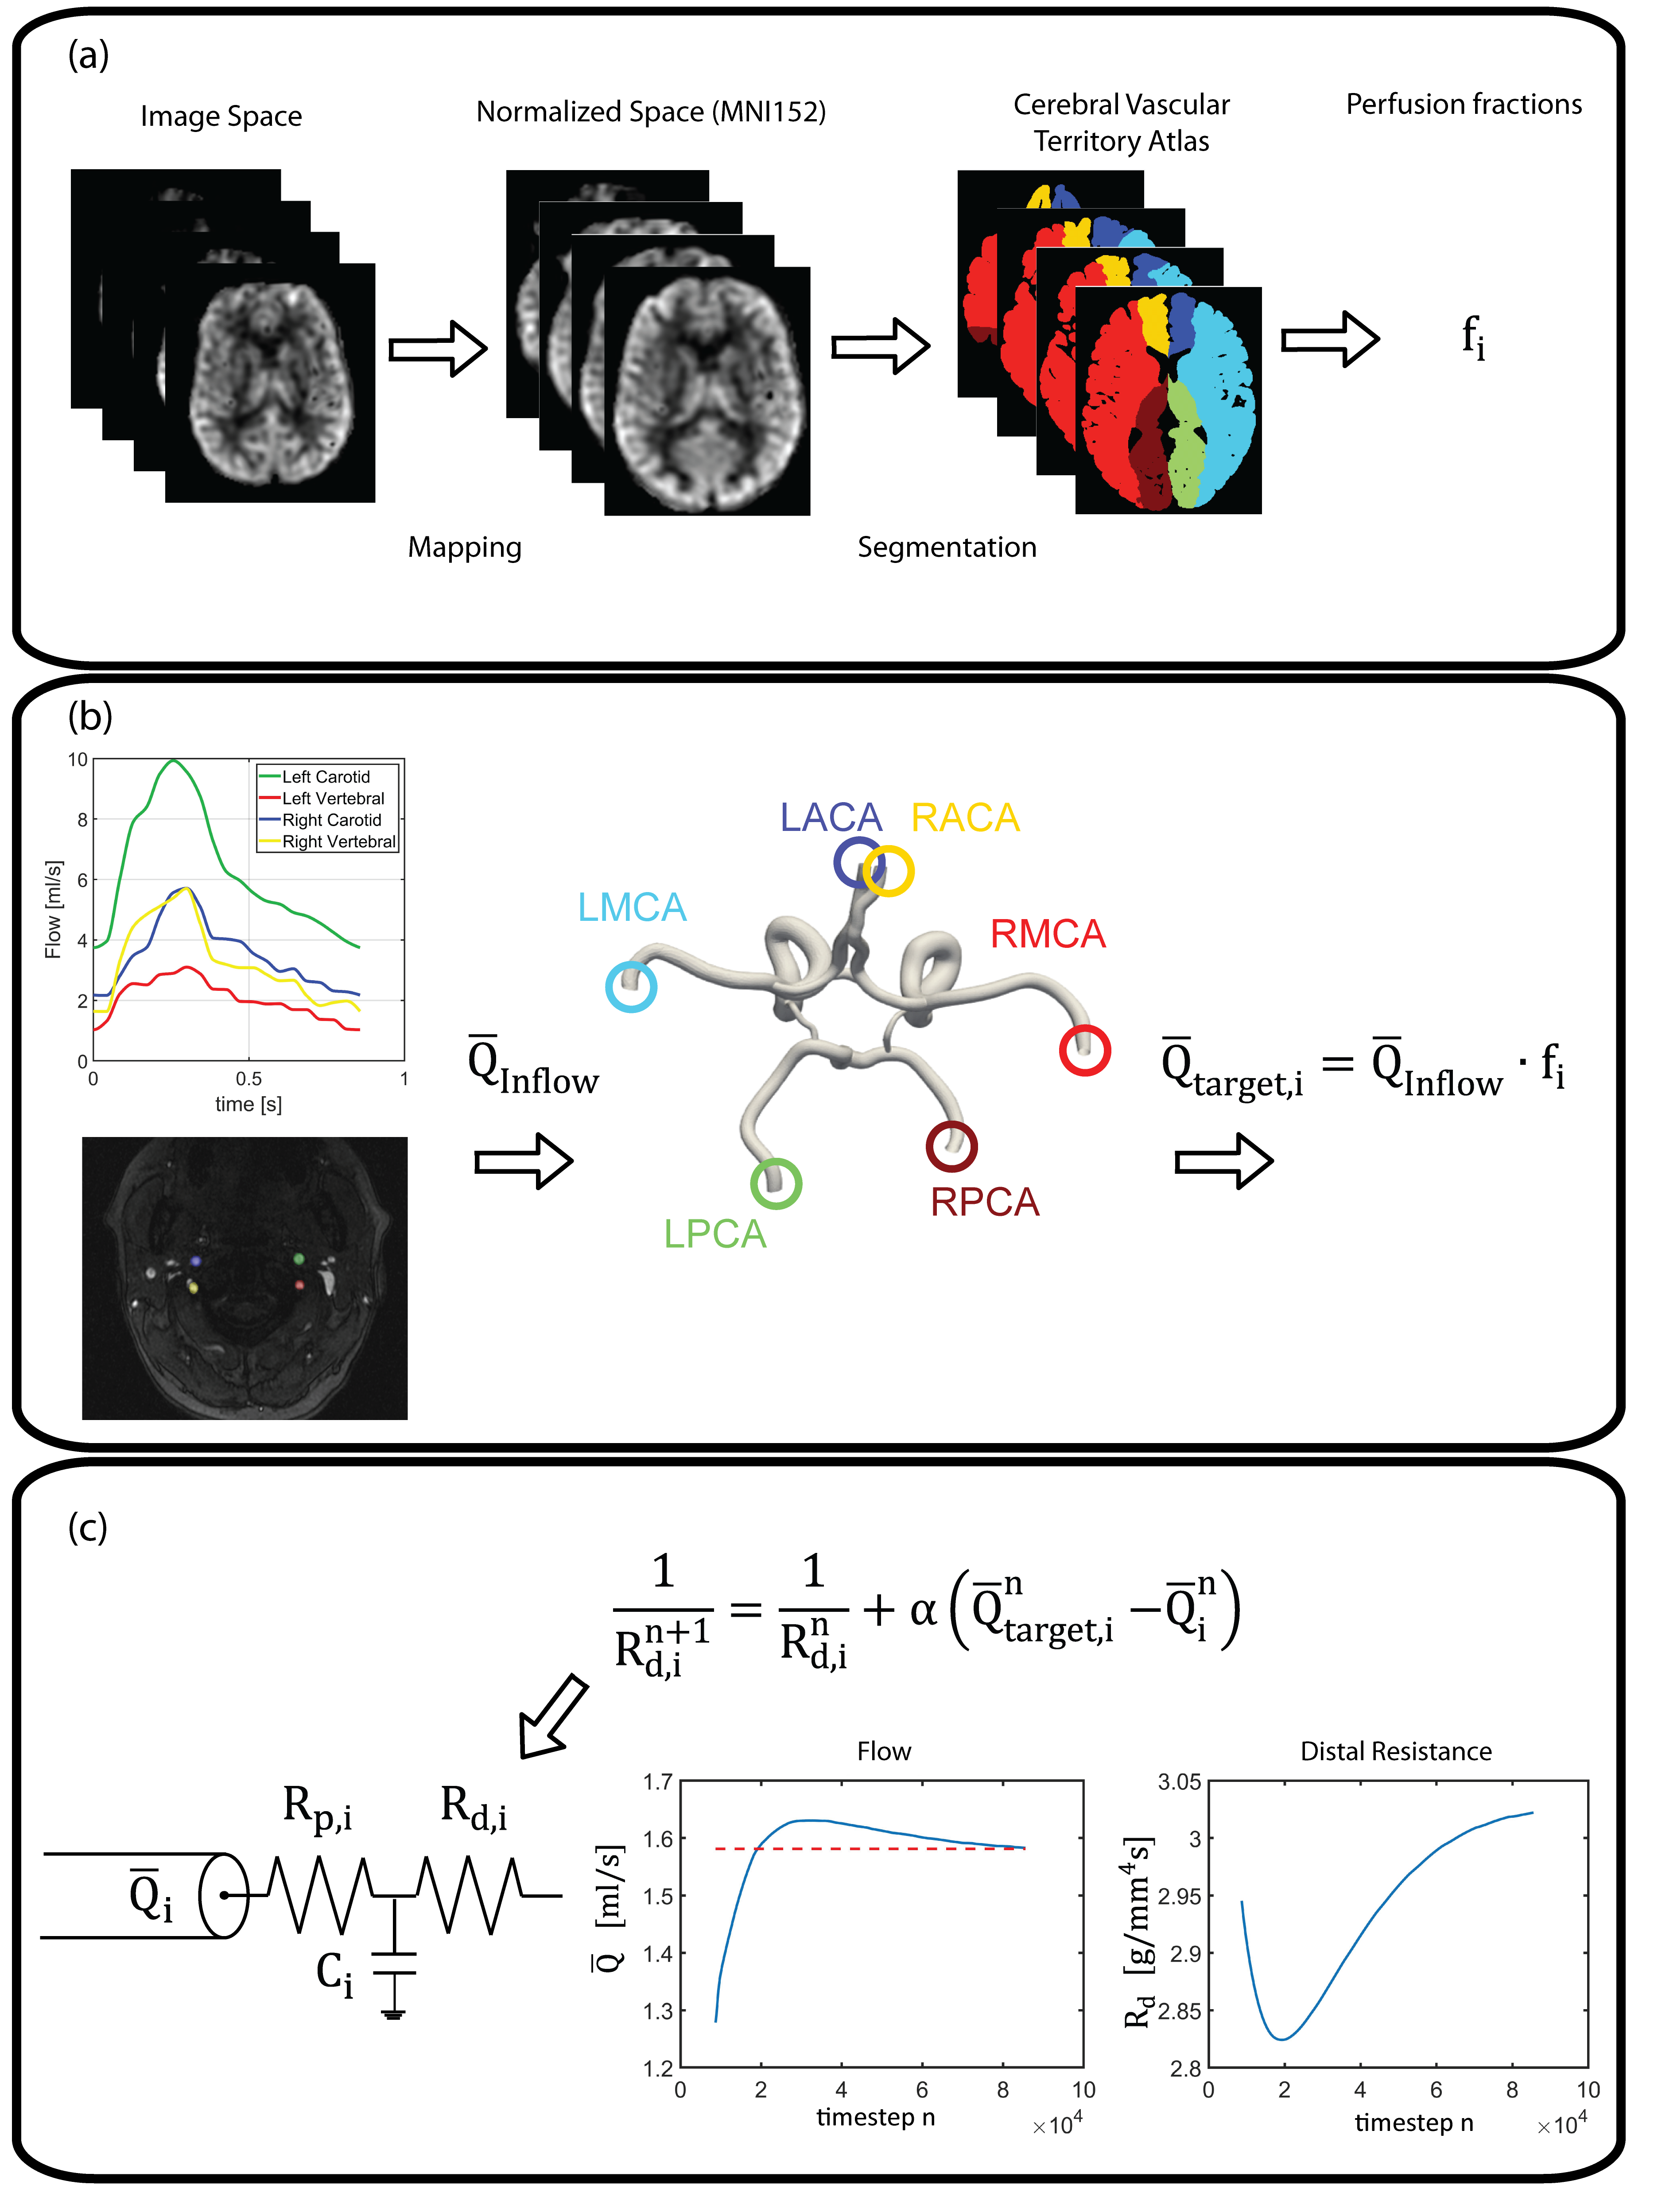
The parameters of each outflow Windkessel model are calibrated based on the non-selective PCASL images. The workflow is illustrated in Figure 1 and entails the following steps: (a) Segmentation of the cerebral perfusion territories and calculation of the perfusion fraction of each territory to the total volume of the cortex. (b) Calculation the cardiac-averaged target flow splits in the CoW. (c) Tuning of the distal resistance in each Windkessel model during the simulation to match target flow splits.
Validation:
Collateral flow from CFD is validated against territorial perfusion maps acquired with VS-PCASL. Lagrangian particles are seeded in the neck arteries, transported based on the pulsatile velocity field, and counted at each outlet.
Results
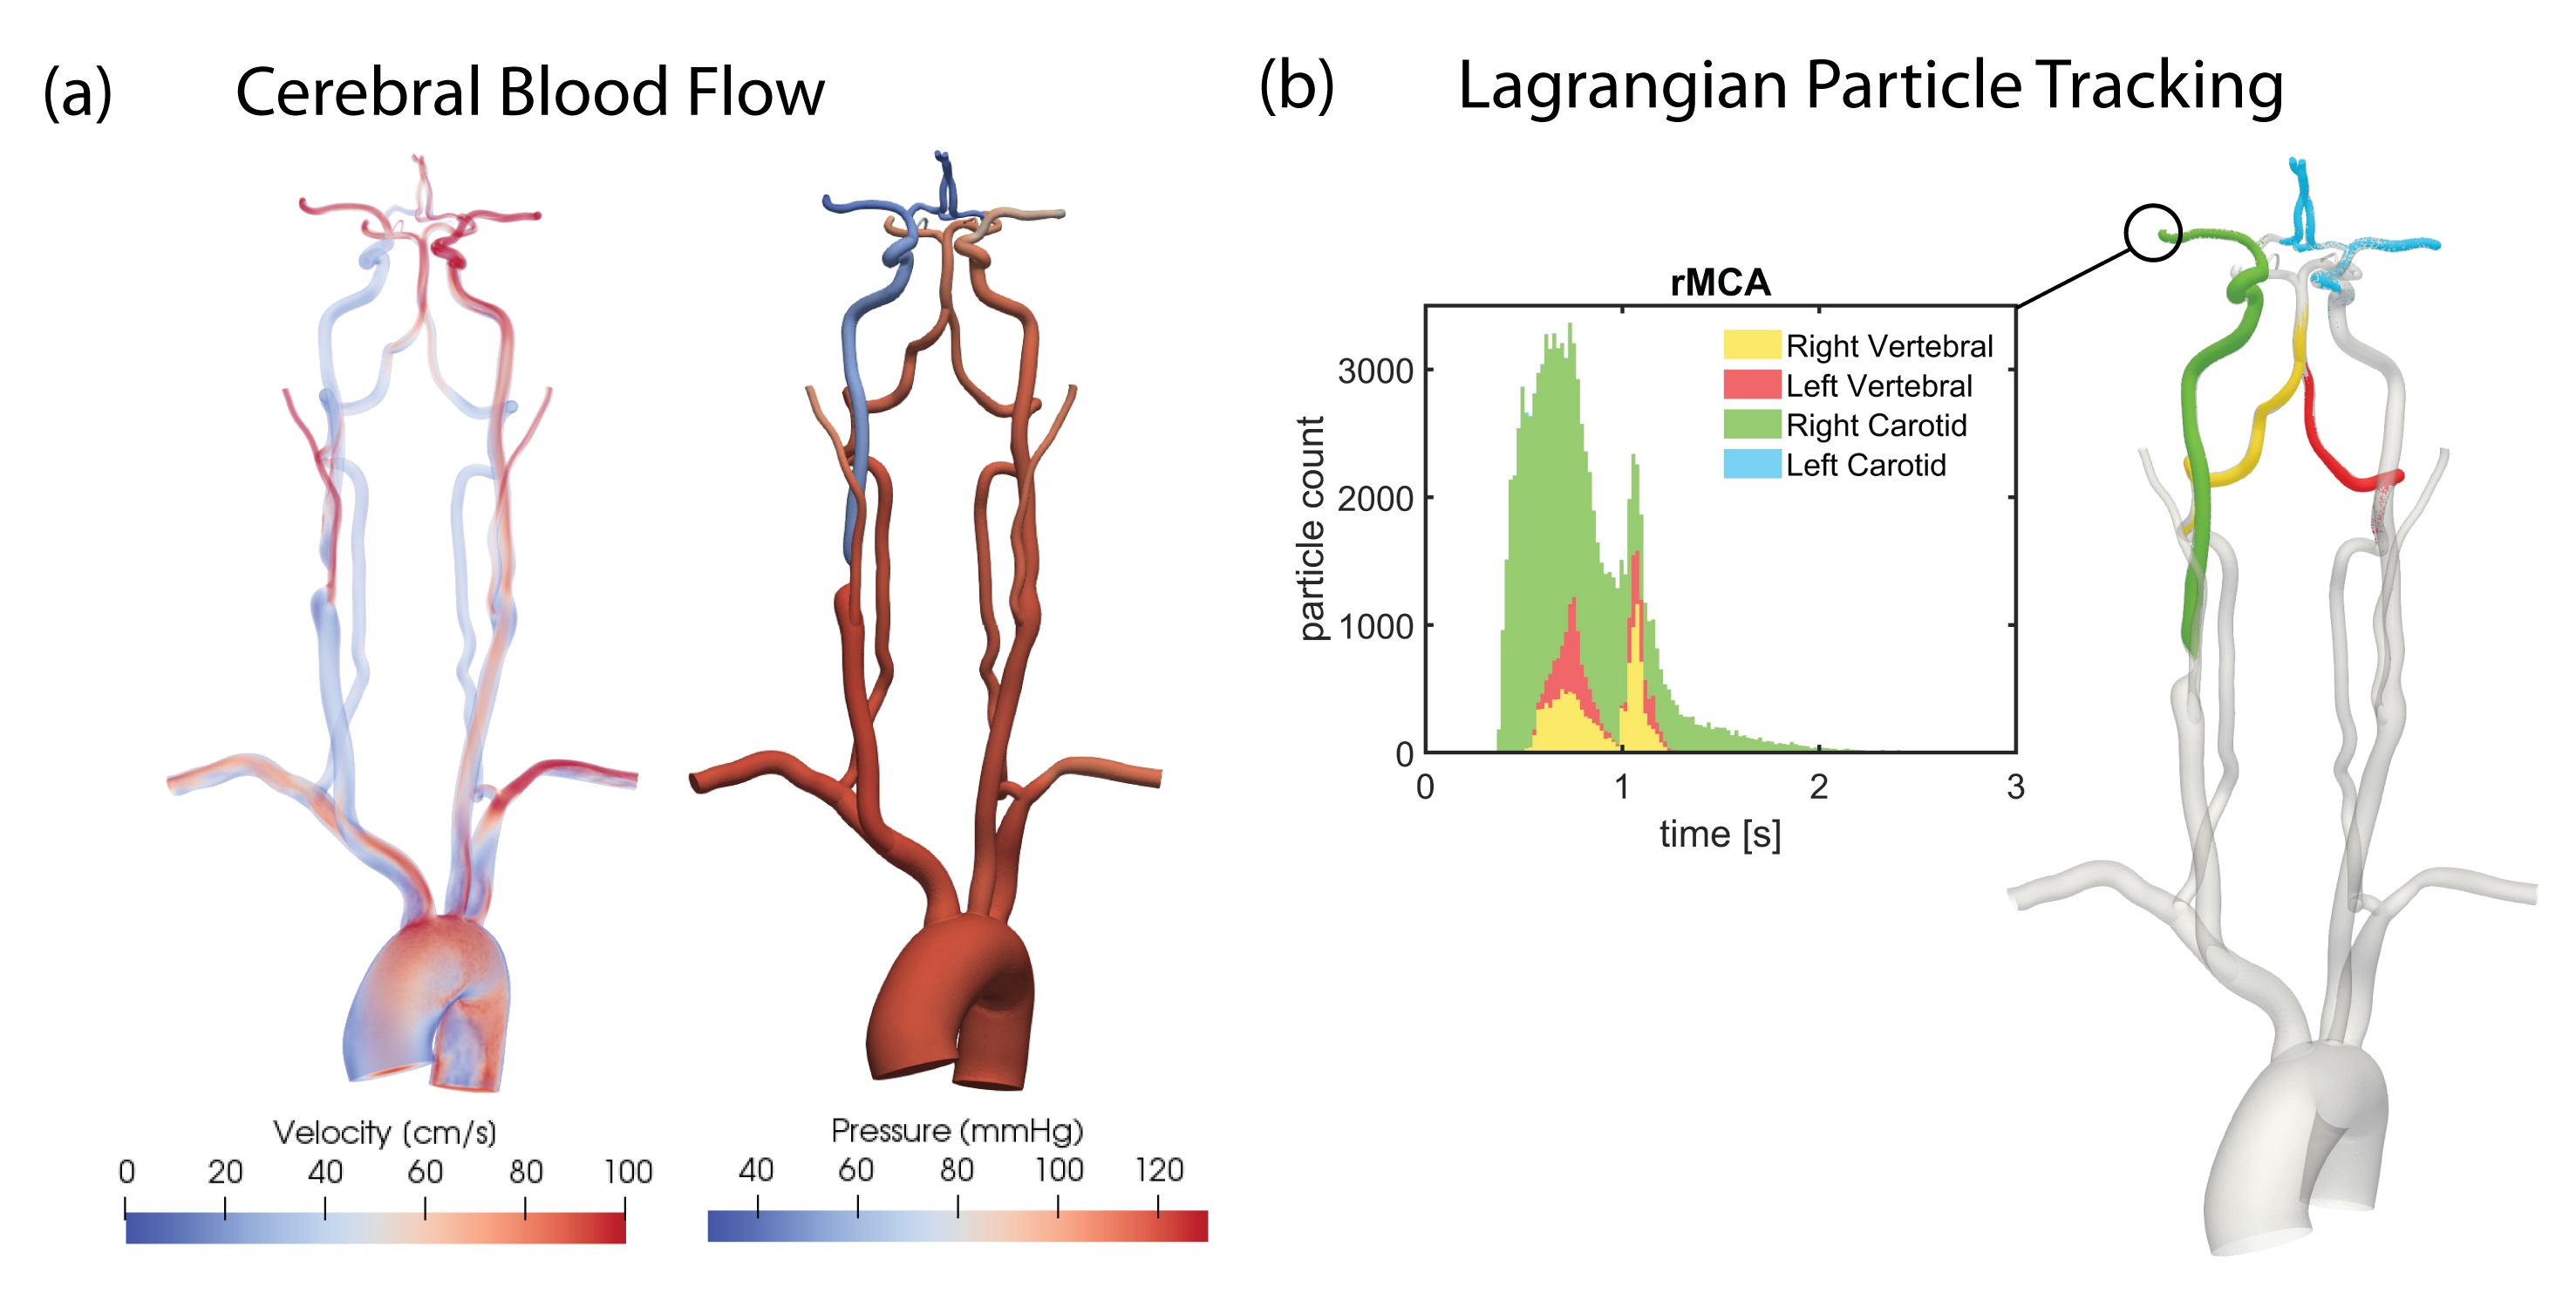
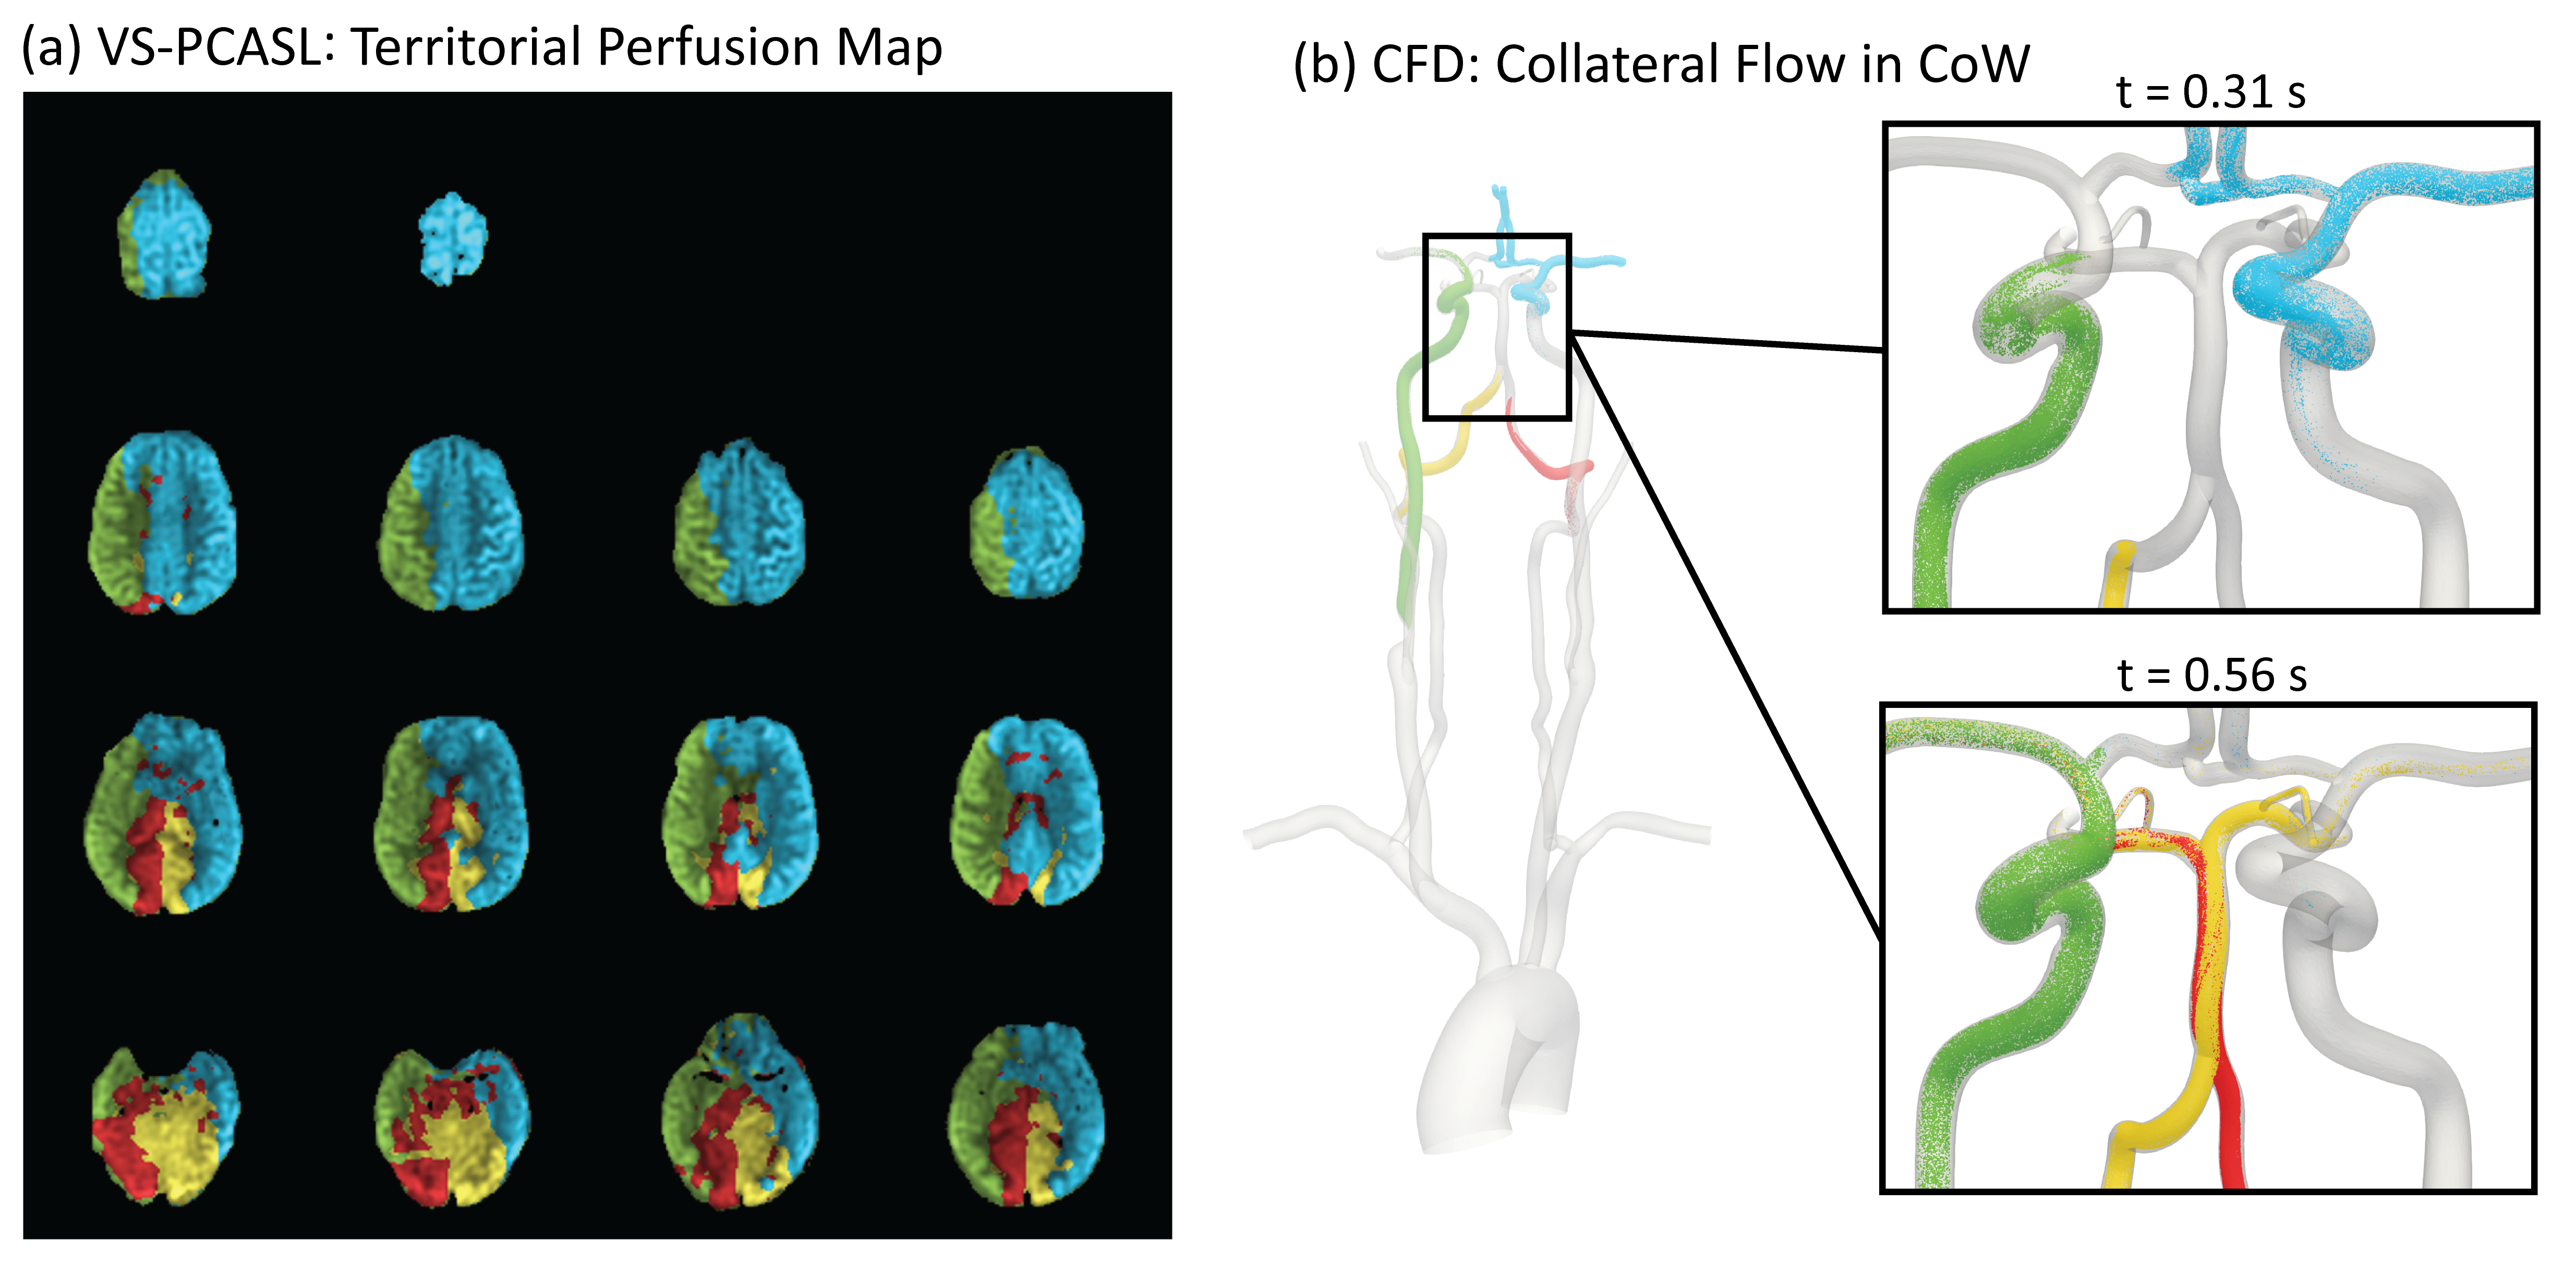
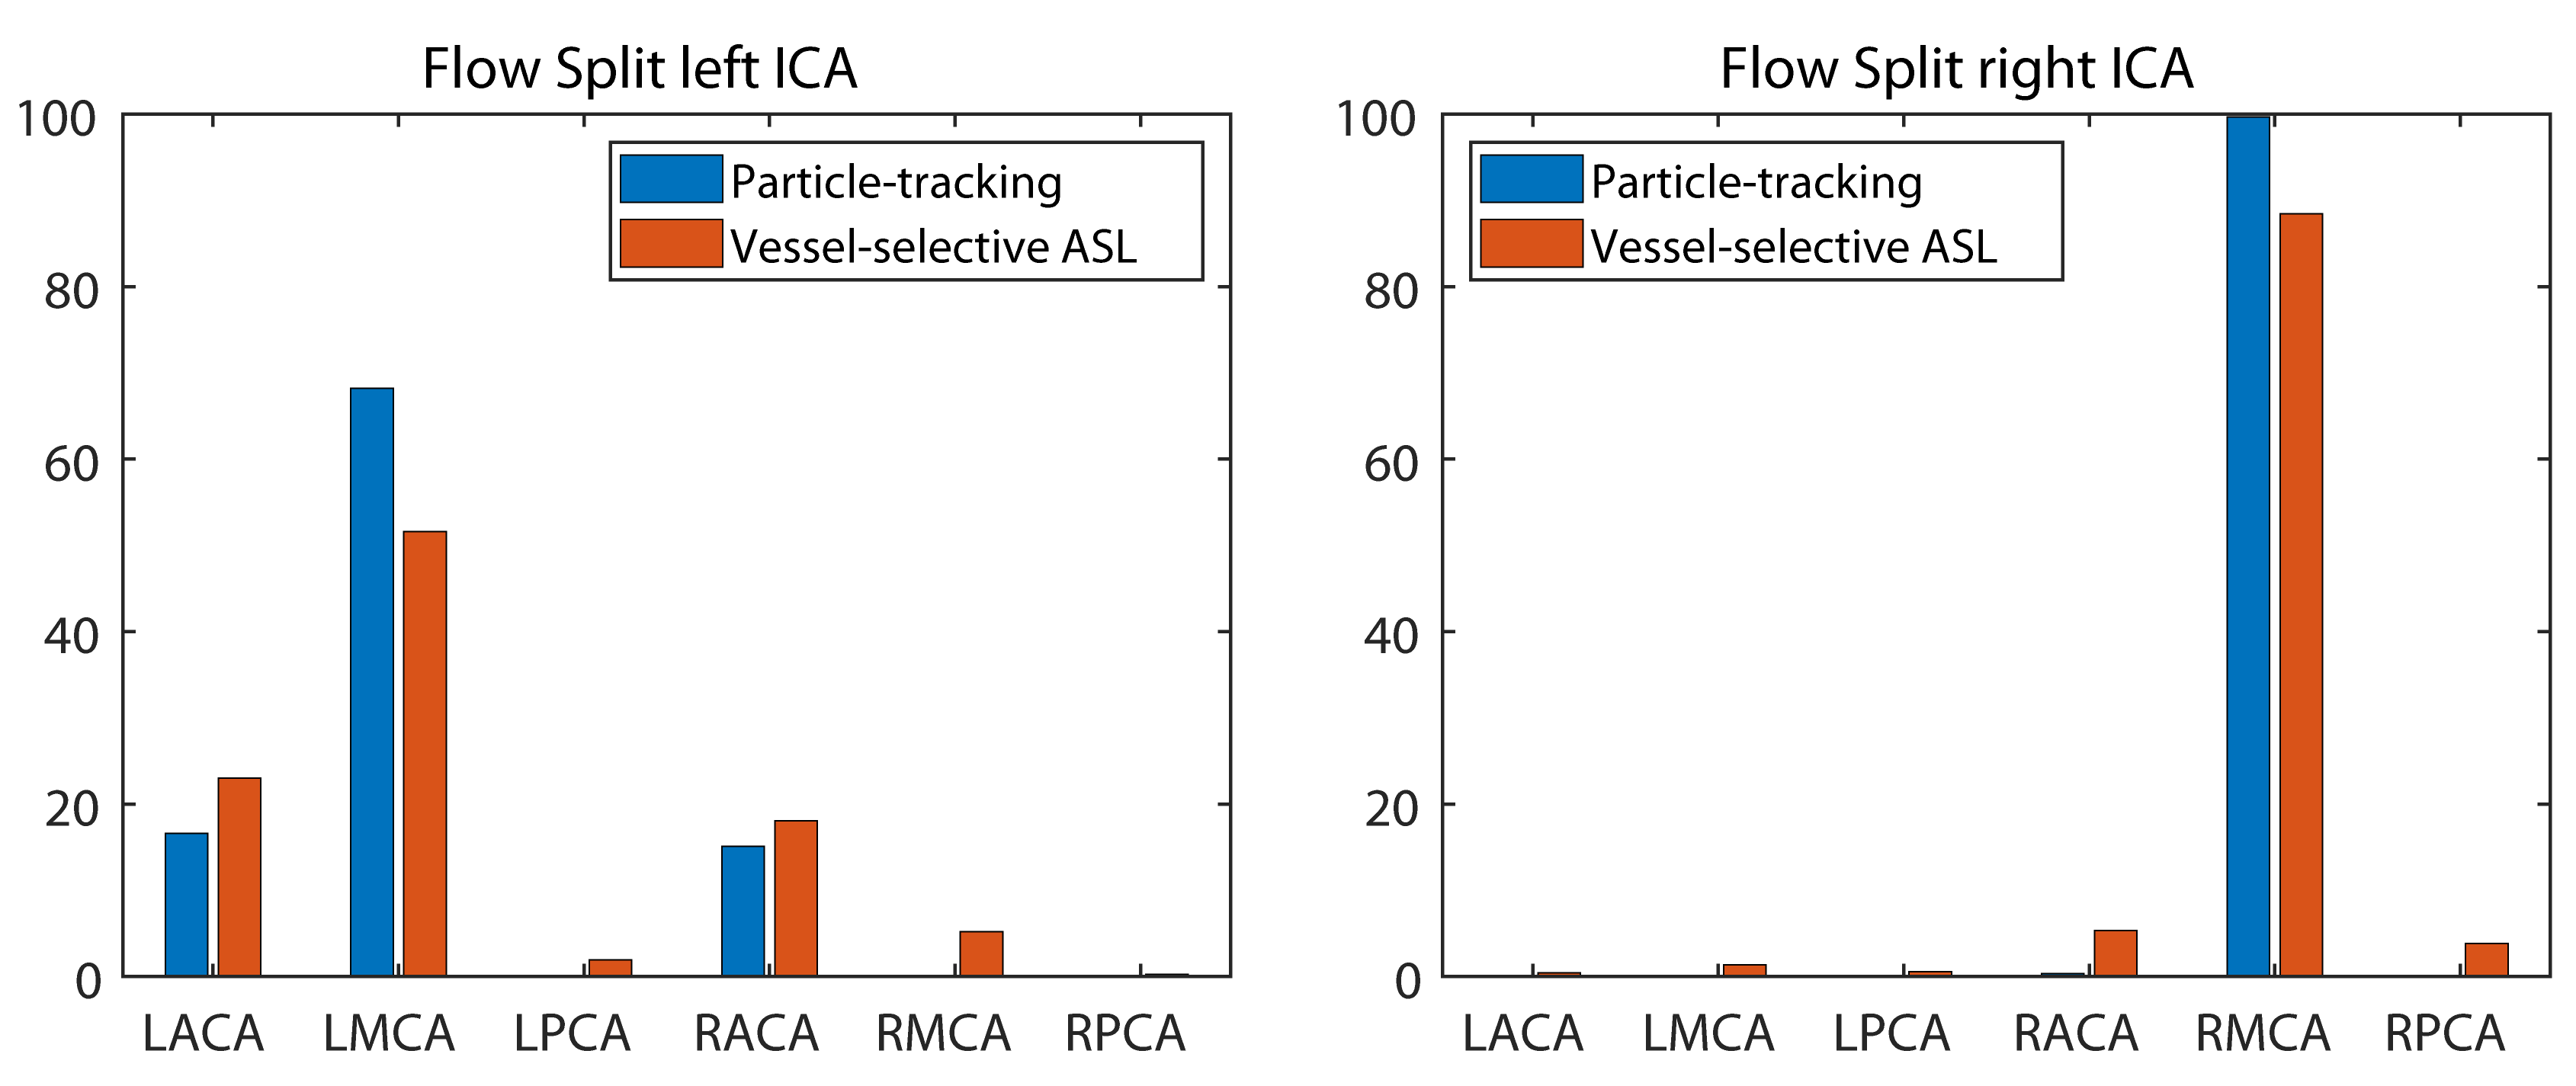
The combined imaging and computational modeling approach is demonstrated for a patient with asymptomatic right carotid stenosis (75% stenosis, female, age = 55 y/o). The pressure and velocity magnitude at peak systole are shown in Figure 2a. The pressure drops significantly due to the increase in resistance in the stenosis while the velocity increases on the contralateral side to compensate for the loss in flow. Figure 2b shows the transport of particles through the large arteries and quantification of collateral flow. A qualitative comparison between the perfusion territories based on VS-PCASL and the flow distribution in the CoW based on CFD is shown in Figure 3. The reduction in flow in the stenosed carotid artery (green) is compensated through the contralateral carotid artery (blue) by supplying the right anterior perfusion territory. The particle tracking shows both anterior cerebral arteries being supplied by the left carotid artery. In the posterior circulation, the ASL images show that the left vertebral artery (red) primarily supplies the right posterior territory and the right vertebral artery (yellow) primarily supplies the left posterior territory. This important observation is confirmed by the CFD model showing the swirling motion of vertebral flow in the basilar artery with little mixing. A quantitative comparison of collateral flow in the CoW is shown in Figure 4. The percentage flow split of right and left carotid artery based on VS-PCASL and CFD particle tracking show good agreement.Discussion
A workflow for quantifying collateral flow in the cerebral vasculature by combining MR imaging and CFD was presented. Good agreement was demonstrated between calibrated CFD simulation and VS-PCASL data. The calibrated CFD model provides quantitative, high-resolution, and time-resolved information about the flow compensation in the cerebral arteries due to the stenosis.Acknowledgements
No acknowledgement found.References
1. Mukherjee D, Jani ND, Selvaganesan K, Weng CL, Shadden SC. Computational Assessment of the Relation Between Embolism Source and Embolus Distribution to the Circle of Willis for Improved Understanding of Stroke Etiology. J. Biomech. Eng. 2016;138:81008 doi: 10.1115/1.4033986.
2. Helle M, Norris DG, Rüfer S, Alfke K, Jansen O, Van Osch MJP. Superselective pseudocontinuous arterial spin labeling. Magn. Reson. Med. 2010;64:777–786 doi: 10.1002/mrm.22451.
3. Schollenberger J, Figueroa CA, Garcia LH. Practical considerations for territorial perfusion mapping in the cerebral circulation using super ‐ selective pseudo ‐ continuous arterial spin labeling. Magn. Reson. Med. 2020:492–504 doi: 10.1002/mrm.27936.
4. Kim DE, Park JH, Schellingerhout D, et al. Mapping the Supratentorial Cerebral Arterial Territories Using 1160 Large Artery Infarcts. JAMA Neurol. 2018 doi: 10.1001/jamaneurol.2018.2808.
Figures