0025
Validation of the estimation of the macrovascular contribution in multi-timepoint arterial spin labeling MRI using a two-component model1Radiology, C.J. Gorter Center for High Field MRI, Leiden, Netherlands, 2Wellcome Centre for Integrative Neuroimaging, FMRIB, Nuffield Department of Clinical Neurosciences, University of Oxford, Oxford, United Kingdom, 3Institute of Biomedical Engineering, Research Council UK (EP/P012361/1), University of Oxford, Oxford, United Kingdom
Synopsis
A two-component kinetic model allows for the separation of the macrovascular and tissue signal. This model relies on the availability of multi-timepoint data and generates cerebral blood flow, arterial blood volume and arterial transit time maps. The goal of this study was to validate this separation of the macrovascular and tissue signal. A 4D-ASL angiography and densely sampled ASL data were acquired and fitted with different model settings. Fitting the 4D-ASL angiography with a macrovascular component showed the best fit for the model with gamma dispersion included but with limited freedom to change the dispersion parameters.
Introduction
Perfusion images acquired with arterial spin labeling (ASL) are usually quantified using a single component model to obtain quantitative cerebral blood flow (CBF) maps, which provide information on the cerebral hemodynamic status 1,2. However, when using this single component model, these CBF maps can be contaminated by macrovascular ASL-signal leading to an overestimation of the CBF 3. Including a macrovascular component into the kinetic model, allows for isolation and subsequent elimination of this macrovascular effect. This alleviates the overestimation of the CBF since it separates the ASL signal into two components, i.e. a macrovascular and tissue component. Such a two-component kinetic model models vascular signal as a “flow through” compartment and relies on the availability of multi-time point data. It allows generation of both CBF, arterial blood volume (aBV), as well as arterial transit time (ATT) maps. However, only limited validation of this two-compartment model has been presented. Therefore, the goal of this study was to validate this separation by using 4D-ASL angiography as gold standard for the macrovascular component and to study how the separation is affected by the temporal resolution of the ASL-data.Methods
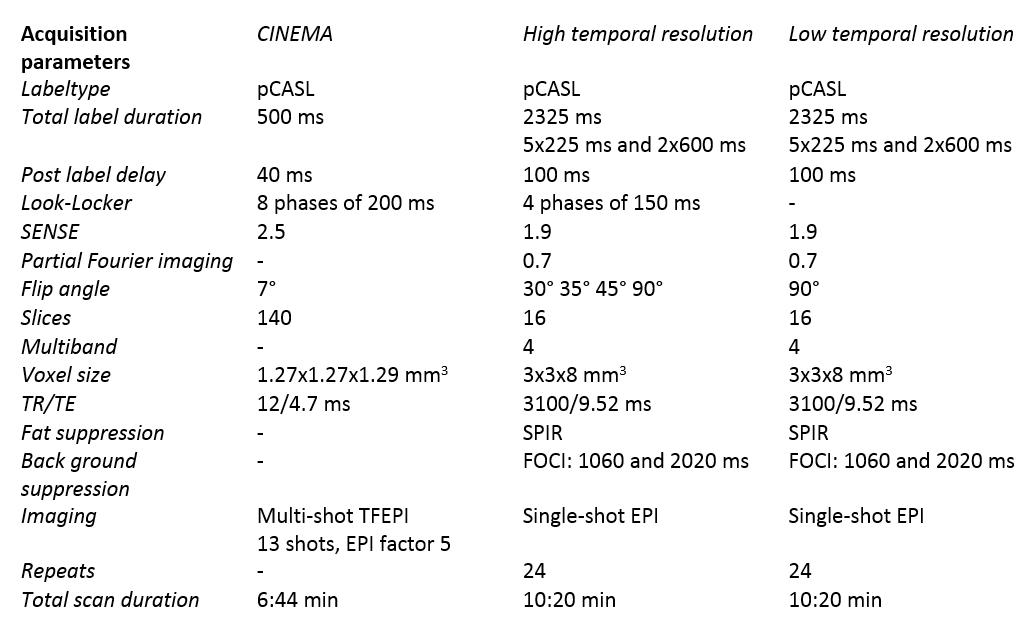
Four healthy volunteers (23-65y, 3f/1m) were scanned using a 32-channel headcoil on a 3T-scanner (Achieva, Philips, Netherlands). A 4D-ASL contrast inherent inflow-enhanced angiography (CINEMA) was acquired as the ground truth for the macrovascular component using a pCASL labeling scheme and a Look-Locker (LL) 3D-TFE readout 4. Densely sampled multi-PLD (28 timepoints) pCASL data was acquired by combining time-encoding with a Hadamard-8 matrix and a LL EPI-readout. Lower temporal resolution data, which was obtained with and without vascular crushing in the inferior-superior direction with a velocity encoding cutoff of 4cm/s2, was acquired by eliminating the LL-readout (7 timepoints, 90° flip-angle) 5, Table 1. The two-component model within a probabilistic analysis approach in the BASIL toolkit of the FMRIB’s software library (FSL) was used 3,6,7. For the 4D-angiography data, only the macrovascular component was fitted for the first five phases. Different models were fitted to the data, namely with and without the inclusion of a gamma dispersion kernel. Moreover, the priors of the dispersion kernel parameters (time to peak and sharpness of the distribution) were altered to allow more freedom by decreasing the precisions 8. Both the macrovascular and perfusion components were modeled for the multi-PLD ASL data which resulted in quantified CBF and aBV maps. The negative free energy (FE), which combines the accuracy of the model’s fit with a penalty for the number of free parameters, was calculated and the model’s fit per voxel was analyzed. To compare the ASL data to the ground truth, the CINEMA data was down sampled to a conventional ASL spatial resolution before fitting the data.Results
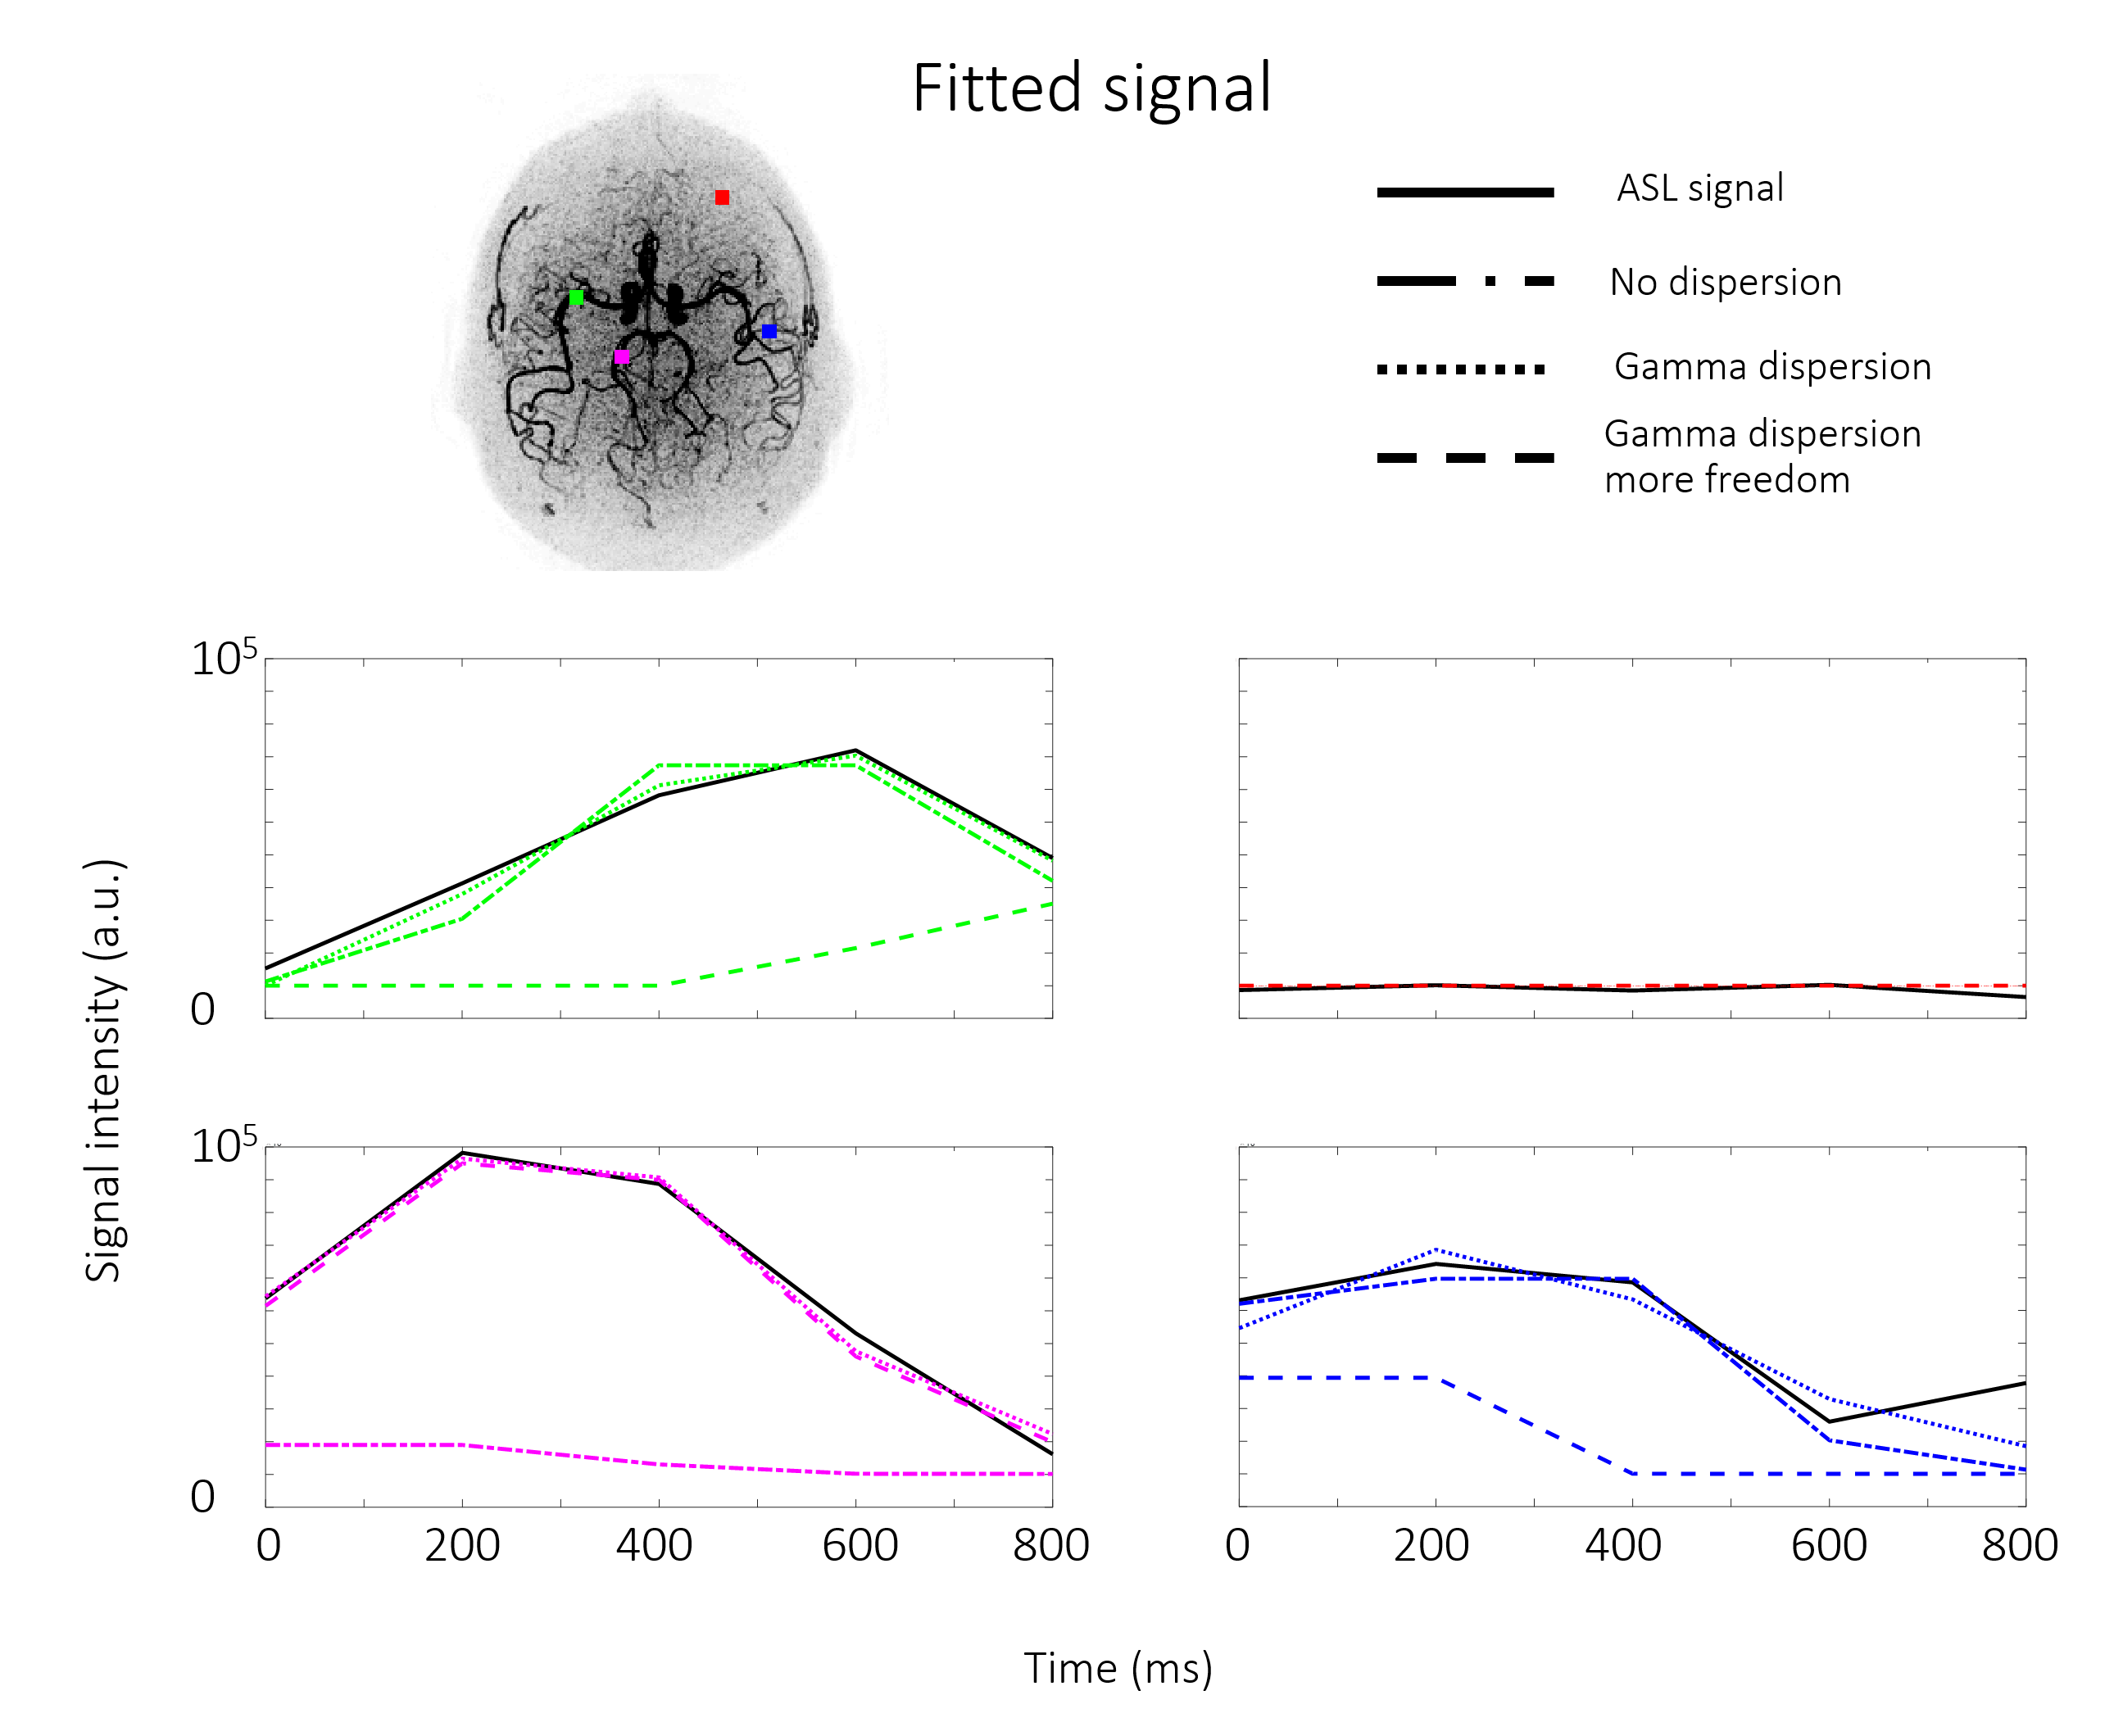
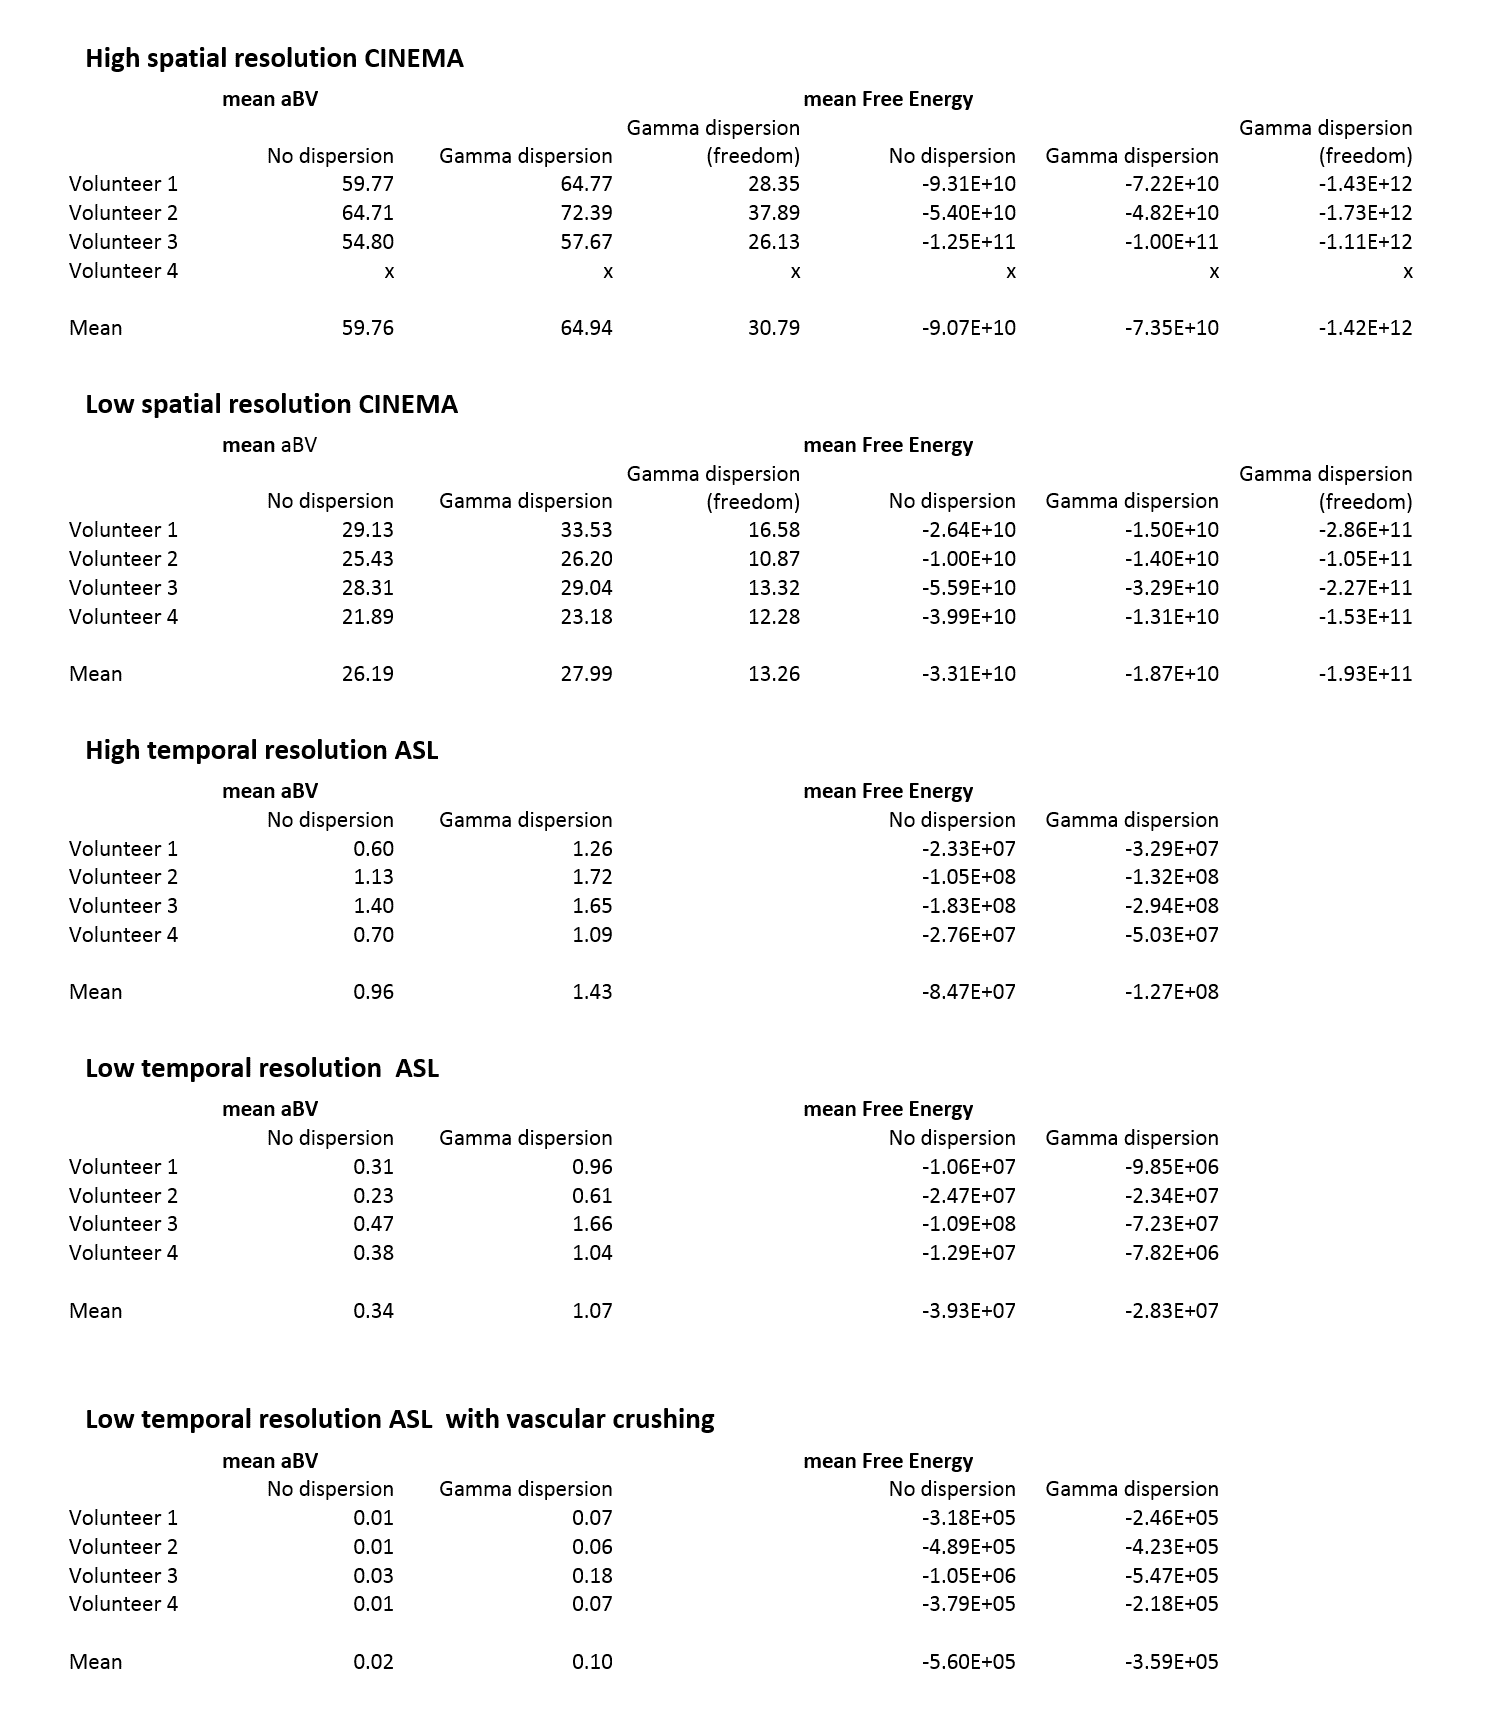
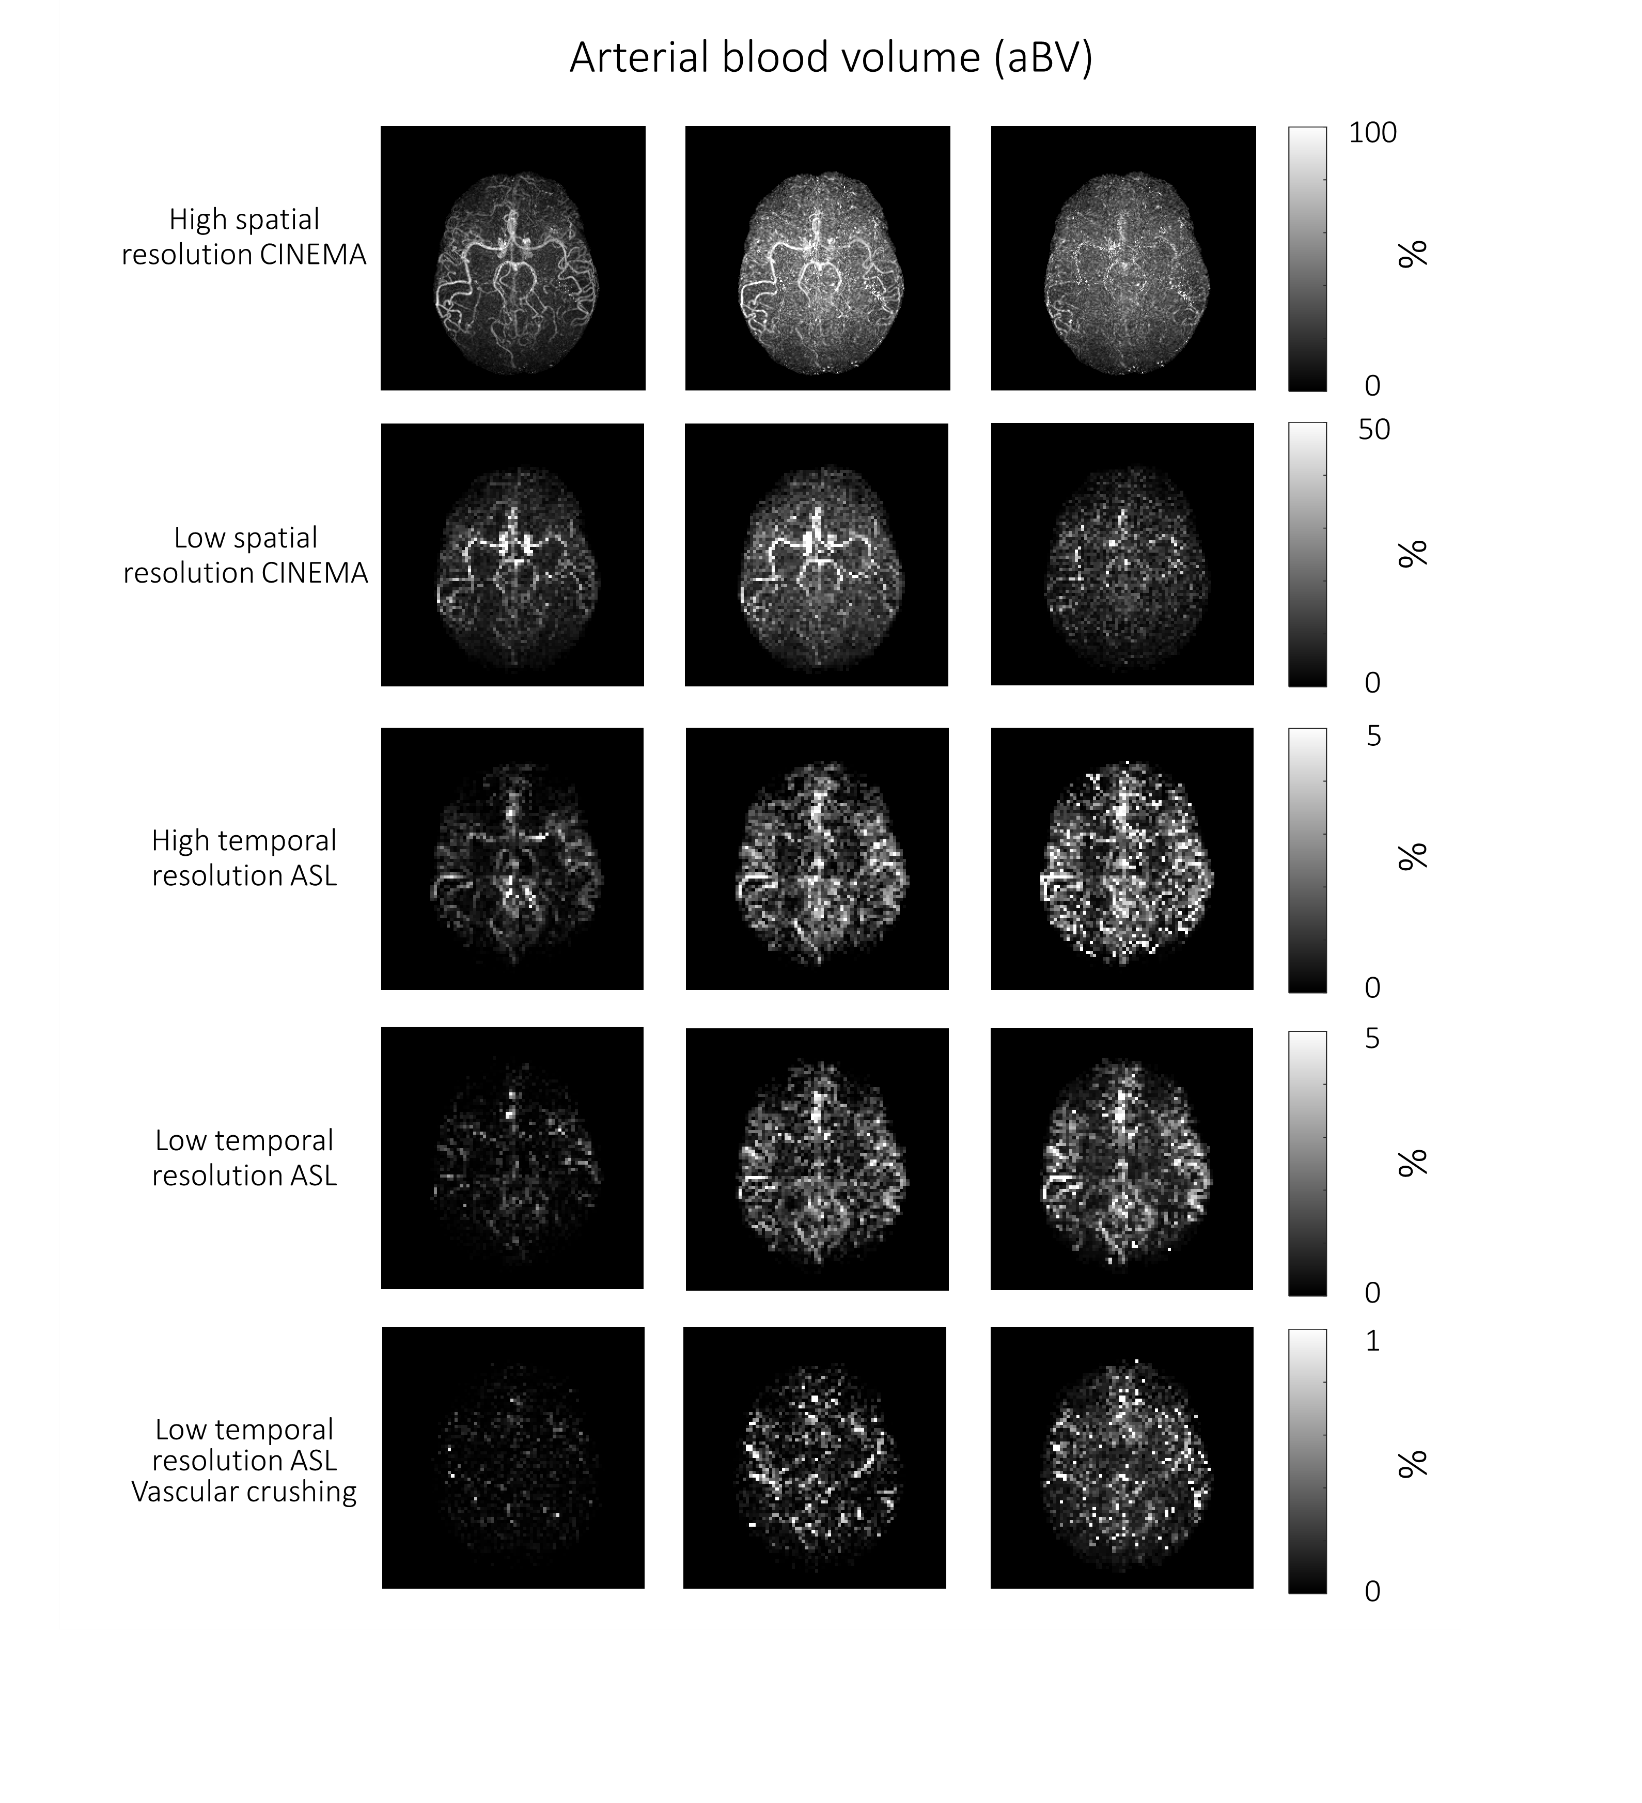
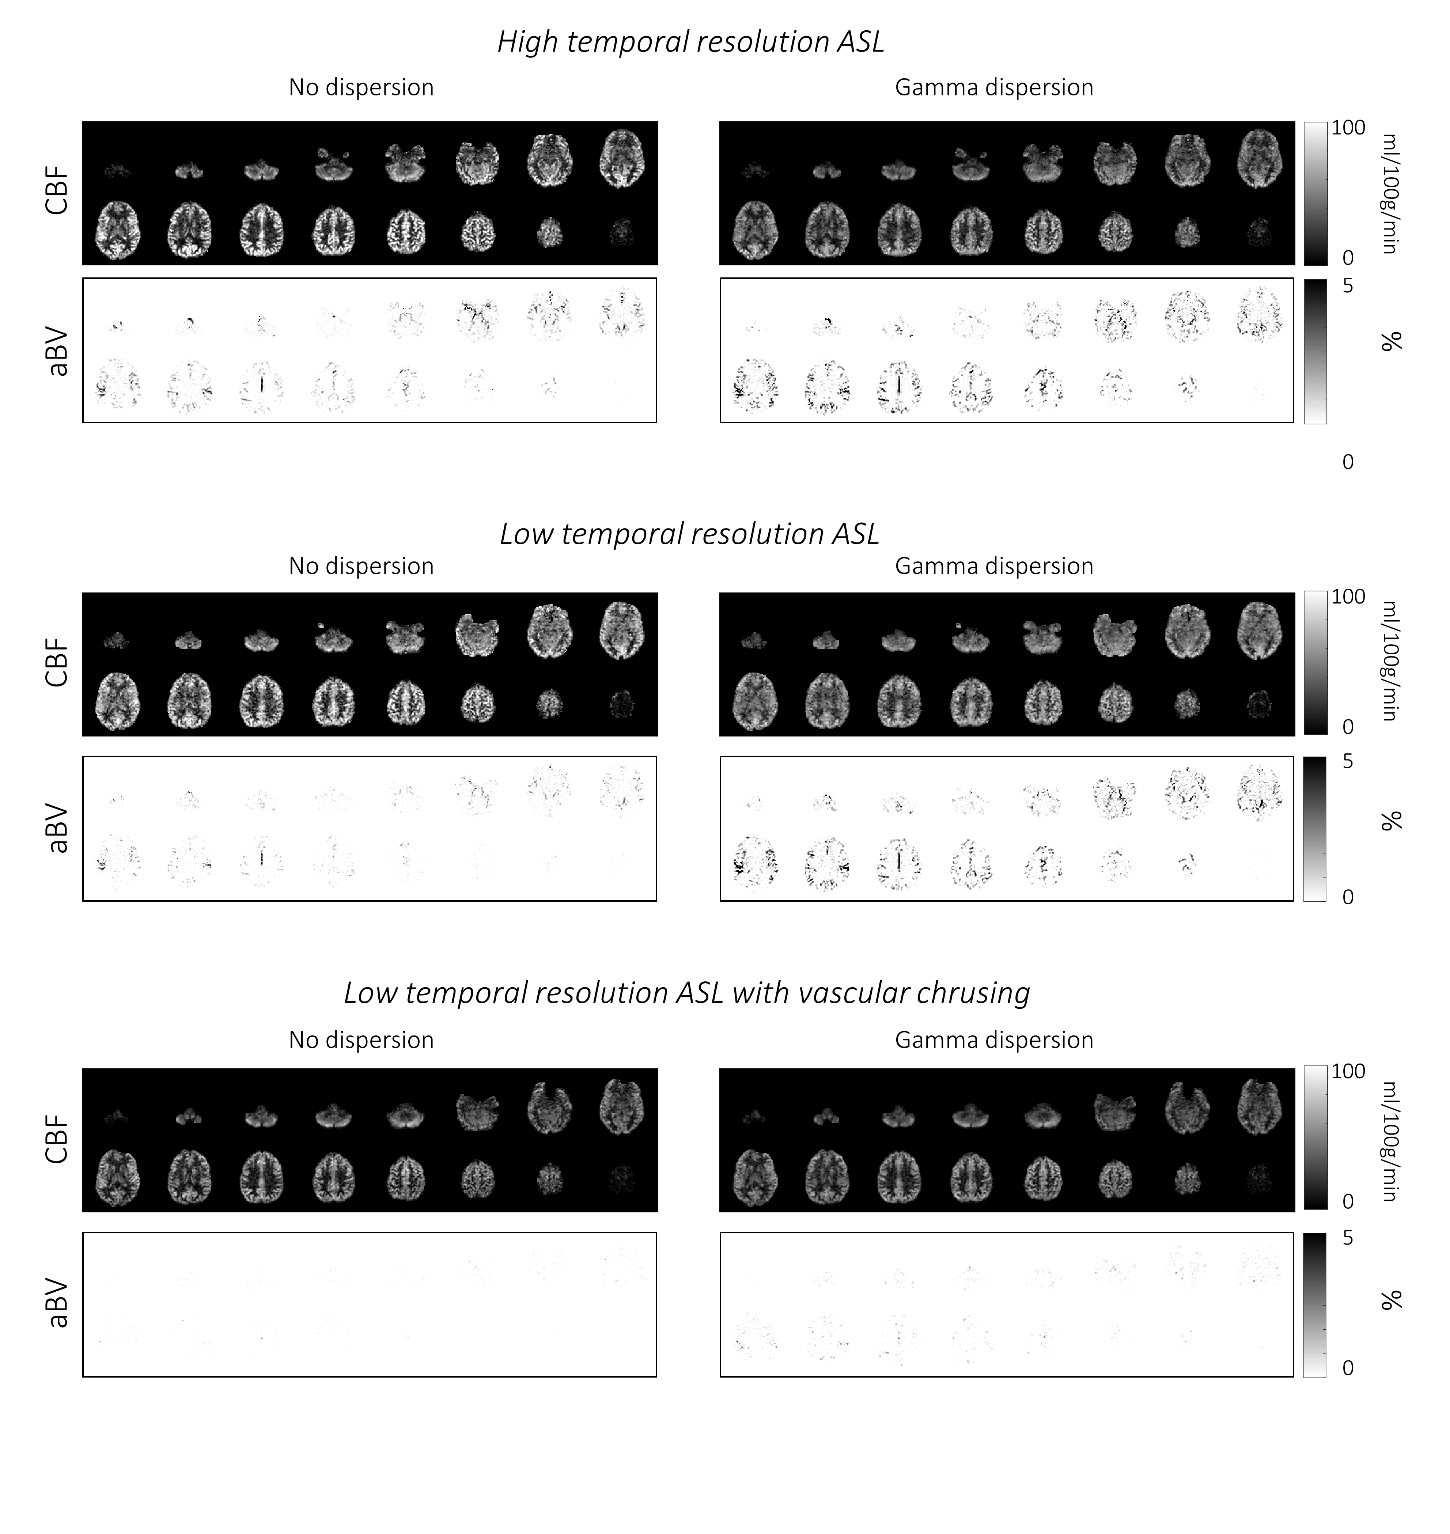
The 4D-ASL angiography was used to compare the different models, without dispersion, with gamma dispersion and gamma dispersion with more freedom. Figure 1 shows the model’s fit in four different voxels, overall the fit with the gamma dispersion kernel included, showed the most similarities with the ASL signal, which is supported by the lowest mean FE values within the macrovascular component (Table 2). Figure 2 shows the aBV maps for the different models for all datasets. The aBV values for the ASL data were much lower than the aBV values of the (down sampled) CINEMA data. Figure 3 shows the aBV and CBF maps for the high and low temporal resolution data (with/without vascular crushing). The temporal resolution of the ASL data set, does affect the separation of the macrovascular and tissue component, since the aBV values are higher and the CBF values are lower for the high temporal resolution data. By employing vascular crushing, almost all of the macrovascular component was crushed.Discussion and conclusion
Fitting the 4D-ASL angiography with a macrovascular component showed the best fit and the highest FE values for the model with gamma dispersion included but with limited freedom to change the dispersion parameters, therefore it is advised to use this macrovascular model when separating macrovascular from tissue signal. The temporal resolution of the ASL data does, however, affect this separation. Moreover, the aBV values differ a lot between the ASL and the 4D-ASL angiography. Whereas the aBV values of the ASL data are in line with previous reported values of aBV <5% 3,9,10, literature values of e.g. the MCA-diameter would support the larger values as observed from the 4D-ASL angiography data. The reason for this discrepancy is unknown, but might be related to the fact that the dynamic pattern of the macrovascular component is too similar to the perfusion signal for accurate separation or arise due to differences between EPI and TFE-readout. This last option is supported by the fact that the MIP of the macrovascular compartment in the EPI-data reflects mainly more distal arteries, which will exhibit slower blood flow. More research is needed to elucidate these differences in aBV.Acknowledgements
This work is part of the research programme Innovational Research Incentives Scheme Vici with project number 016.160.351, which is financed by theNetherlands Organisation for Scientific Research (NWO).References
1. MacIntosh BJ, Lindsay AC, Kylintireas I, et al. Multiple inflow pulsed arterial spin-labeling reveals delays in the arterial arrival time in minor stroke and transient ischemic attack. Am J Neuroradiol. 2010;31(10):1892-1894. doi:10.3174/ajnr.A2008
2. Yoshiura T, Hiwatashi A, Yamashita K, et al. Simultaneous Measurement of Arterial Transit Time, Arterial Blood Volume, and Cerebral Blood Flow Using Arterial Spin-Labeling in Patients with Alzheimer Disease. Am J Neuroradiol. 2009;30(7):1388-1393. doi:10.3174/ajnr.A1562
3. Chappell MA, MacIntosh BJ, Donahue MJ, G??nther M, Jezzard P, Woolrich MW. Separation of macrovascular signal in multi-inversion time arterial spin labelling MRI. Magn Reson Med. 2010;63(5):1357-1365. doi:10.1002/mrm.22320
4. Uchino H, Ito M, Fujima N, et al. A novel application of four-dimensional magnetic resonance angiography using an arterial spin labeling technique for noninvasive diagnosis of Moyamoya disease. Clin Neurol Neurosurg. 2015;137:105-111. doi:10.1016/j.clineuro.2015.07.003
5. Merlijn C.E. van der Plas, Wouter M. Teeuwisse, Sophie Schmid, Michael Chappell and MJP van O. High temporal resolution arterial spin labeling MRI with whole- brain coverage by combining time ‐ encoding with Look ‐ Locker and simultaneous multi ‐ slice imaging. 2019;(August 2018):1-11. doi:10.1002/mrm.27692
6. Chappell MA, Groves AR, Whitcher B WM. Variational Bayesian inference for a non-linear forward model. IEEE Trans Med Imaging. 2009;57(1):223-236.
7. A.R. Groves, M.A. Chappell MWW. Combined Spatial and Non-Spatial Prior for Inference on MRI Time-Series. Neuroimage. 2009;45(3):795-809.
8. Okell TW, Chappell MA, Schulz UG, Jezzard P. A kintec model for vessel-encoded dynamic angiography with arterial spin labeling. Magn Reson Med. 2012;68:969-979, doi:10.1002/mrm.23311
9. Petersen, E. T., Lim, T. and Golay, X. (2006), Model‐free arterial spin labeling quantification approach for perfusion MRI. Magn. Reson. Med., 55: 219-232. doi:10.1002/mrm.20784
10. An H, Lin W. Cerebral venous and arterial blood volumes can be estimated separately in humans using magnetic resonance imaging. Magn Reson Med 2002; 48: 583–588.
Figures