0022
Regional and depth dependence of cortical blood-flow assessed with high-resolution Arterial Spin Labeling1Division of MRI research, Department of Radiology, Beth Israel Deaconess Medical Center, Harvard Medical School, Boston, MA, United States, 2Diagnostic Imaging and Radiology, Children's National Medical Center, Washington, DC, United States
Synopsis
Imaging cortical blood-flow using ASL is relevant to unravel the basis of brain functional autoregulation or response to stimuli, but challenging because of the usual compromise between brain coverage, SNR and spatial resolution in ASL. We here propose to push the limits of volumetric ASL resolution using sparse variable-density FSE and Compressed-Sensing to study the distribution of cortical flow in healthy volunteers. We show through a group surface-based analysis some regional variations in cortical flow, but also depth-dependence of cortical flow. We also propose a high-resolution average ASL perfusion-weighted template that could have benefits for large-scale group studies.
Introduction
While relevant to unravel the physiological basis of brain functional autoregulation or response to stimuli1–3, imaging of cortical blood-flow is challenging due to the small size of the cerebral cortex hence requiring high-resolution imaging. For that matter, current Arterial Spin Labeling (ASL) implementations are limiting as 2D multi-slice implementations rely on highly anisotropic resolutions while 3D sequences suffer from image degradation and/or lower isotropic resolution. While UHF might be a way of increasing the spatial resolution to study cortical flow4, full brain coverage is in that case challenging. To reach that resolution, volumetric Fast-Spin-Echo with sparse sampling and Compressed-Sensing reconstruction has been shown to be promising5. Therefore, this work seeks to push the limits of volumetric ASL acquisitions to be able to collect high-resolution whole brain perfusion data allowing studying the distribution of cortical blood-flow.Material and Methods
We implemented a background suppressed PCASL preparation with a variable-density (VD) 3D-FSE6 with sparse Poisson-disk sampling7, featuring an oversampling of a k-space central region followed by pseudo-random distribution of the outer k-space sampling across excitations for high SNR, high-resolution and motion-robust whole brain coverage.Ten healthy volunteers were scanned at 3T (GE Discovery MR750) using a 32-channel head coil. We acquired 1mm3 3D-T1-w-SPGR and/or 3D-T2-FLAIR-FSE for registration and morphometric analyses. High-resolution perfusion data were acquired with the VD-FSE sequence using a fixed labeling duration of 1.5s, single PLD of 1.5/2s based on a prior low-resolution sequential 3-delay prescans to assess the most appropriate PLD, B1,av=1.4μT, Gmax/Gav=3.5/0.5mT/m. Imaging parameters were: TR/TE=6000-6500/6-8ms, rBW=31.25kHz, ETL=120, 1.7 or 1.8mm3 isotropic nominal resolution, FOV=23cm, Tacq=15-16min depending on the number of slice-encodes.
Image reconstruction was performed offline, implemented in MATLAB and relying on the BART toolbox8. To reduce T2-decay related blurring, a filter targeting a Fermi-windowed response in k-space was designed and applied after simulating the theoretical signal response for the variable flip-angle echo train used for T1 and T2 corresponding to the gray matter (T1=1600ms,T2=100ms)9. Coil-sensitivities estimation was performed using ESPIRiT10 on the proton-density weighted reference image. Then, a 4D Compressed-Sensing reconstruction relying on spatial wavelet and temporal total-variation (TV) sparsity enforcement was performed as described previously5,7. Absolute CBF was calculated using a single-compartment model11. FreeSurfer cortical surface estimation and parcellation was performed on the T1-w volume, followed by boundary-based registration of ASL to the T1-w and group normalization to an average surface. The CBF was sampled at mid-distance between the pial and WM surface followed by calculation of a mean CBF in 34 ROIs. Additionally, we sampled the CBF by 5% steps from the pial to white surface to evaluate its depth-dependence. We additionally created a high-resolution perfusion-weighted template using ANTs multi-channel (T1/ASL) template construction pipeline (SyN transform, 4 iterations, CC metric)12.
Results and Discussion
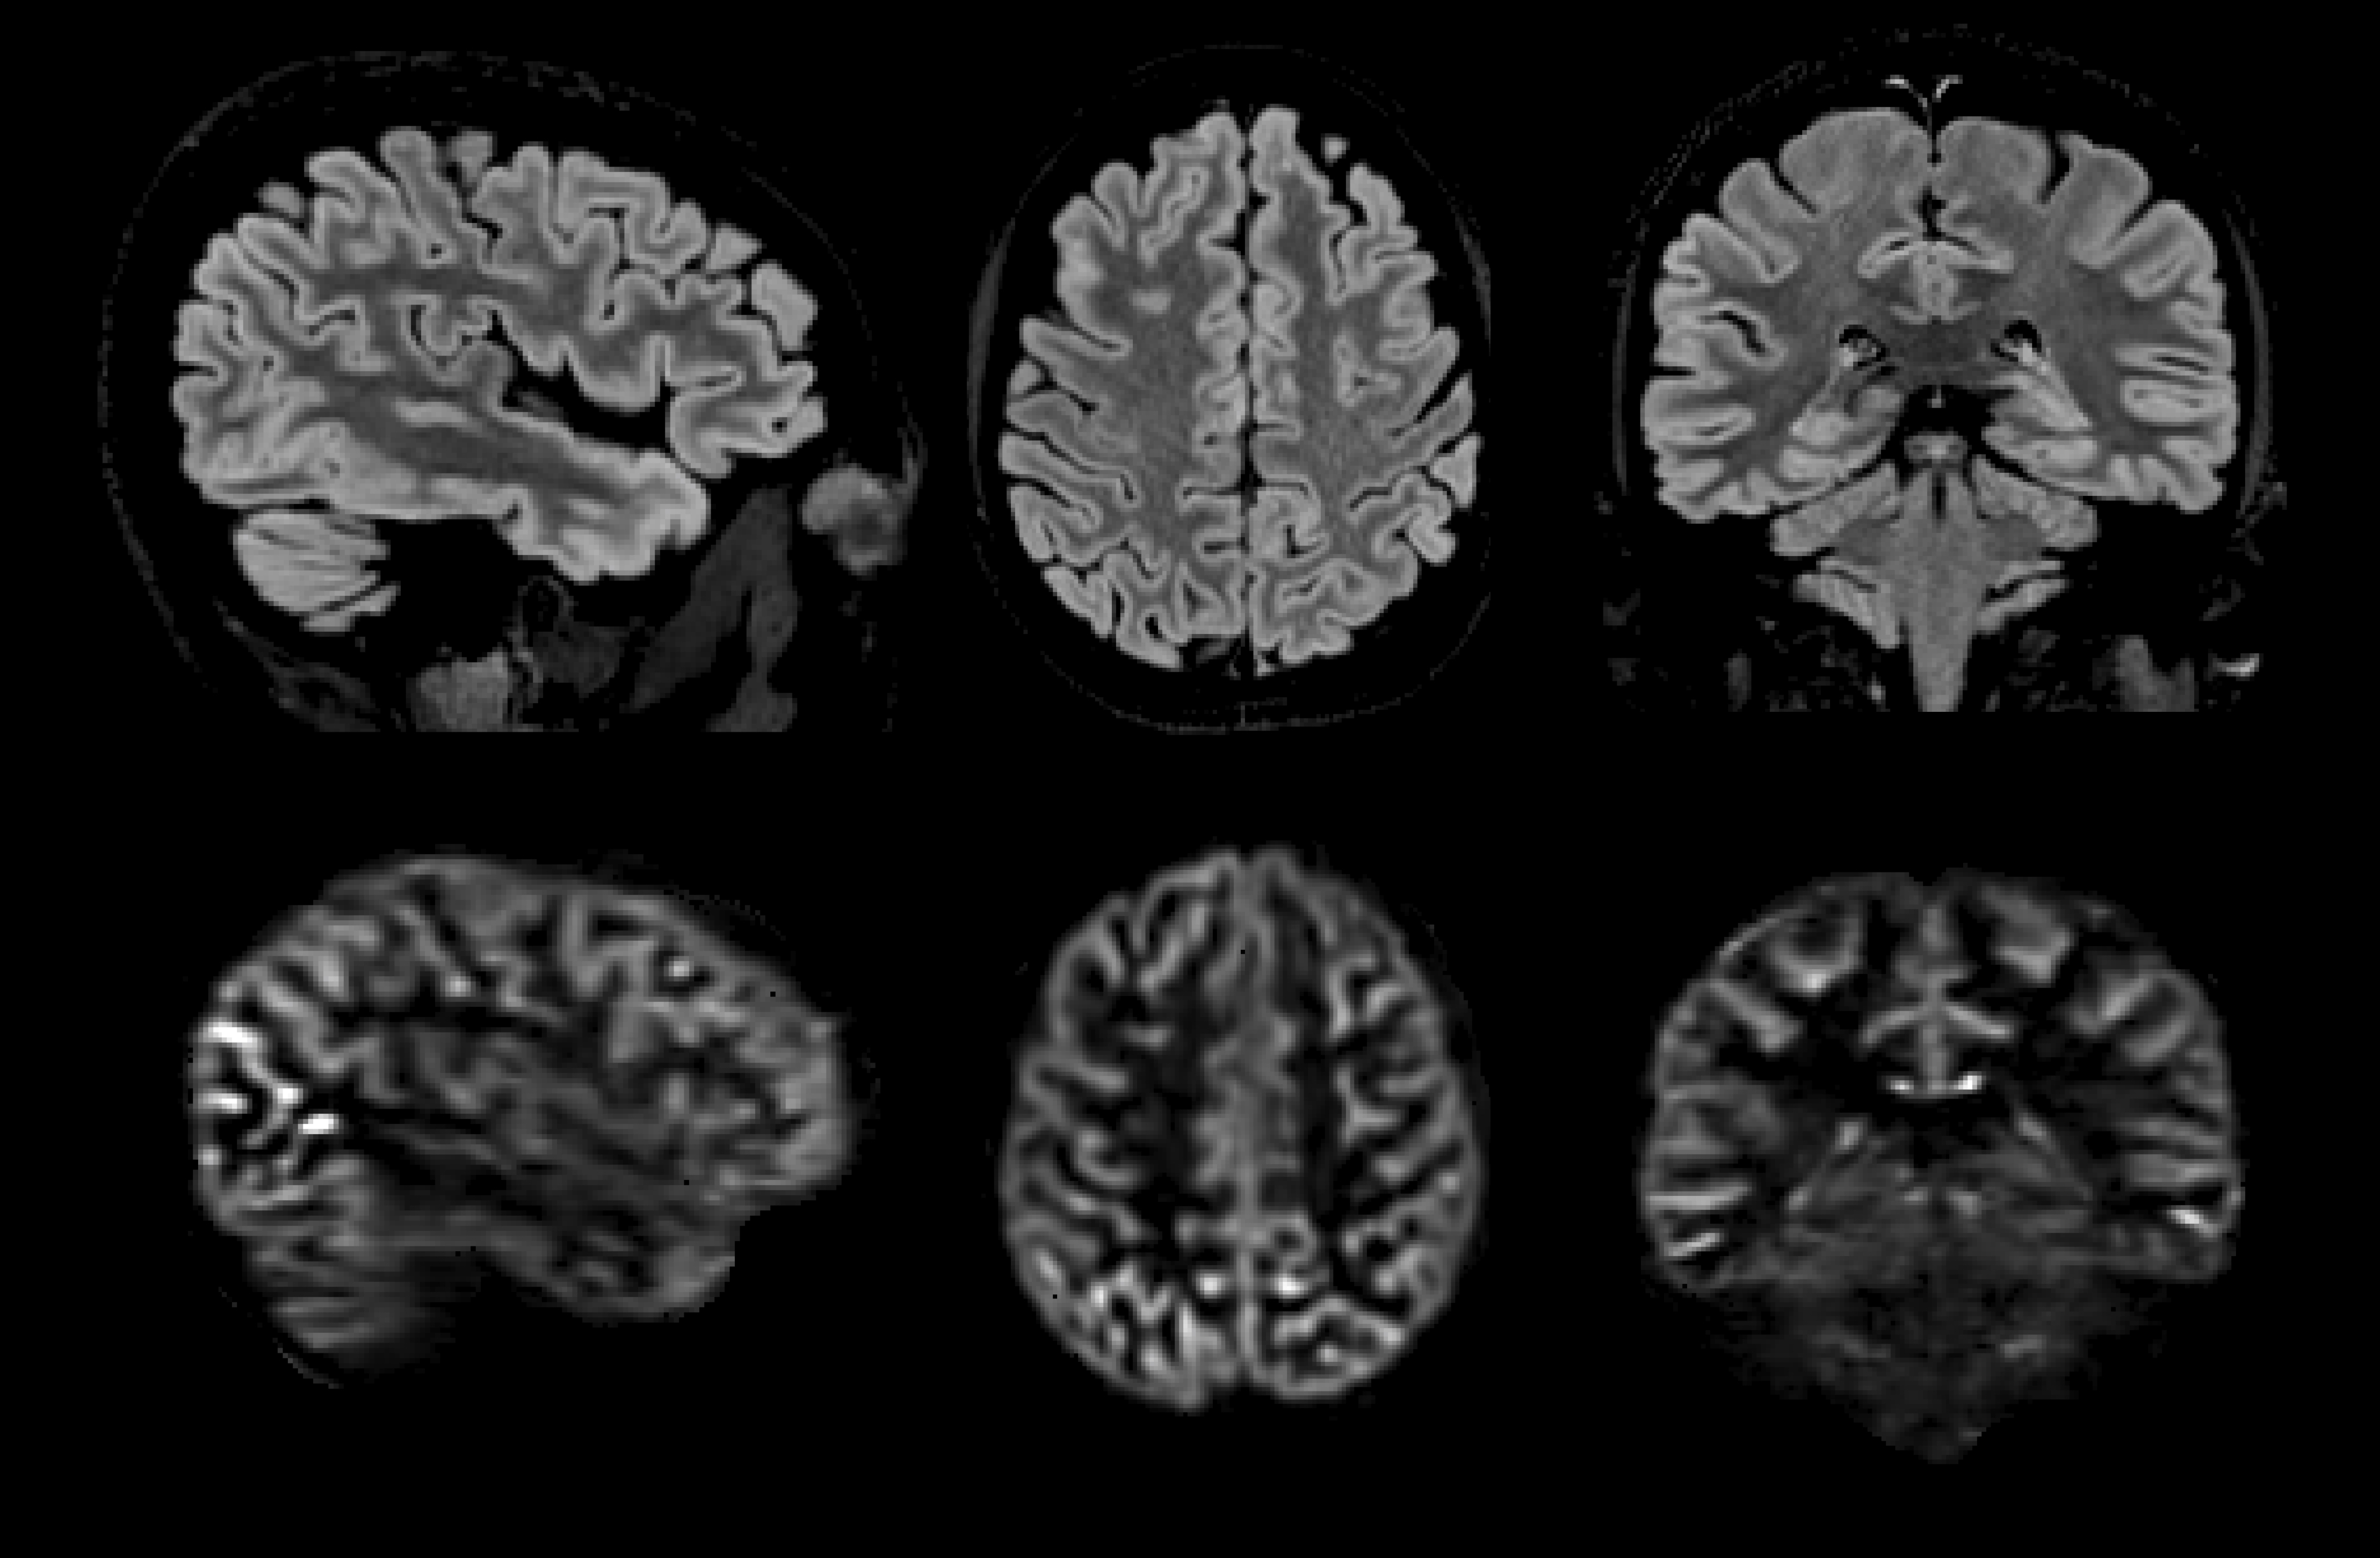
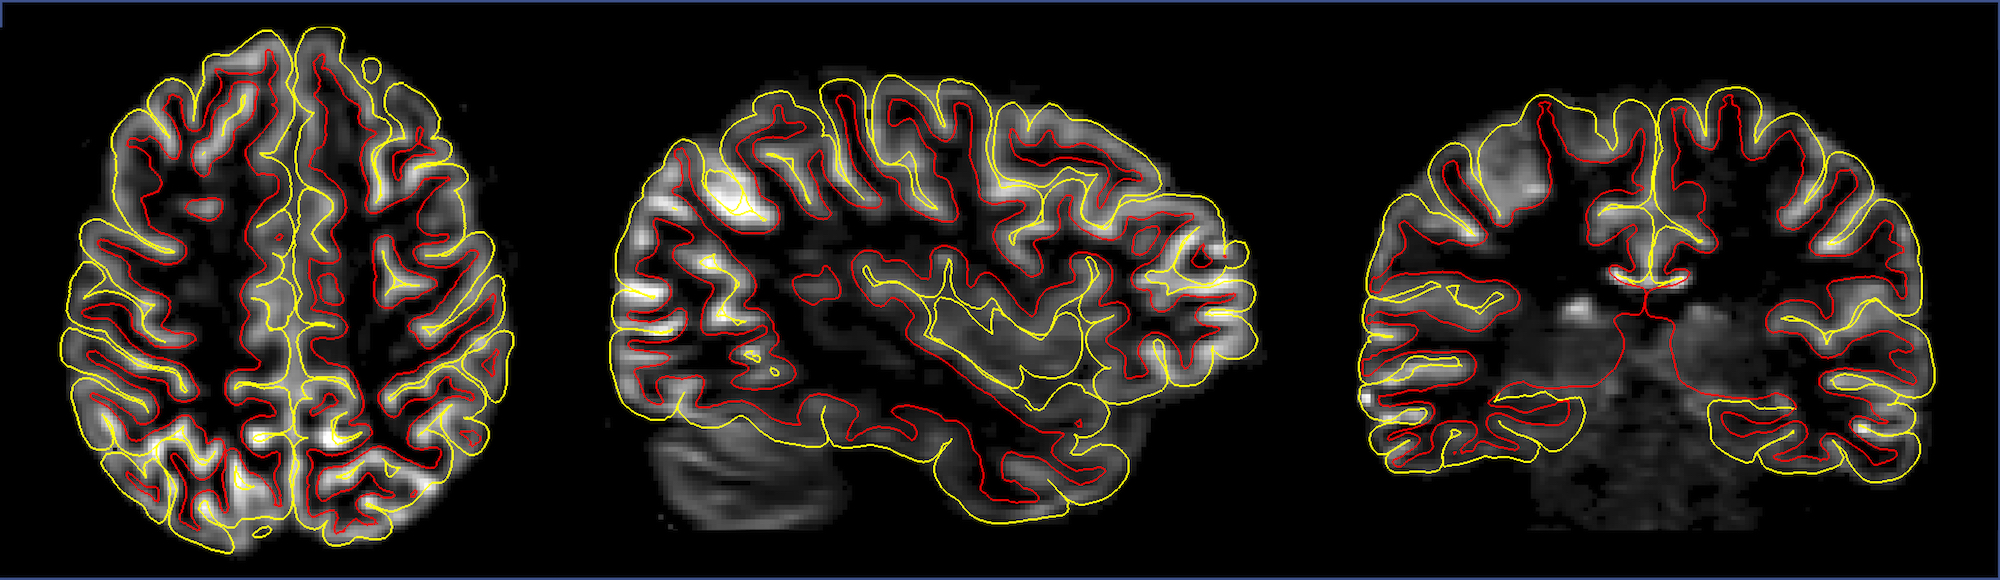
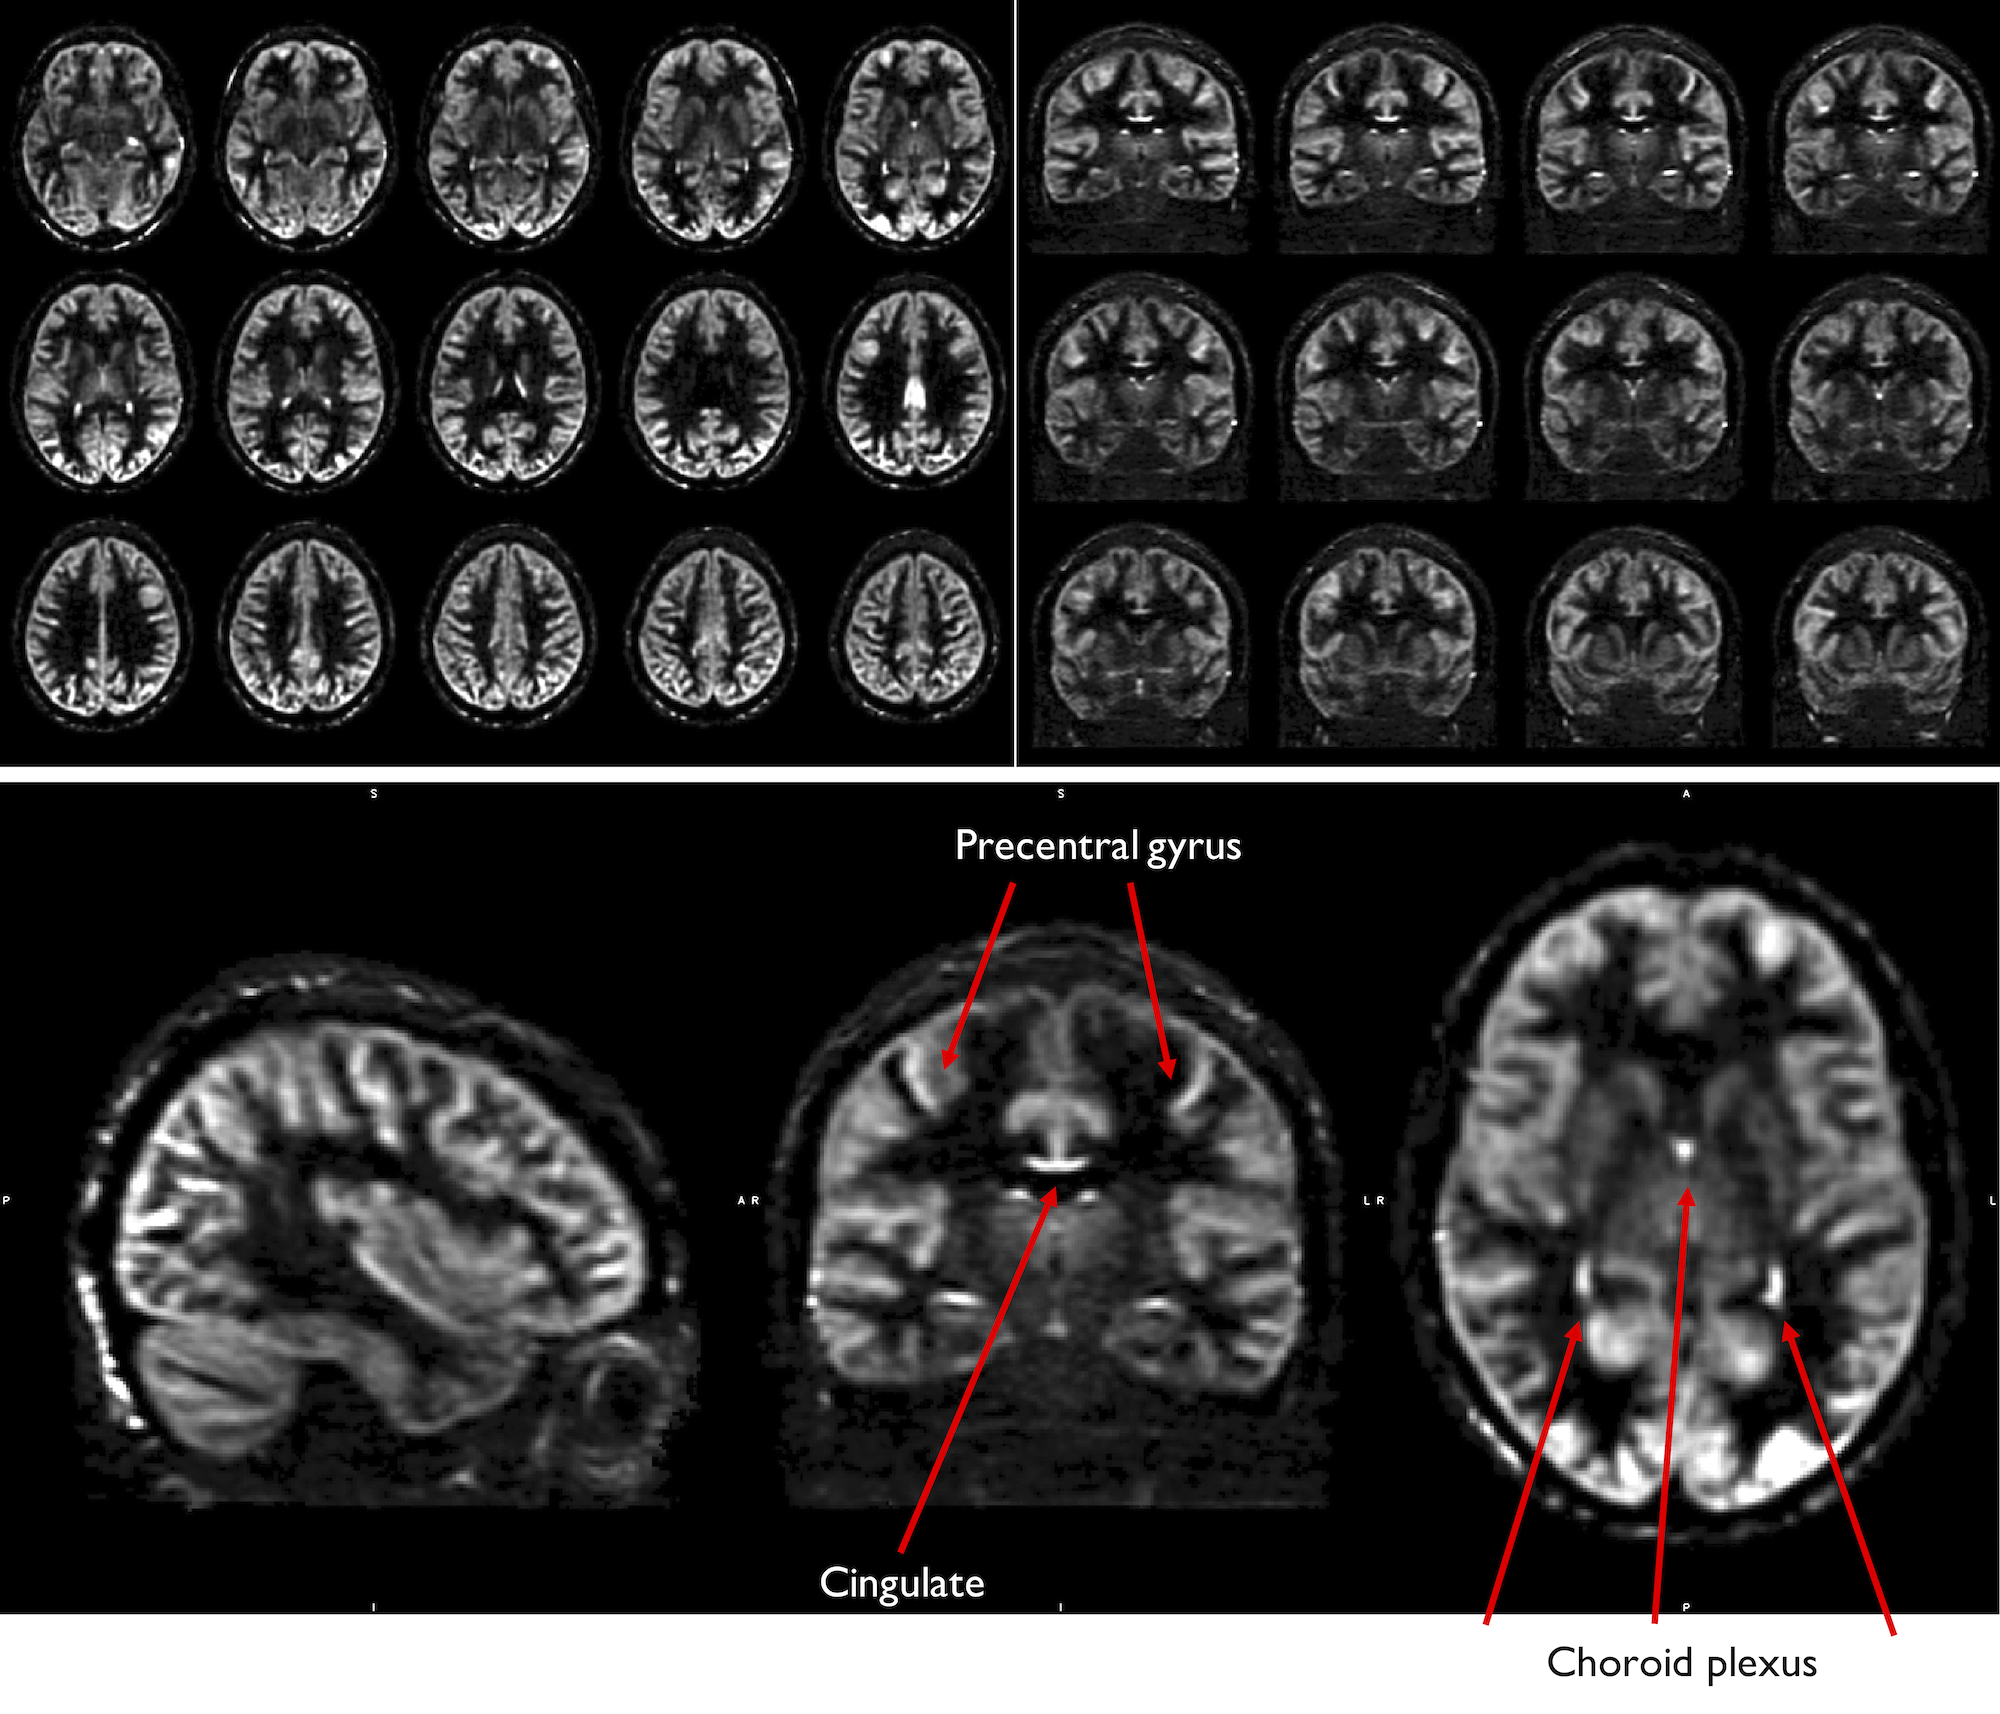
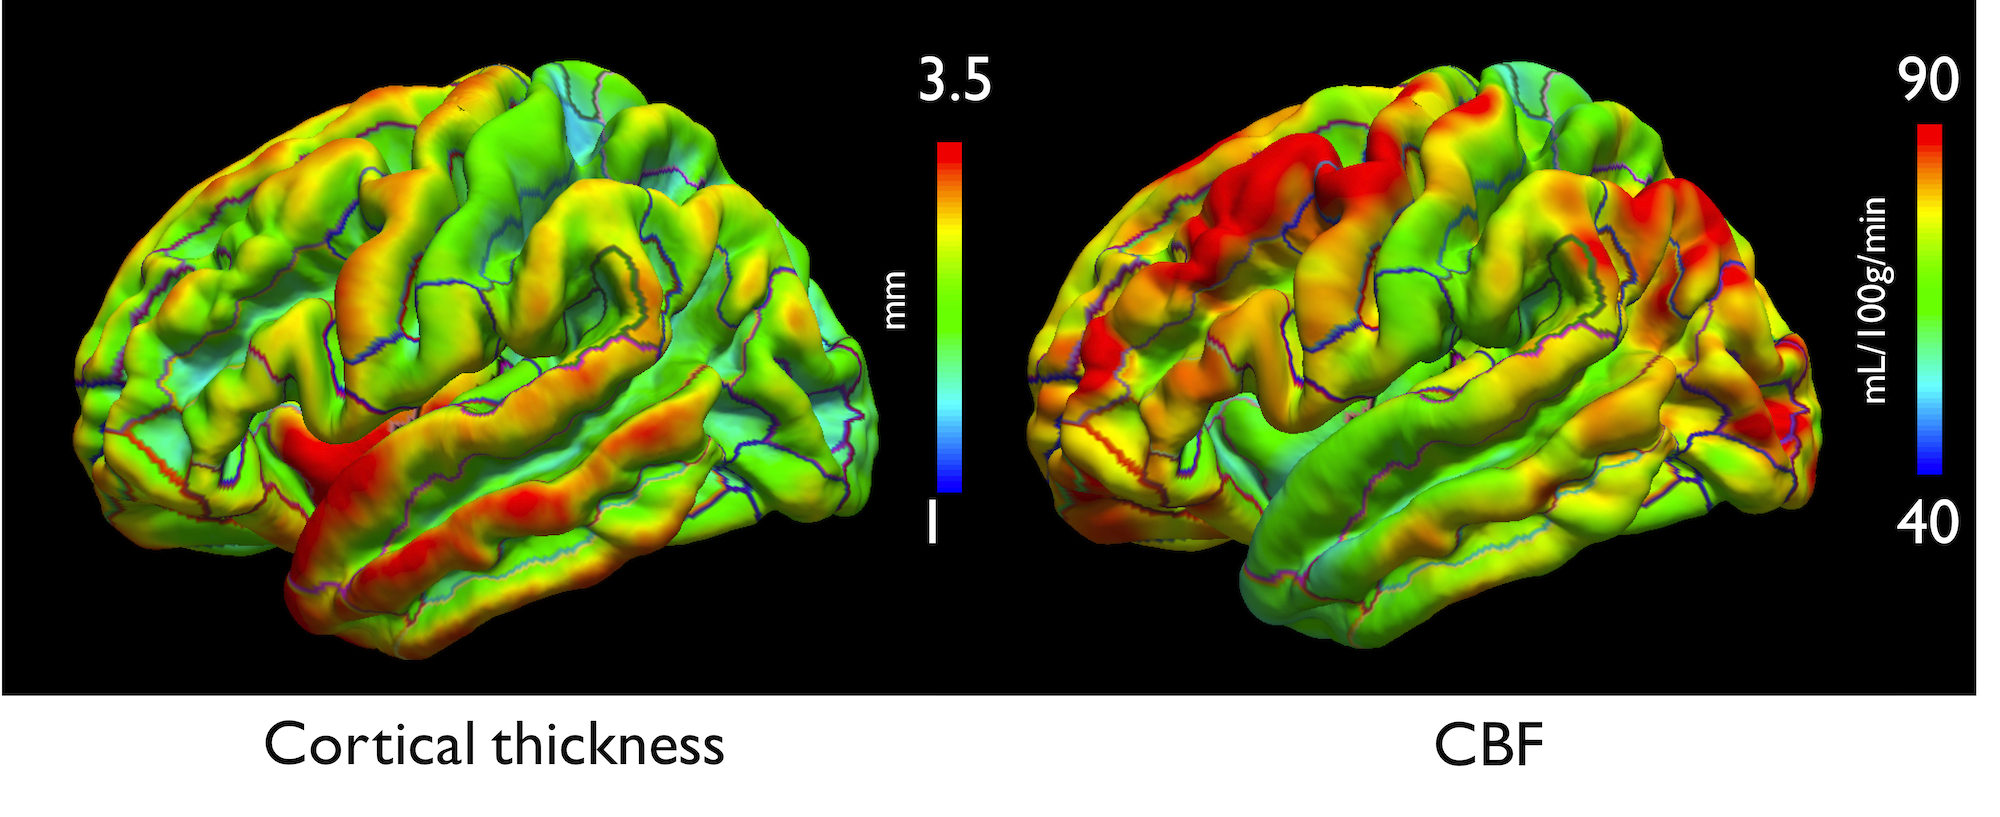
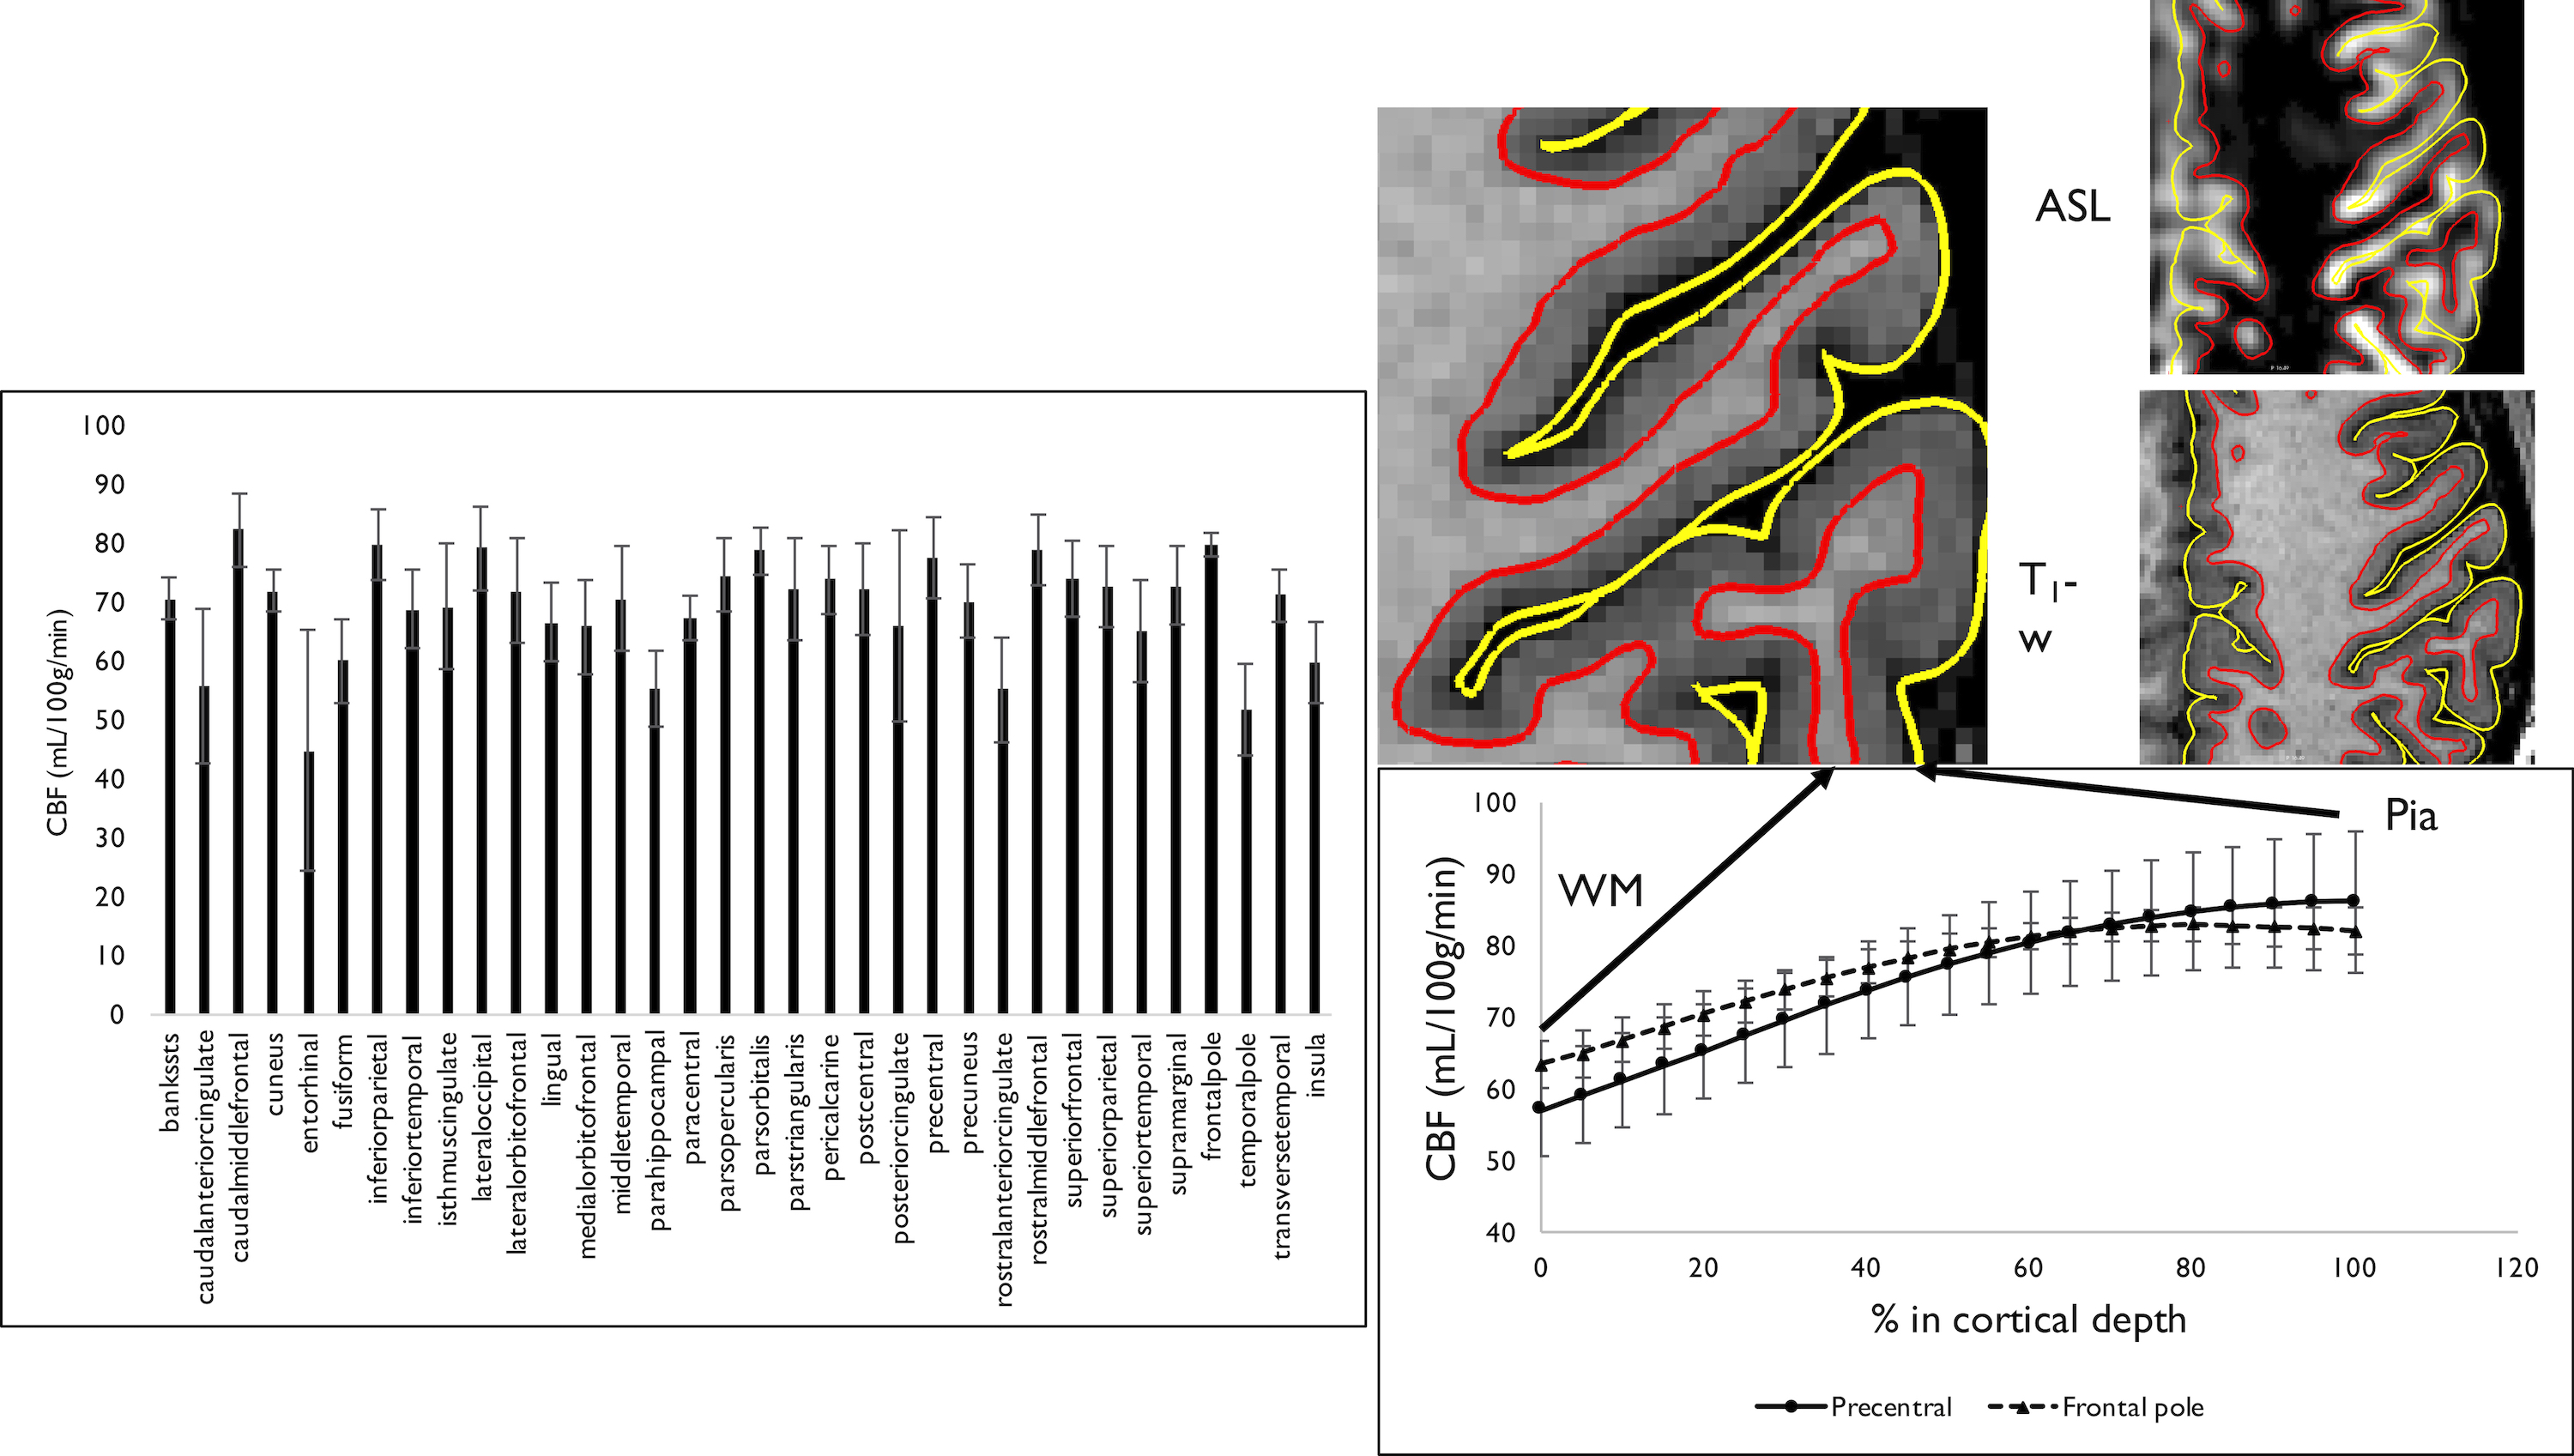
ASL volumes were successfully collected at high isotropic spatial resolution (1.7mm3), as seen in Fig.1, with high SNR offered by the volumetric FSE sequence and high quality thanks to the k-space oversampling strategy and Compressed-Sensing reconstruction. Particularly, accurate definition of the cortical gray matter could be achieved as seen on Fig.2 when looking at the pial/white matter surface delineation from the high-resolution anatomical volume. This led to the construction of a high-resolution average ASL template (Fig.3) that reveals interesting features such as definition of the choroid plexus and regional variations of the perfusion signal in the cortex with higher signal for example in the precentral gyrus and posterior cingulate.Secondly, when performing the surface-based analysis of the group-averaged CBF (Fig.4/5), we observed an interesting marked heterogeneity of CBF across the cortex, with higher flow observed in some associative regions such as the middle frontal and inferior parietal gyri but also in the precentral gyri. Additionally, we observed a negative significant correlation between cortical thickness and CBF sampled at mid-distance (-0.46, p=0.005) that can be visualized on Fig.4.
Finally, when looking at the CBF distribution throughout the cortical thickness, we found an expected blood-flow increase from the white matter surface that shows as a linear increase followed by a plateau when reaching the pial surface. As illustrated in Fig.5, we observed that this blood-flow profile seems to vary between different cortical regions.
Discussion and Conclusions
This work is a first step towards pushing the limits of ASL spatial resolution to study the distribution of blood-flow across the cerebral cortex. Thanks to the combination between sparse variable-density FSE and CS reconstruction, we were able to acquire high-resolution, high-quality whole brain perfusion data, showing good consistency with anatomy. This work also provided an average perfusion-weighted template that could be used for spatial normalization of group studies involving ASL as it is aligned with the MNI T1-weighted template. Additionally, the group surface-based analysis highlighted a heterogeneity in cortical flow as well as depth-dependence of cortical flow. Although some caution should be used at this stage, these results are encouraging as the blood-flow profile through the cortex seems to be similar to its known microvascular density distribution13. Potential confounding factors such as partial volume effect, T1 and transit-time variations across the cortex will be studied as well as potential vascular contamination from pial vessels. This promotes the use of ASL for more detailed studies of the cerebral cortex functional architecture.Acknowledgements
No acknowledgement found.References
1. Liang, X., Zou, Q., He, Y. & Yang, Y. Coupling of functional connectivity and regional cerebral blood flow reveals a physiological basis for network hubs of the human brain. Proc. Natl. Acad. Sci. 110, 1929–1934 (2013).
2. Chen, J. J., Rosas, H. D. & Salat, D. H. The Relationship between Cortical Blood Flow and Sub-Cortical White-Matter Health across the Adult Age Span. PLOS ONE 8, e56733 (2013).
3. Huber, L., Uludağ, K. & Möller, H. E. Non-BOLD contrast for laminar fMRI in humans: CBF, CBV, and CMRO2. NeuroImage 197, 742–760 (2019).
4. Shao, X., Wang, K. & Wang, D. J. 7T high-resolution arterial spin labeling reveals layer dependent cerebral blood flow. in Proceedings of the 27th annual meeting of the ISMRM 849 (2019).
5. Taso, M., Zhao, L. & Alsop, D. C. High-resolution whole brain ASL perfusion imaging using variably undersampled Cartesian Fast-Spin-Echo and Compressed Sensing reconstruction. in Proceedings of the 27th annual meeting of the ISMRM 842 (2019).
6. Busse, R. F., Hariharan, H., Vu, A. & Brittain, J. H. Fast spin echo sequences with very long echo trains: Design of variable refocusing flip angle schedules and generation of clinical T2 contrast. Magn. Reson. Med. 55, 1030–1037 (2006).
7. Taso, M., Zhao, L., Guidon, A., Litwiller, D. V. & Alsop, D. C. Volumetric abdominal perfusion measurement using a pseudo-randomly sampled 3D fast-spin-echo (FSE) arterial spin labeling (ASL) sequence and compressed sensing reconstruction. Magn. Reson. Med. 82, 680–692 (2019).
8. Uecker, M. et al. Berkeley Advanced Reconstruction Toolbox. in Proc. Intl. Soc. Mag. Reson. Med 2486 (2015).
9. Zhao, L., Chang, C.-D. & Alsop, D. C. Controlling T2 blurring in 3D RARE arterial spin labeling acquisition through optimal combination of variable flip angles and k-space filtering. Magn. Reson. Med. 80, 1391–1401 (2018).
10. Uecker, M. et al. ESPIRiT—an eigenvalue approach to autocalibrating parallel MRI: Where SENSE meets GRAPPA. Magn. Reson. Med. 71, 990–1001 (2014).
11. Alsop, D. C. & Detre, J. A. Reduced transit-time sensitivity in noninvasive magnetic resonance imaging of human cerebral blood flow. J. Cereb. Blood Flow Metab. Off. J. Int. Soc. Cereb. Blood Flow Metab. 16, 1236–1249 (1996).
12. Avants, B. B., Epstein, C. L., Grossman, M. & Gee, J. C. Symmetric diffeomorphic image registration with cross-correlation: evaluating automated labeling of elderly and neurodegenerative brain. Med Image Anal 12, 26–41 (2008).
13. Lauwers, F., Cassot, F., Lauwers-Cances, V., Puwanarajah, P. & Duvernoy, H. Morphometry of the human cerebral cortex microcirculation: General characteristics and space-related profiles. NeuroImage 39, 936–948 (2008).
Figures