0020
Preclinical Spinal Cord Perfusion Imaging with Pseudo-Continuous Arterial Spin Labeling1Biophysics, Medical College of Wisconsin, Wauwatosa, WI, United States, 2Univ. Grenoble Alpes, Inserm, U1216, Grenoble Institut des Neurosciences, Grenoble, France, 3C.J. Gorter Center for High Field MRI, Radiology, Leiden University Medical Center, Leiden, Netherlands, 4Neurosurgery, Medical College of Wisconsin, Milwaukee, WI, United States
Synopsis
Pseudo-continuous arterial spin labeling (pCASL) to monitor spinal cord perfusion and hemodynamics has the potential to inform the clinical care of spinal cord injury and other disorders. This work demonstrates successful implementation and application of pCASL of the rodent cervical spinal cord at high field.
Introduction
Non-invasive imaging to monitor spinal cord perfusion and hemodynamics have the potential to inform clinical care of spinal cord injury and other disorders. Critically, clinical management guidelines for traumatic spinal cord injury emphasize the importance of restoring blood flow to the cord1. Arterial spin labeling MRI (ASL) techniques have been well-established for the brain yet, few studies have used these same techniques to evaluate spinal cord blood flow2,3. The purpose of this study was to evaluate the feasibility and systematic optimization of pseudo-continuous ASL (pCASL) in the healthy rodent cervical spinal cord.Methods
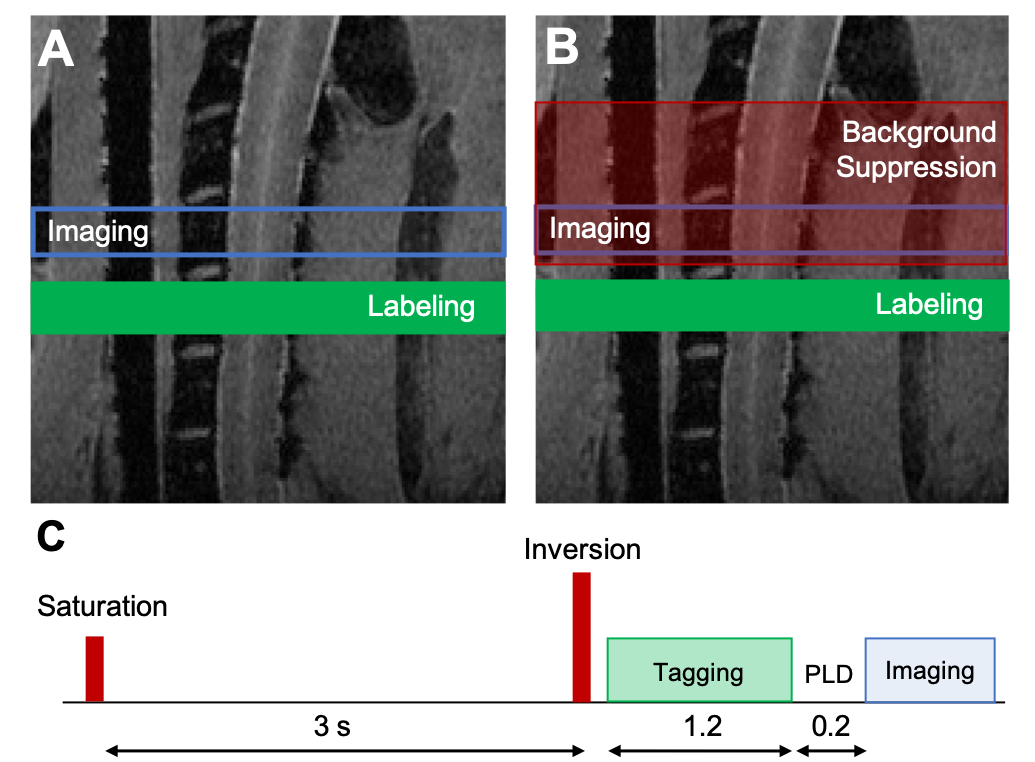
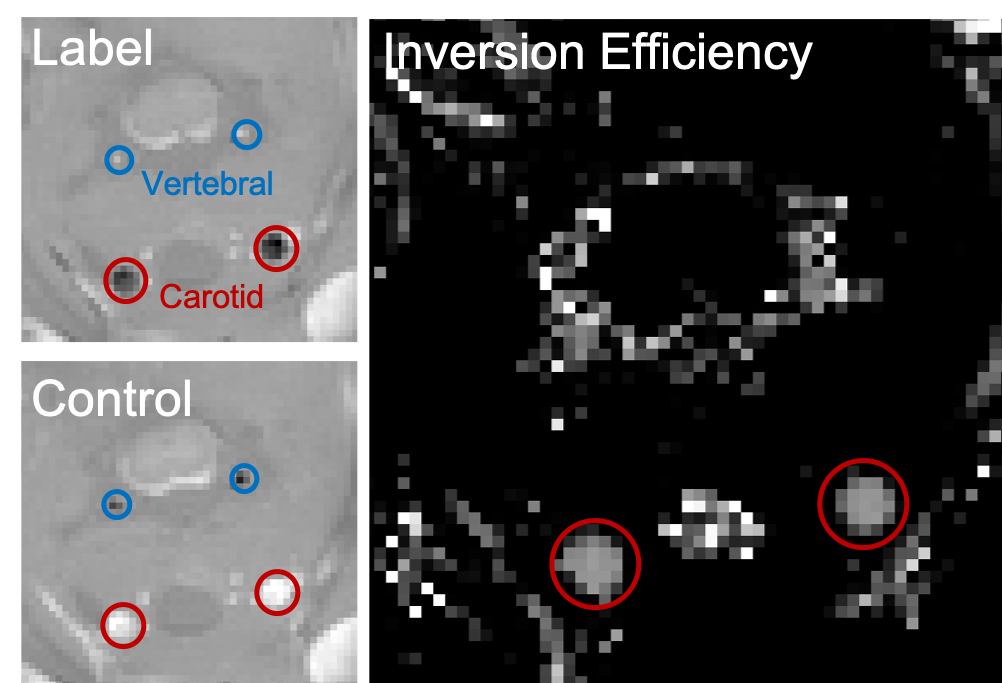
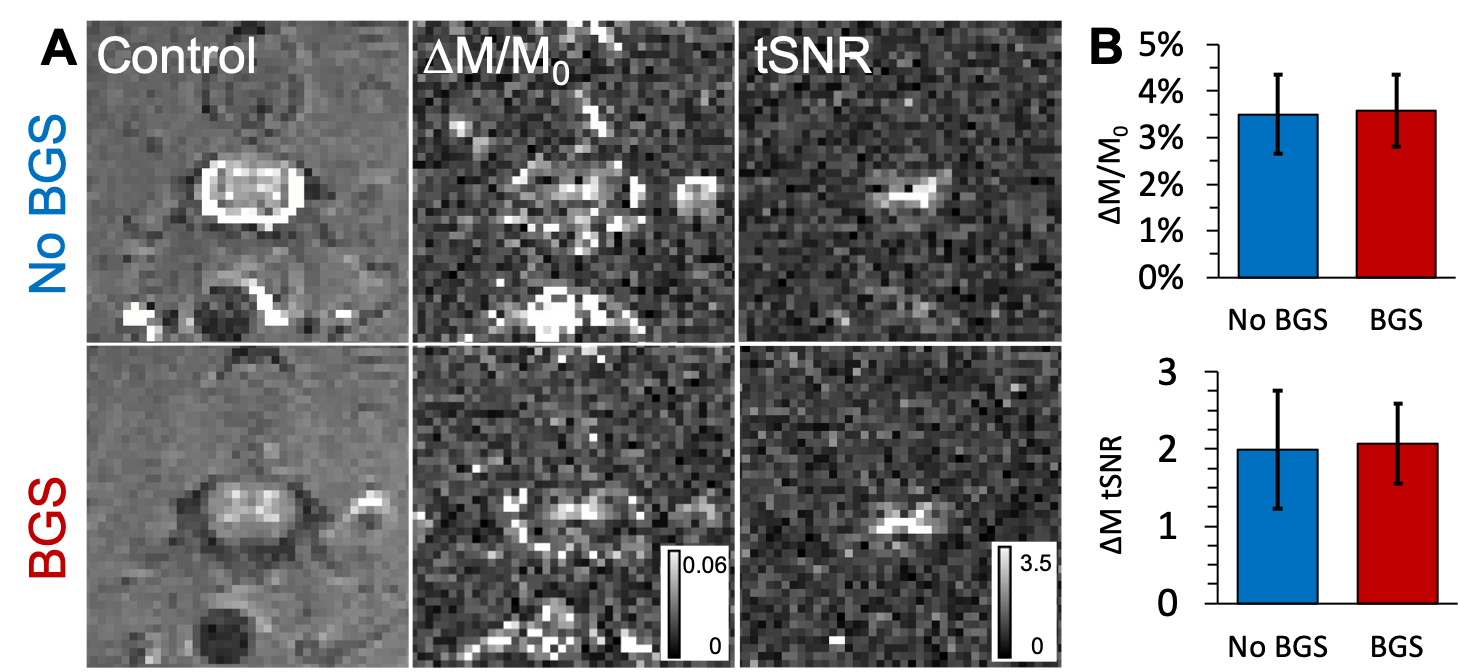
Acquisition. MRI was performed on 6 healthy female Sprague-Dawley rats using a 9.4T Bruker Biospec (Paravision 6.0.1) and positioned in a head holder inside a 38 diameter Litz coil (Doty Scientific, Inc). Phase contrast angiography images (n=2) were used to visualize the vascular anatomy of the neck. PCASL consisted of a previously-demonstrated protocol4 using a 400 µs Hanning pulse, 1 ms pulse repeat interval, 5 µT average B1 amplitude, and 45/5 mT/m Gmax/Gmean. The labeling plane was positioned perpendicular to the spinal cord at the C6 level at the magnetic isocenter. Inversion efficiency (IE) was measured with a flow-compensated gradient-echo sequence (fcFLASH) with a 200 ms labeling duration (LD), 0 ms post label delay (PLD) and additional parameters of: TR/TE=225/3.5 ms, resolution= 0.281 x 0.281 mm, 1 mm slice thickness, NEX=4. Spinal cord perfusion was evaluated with pCASL labeling combined with either a 4-shot, spin-echo echo-planar imaging (EPI) or 8-shot Rapid Acquisition with Refocused Echoes (RARE) readout, both with identical resolution and timing: TR/TE = 4000/16 ms, LD = 1200 ms, PLD = 200 ms. The effects of label duration and label-to-imaging distance were both evaluated independently. Background suppression (BGS) was employed to explicitly null cerebrospinal fluid (CSF) using Bloch simulations, resulting in a non-selective presaturation sech pulse at 3000 ms and a single selective inversion sech pulse at 1550 ms before image acquisition. Analysis. The vascular anatomy was quantified as the angular deviation between each of the carotid and vertebral arteries compared to the spinal cord main axis. PCASL inversion efficiency was measured in the carotid arteries as: IE = |(ML-MC)/2MC| where ML and MC are the complex label and control signal intensities, respectively. Image pairs of label-control were used to calculate a normalized change in magnetization (∆M/M0) and the temporal signal to noise (tSNR). Spinal cord blood flow was quantified using the standard kinetic model5 using manual regions of interest in the spinal cord gray matter.Results
The phase contrast angiography images and quantification revealed that the vertebral arteries, the main feeding arteries to the spinal cord, had angular deviations from the spinal cord axis of 10.1, 23.7, and 37.2 degrees at the C6, C7, and C8 segments, respectively. Maps of IE showed clear contrast in prominent arteries with mean values of 0.73 ± 0.09 (n=4). In the perfusion maps, there was clear contrast that suggested greater perfusion in the spinal cord gray matter compared to the white matter, as expected. Quantitatively, gray matter perfusion contrast was 3.50 ± 0.70% and using literature-reported values for T1, equates to a SCBF of 181.68 ± 45.03 mL/100 mg/ms and an average tSNR of 1.99 ± 0.77, consistent with typical pCASL values in the brain. Background suppression to null CSF did not appreciably alter the perfusion contrast (3.58 ± 0.78%) or tSNR (2.07 ± 0.52), but did noticeably improve visualization of the gray matter. Neither labeling durations between 800 and 2600 ms nor label-to-image distances between 3.6 and 9.6 mm had appreciable effects on perfusion contrast. Compared to axial EPI, sagittal EPI suffered from susceptibility artifacts. Consequently, sagittal multi-shot RARE images were evaluated and shown to have similar perfusion contrast (5.55 ± 1.48%) with clear perfusion effects throughout the C5 to C1 levels, and higher tSNR (6.97 ± 2.64) compared to axial EPI.Discussion
Altogether, we have systematically demonstrated that pCASL is a viable method to non-invasively monitor perfusion of the cervical spinal cord in an animal model. Importantly, the position of the labeling plane was optimal at the C6 level where the vertebral arteries are within the spinal foramen and perpendicular to the spinal cord. Below this level, the arteries deviate from the cord axis and from one another which could diminish inversion efficiency and increase variability6. Inversion efficiency and gray matter perfusion contrast were both comparable to typical values cited in the human brain of 0.85 and 2%, respectively6. Compared to human applications, the shorter post-label delays in the rodent restrict background suppression capabilities, but CSF nulling visually improved images without effects on quantitative values. This is likely to be different in the human where subject motion is not restricted.Conclusion
We have reported successful implementation and application of pCASL of the rodent cervical spinal cord at high field. These findings necessitate continued development of pCASL techniques for the spinal cord in animal models including traumatic injury or compression where abnormal perfusion is believed to have a critical role in patient outcomes. Likewise, similar gains in human applications may aid medical care and meet other unmet experimental and clinical needs in which perfusion of spinal cord may be implicated.Acknowledgements
We thank Natasha Wilkins and Matt Runquist for experimental assistance. This study was supported by funding from the National Institutes of Neurological Disorders and Stroke (R01NS109090).References
1. Martin, A. R., Aleksanderek, I. & Fehlings, M. G. Diagnosis and Acute Management of Spinal Cord Injury: Current Best Practices and Emerging Therapies. Curr. Trauma Reports 1, 169–181 (2015).
2. Duhamel, G., Callot, V., Cozzone, P. J. & Kober, F. Spinal cord blood flow measurement by arterial spin labeling. Magn. Reson. Med. 59, 846–854 (2008).
3. Duhamel, G. et al. Mouse lumbar and cervical spinal cord blood flow measurements by arterial spin labeling: Sensitivity optimization and first application. Magn. Reson. Med. 62, 430–439 (2009). 4. Hirschler, L. et al. Interpulse phase corrections for unbalanced pseudo-continuous arterial spin labeling at high magnetic field. Magn. Reson. Med. 79, 1314–1324 (2018).
5. Buxton, R. B. et al. A general kinetic model for quantitative perfusion imaging with arterial spin labeling. Magn. Reson. Med. 40, 383-396 (1998).
6. Alsop, D. C. et al. Recommended implementation of arterial spin-labeled Perfusion mri for clinical applications: A consensus of the ISMRM Perfusion Study group and the European consortium for ASL in dementia. Magn. Reson. Med. 73, 102–116 (2015).
Figures