0019
Multi-organ comparison of flow-based Arterial Spin Labeling techniques: brain and kidney perfusion imaging without transit time artefacts1C.J. Gorter Center for High Field MRI, Department of Radiology, Leiden University Medical Center, Leiden, Netherlands, 2Center for Image Sciences, University Medical Center Utrecht, Utrecht, Netherlands, 3Leiden Institute for Brain and Cognition, Leiden University, Leiden, Netherlands
Synopsis
Different flow-based arterial spin labeling (ASL)-techniques were proposed in recent years. In this multi-organ study four flow-based ASL-techniques were compared, with pCASL in brain, and with both pCASL and FAIR in kidney. ASL-techniques were compared based on temporal-SNR, sensitivity to perfusion changes (in brain) and robustness to respiratory motion (in kidney). In brain, Velocity-Selective Inversion showed superior temporal-SNR and sensitivity to perfusion changes. In kidney, flow-based ASL-techniques showed decreased temporal-SNR compared to FAIR, although their settings can be improved to increase robustness to B1-inhomogeneity. All ASL-techniques were relatively robust to respiratory motion, showing potential for free-breathing kidney-ASL at 3T.
Introduction
Traditionally, arterial spin labeling (ASL) employs spatially-selective labeling to generate an endogenous tracer, with pseudo-continuous ASL (pCASL) being the recommended method for brain applications1. For kidney perfusion imaging, FAIR is still the most applied labeling method2. The main downside of these spatially-selective labeling techniques is that labeled blood needs time to travel from the labeling location to the region-of-interest. Hence, perfusion values can be affected by transit-time effects1. Moreover, planning of the spatial labeling volume can be challenging and time-consuming in the abdomen. Flow-based ASL-techniques can overcome these issues, since they label also within the imaging region and do not require the planning of a labeling slab. The first flow-based ASL technique proposed was velocity-selective ASL (VSASL)3, quickly followed by acceleration-selective ASL (AccASL)4, multiple velocity-selective ASL5 (mm-VSASL, using two VS-labeling modules), and velocity-selective inversion (VSI)6 ASL.In this study we compared these flow-based ASL methods, with pCASL in brain, and with both pCASL and FAIR in kidney. In brain, their ability to detect perfusion changes was compared by using a visual task. Because of the added challenge of respiratory motion in kidney imaging, scans were performed both during paced-breathing and free-breathing. To the best of our knowledge, this is the first time that AccASL, mm-VSASL, and VSI are applied in kidney.
Methods
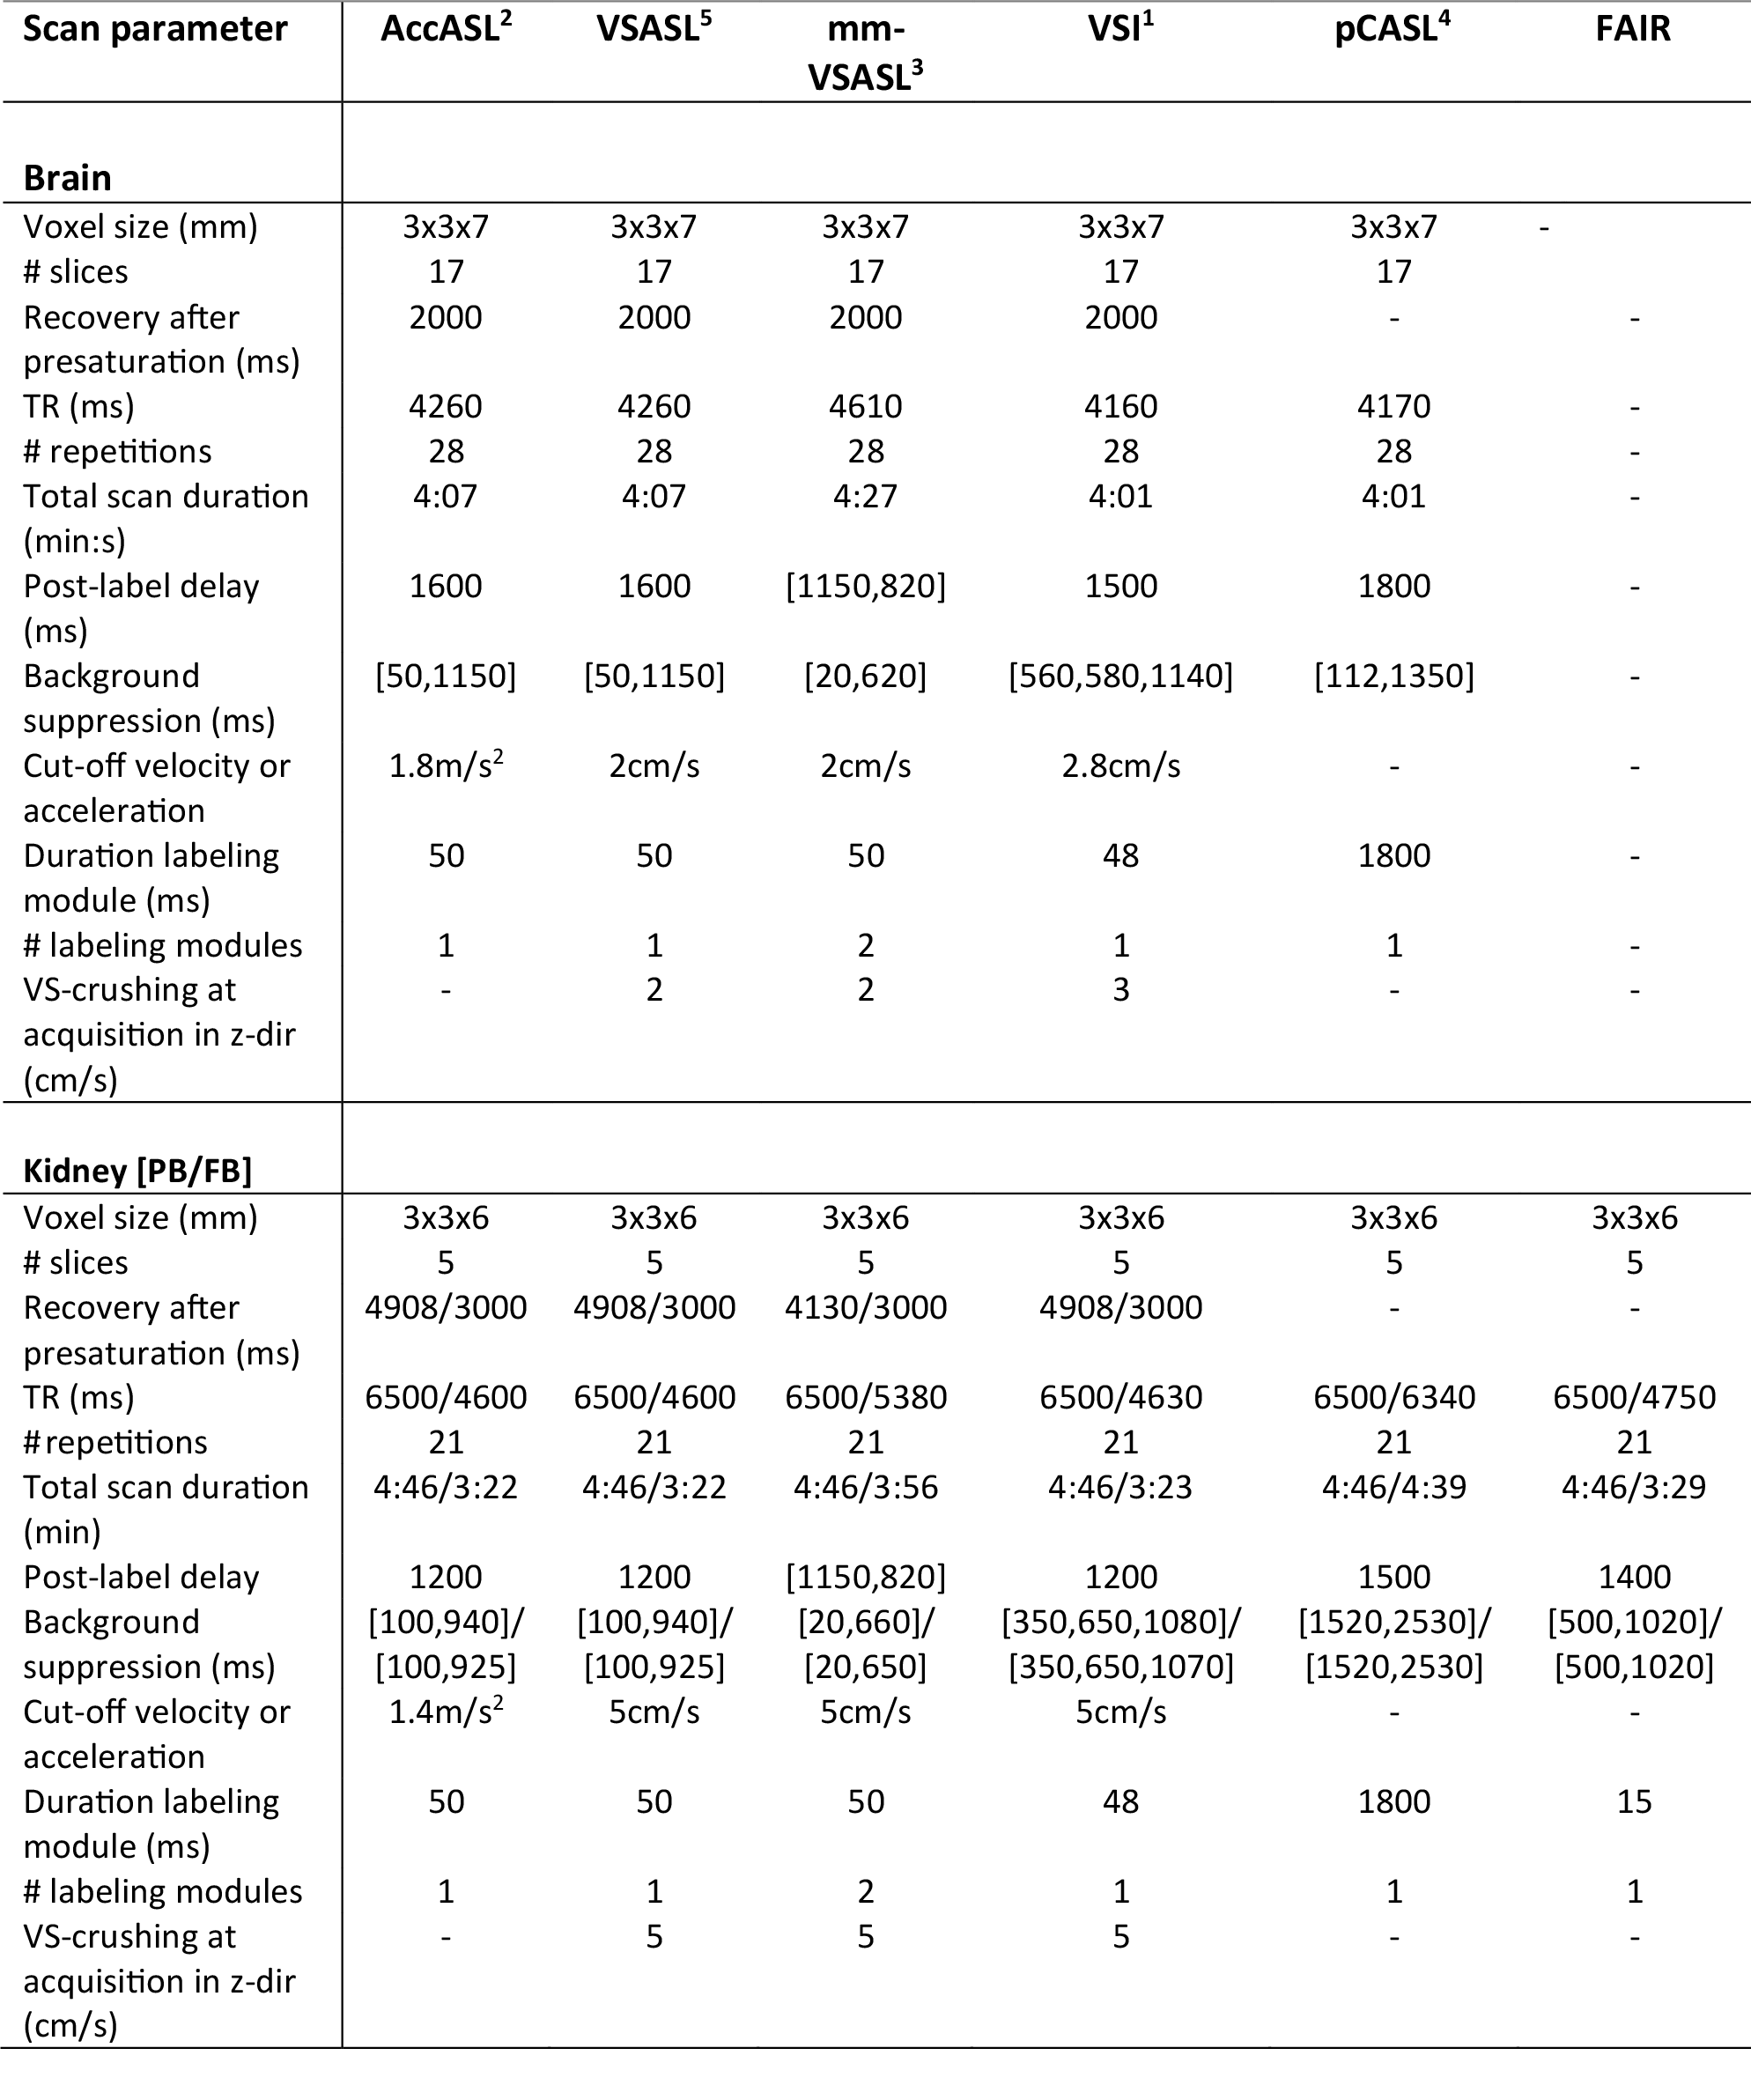
All data were acquired on 3T Philips scanners using a multi-slice EPI readout. For the brain data, five healthy volunteers were scanned (24-60 years) using a 32ch-head coil. Technique-specific scan parameters were chosen based on previous research1,3,4,5,6 (Table 1). For the kidney data, six volunteers were scanned (23-30 years) using a 28-element phased-array receiver-coil. Scan parameters optimized for kidney were not available for all ASL techniques, so they were chosen based on previous research7,8,9 and preliminary experiments. In one scan session per organ, AccASL, VSASL, mm-VSASL, VSI, and pCASL -scans were acquired twice in random order. For the brain data they were first acquired while watching a cartoon and a second time with eyes closed. For the kidney data they were first acquired in paced breathing, and a second time in free-breathing. T1 and M0 scans were acquired for normalization and segmentation. All scans were realigned and co-registered to T1, using SPM12 in brain, and a groupwise image registration method10 in kidney. Furthermore, the brain data was transformed to MNI space and smoothed (kernel width=8x8x8mm). Perfusion-weighted signal (PWS =ΔM/M0×100%) maps were normalized by dividing with M0, and temporal SNR ($$$tSNR = mean(S(t))/σ(S(t))$$$) was calculated. Gray matter and kidney cortex voxels were segmented based on the T1-scan. Student’s t-tests were performed to compare tSNR between methods and voxel-wise differences in PWS between visual stimulation and rest.Results
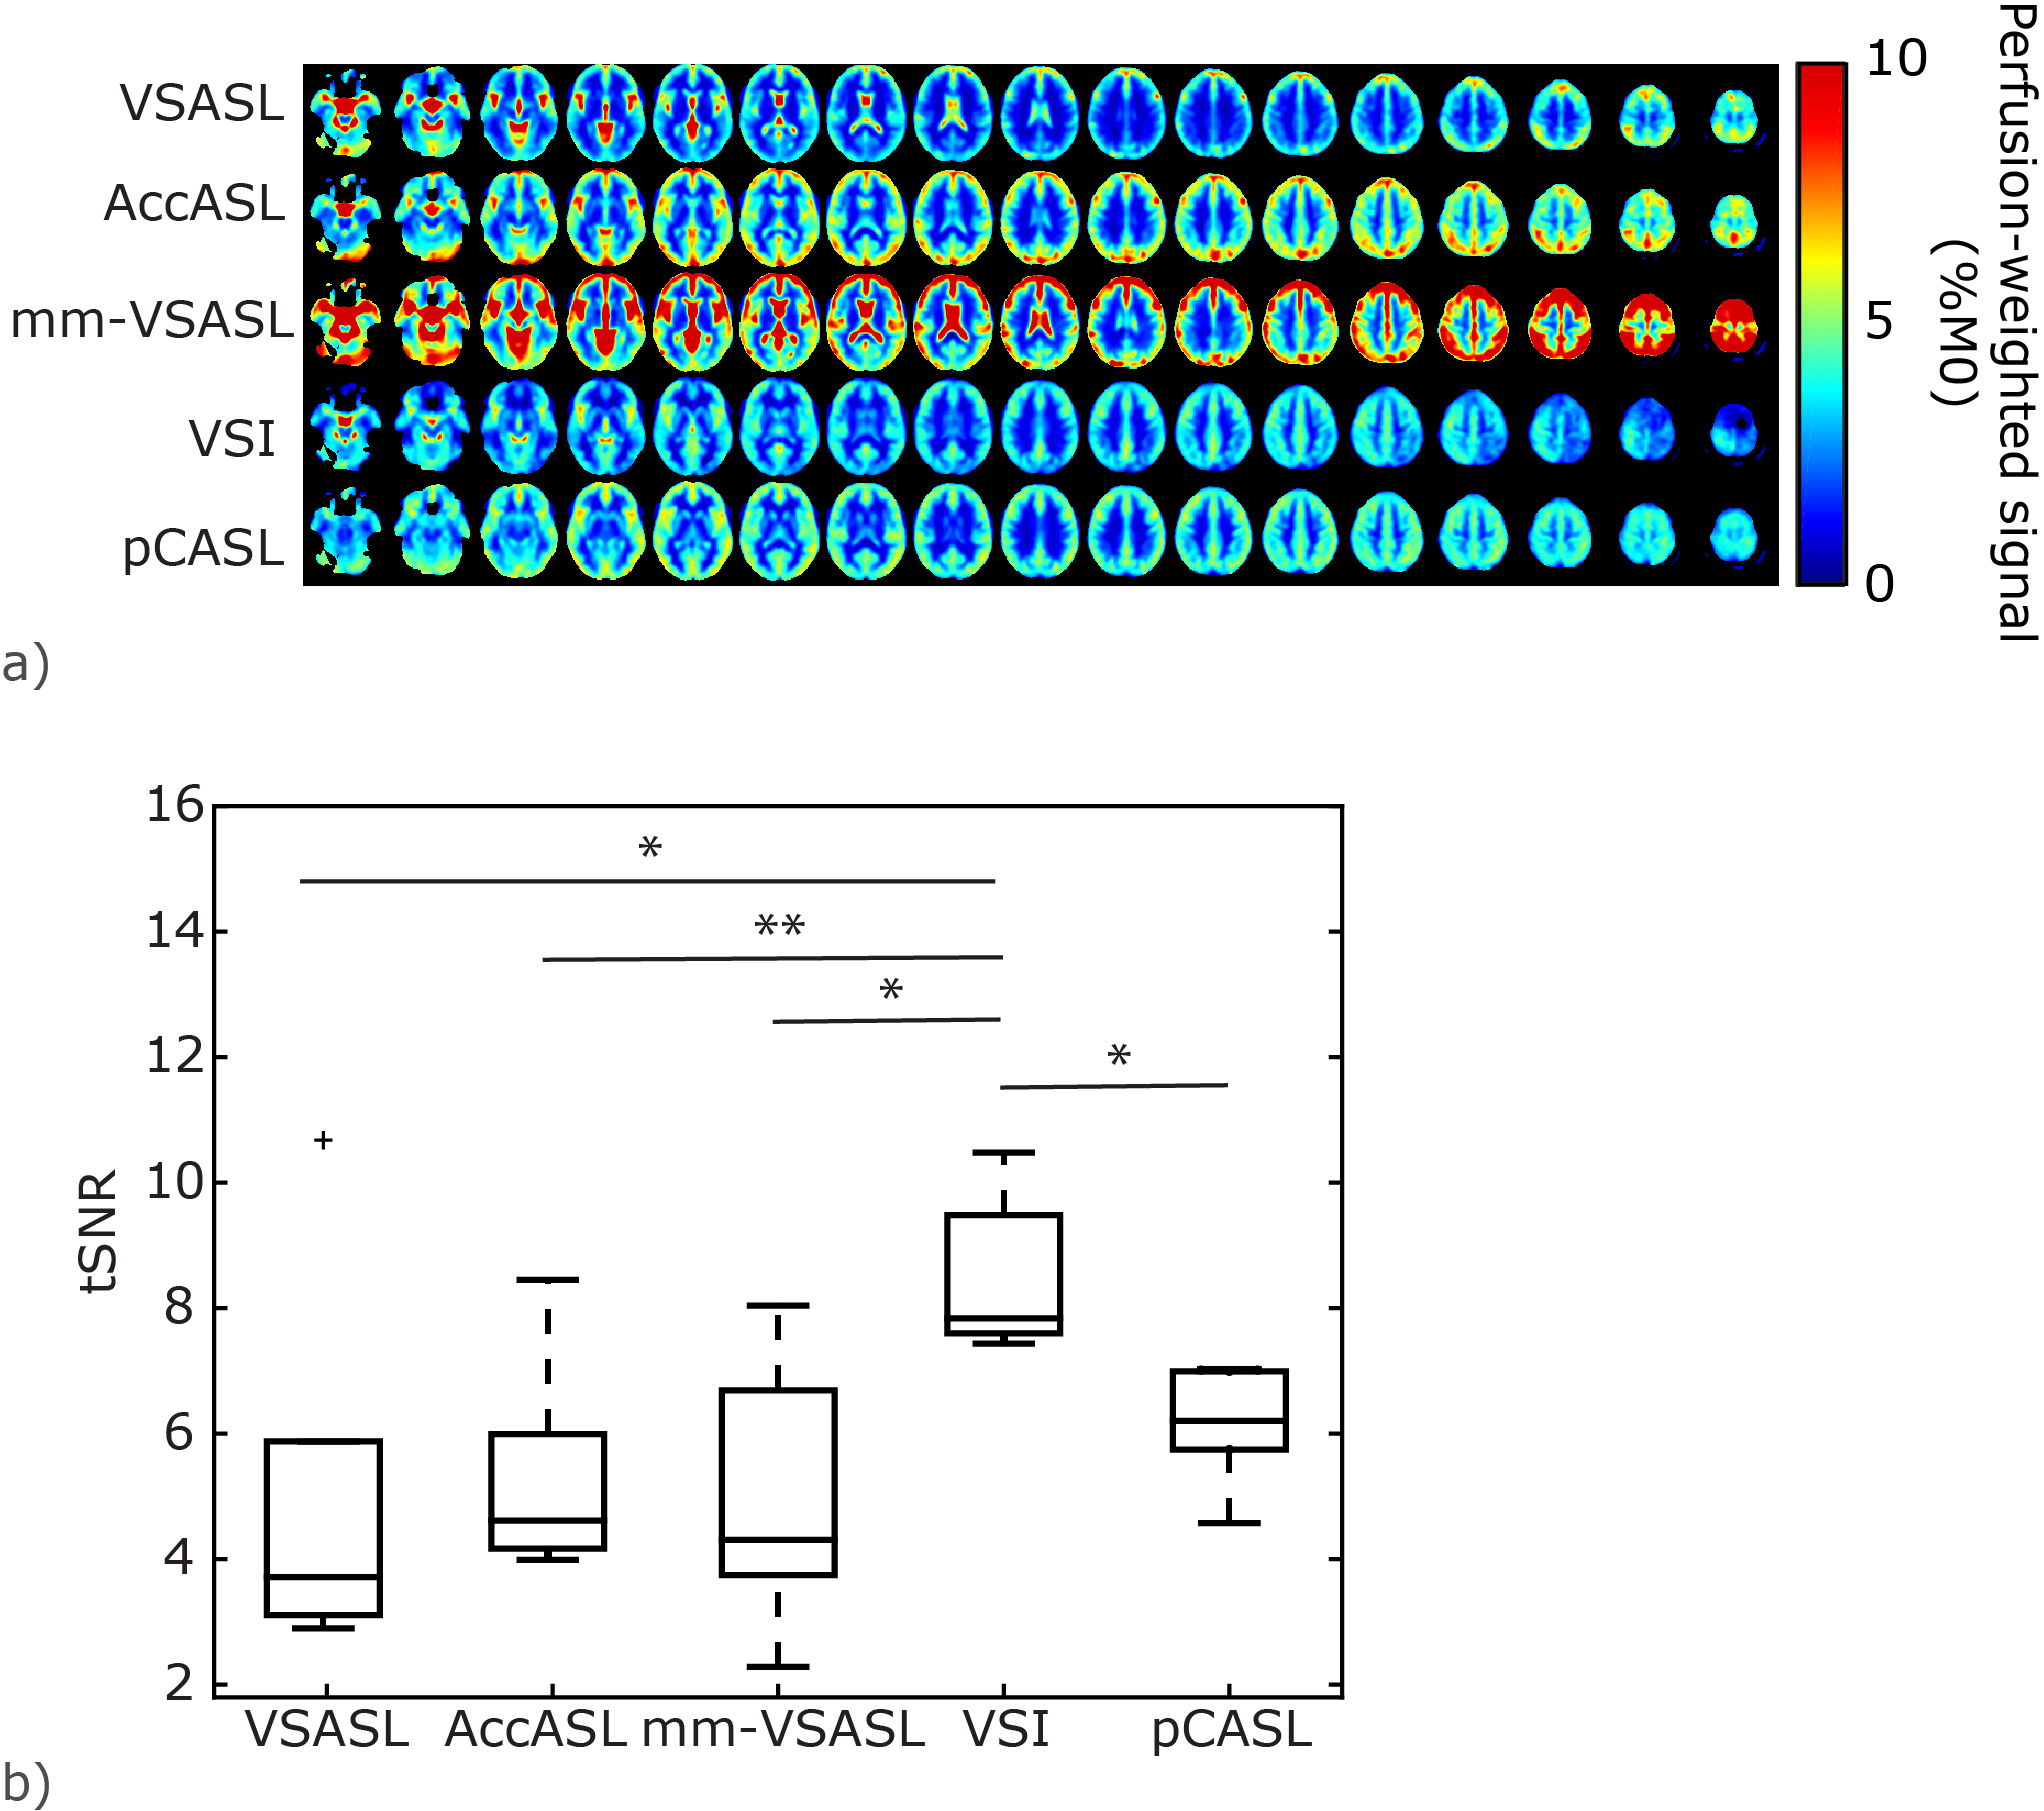
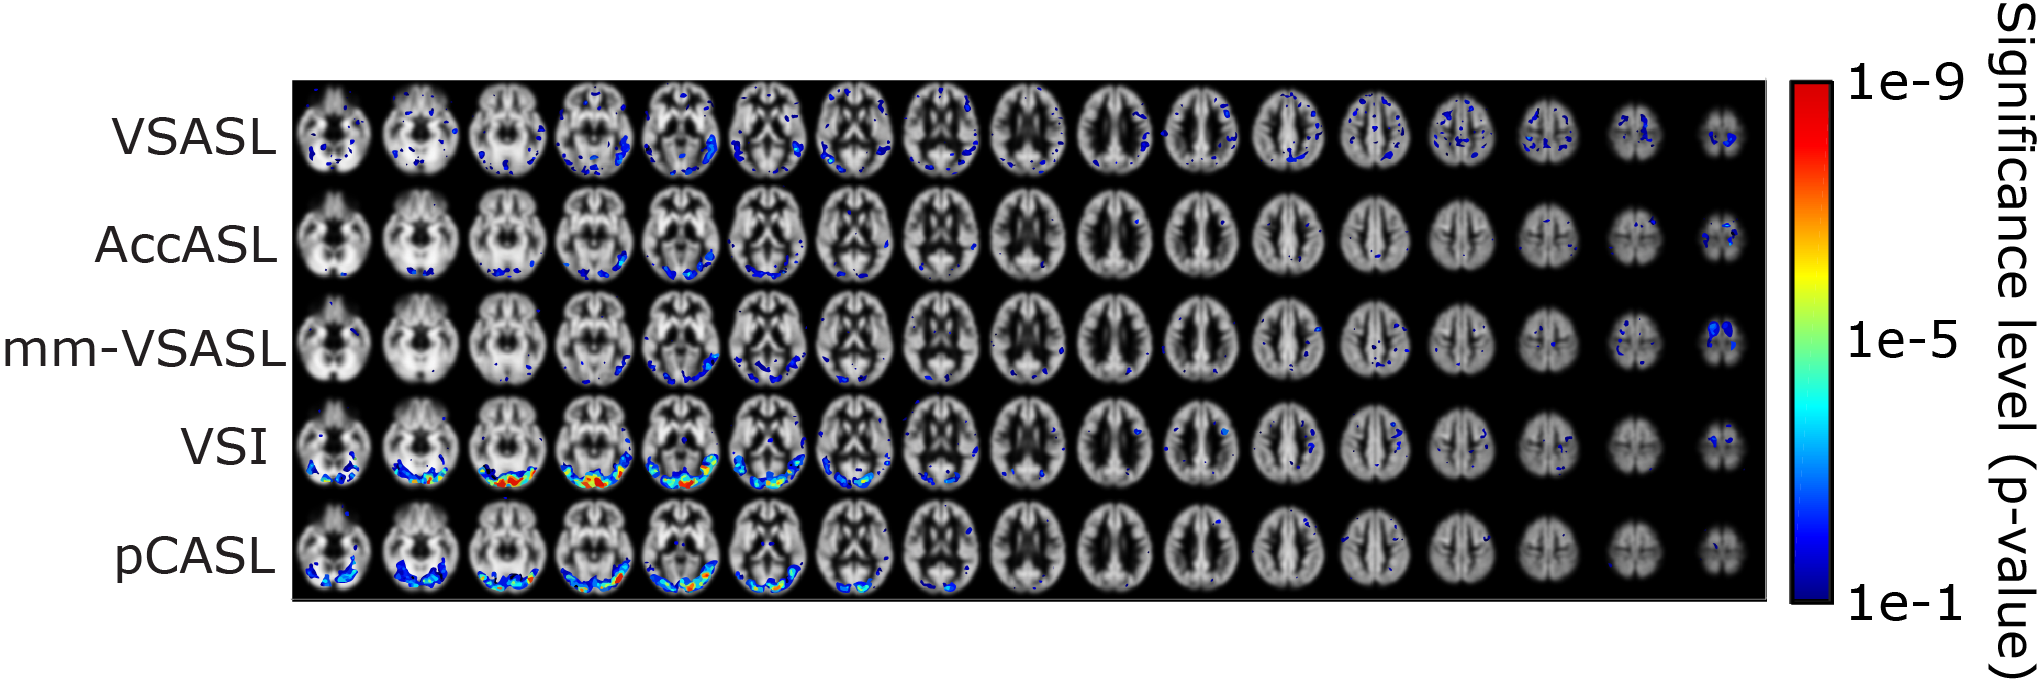
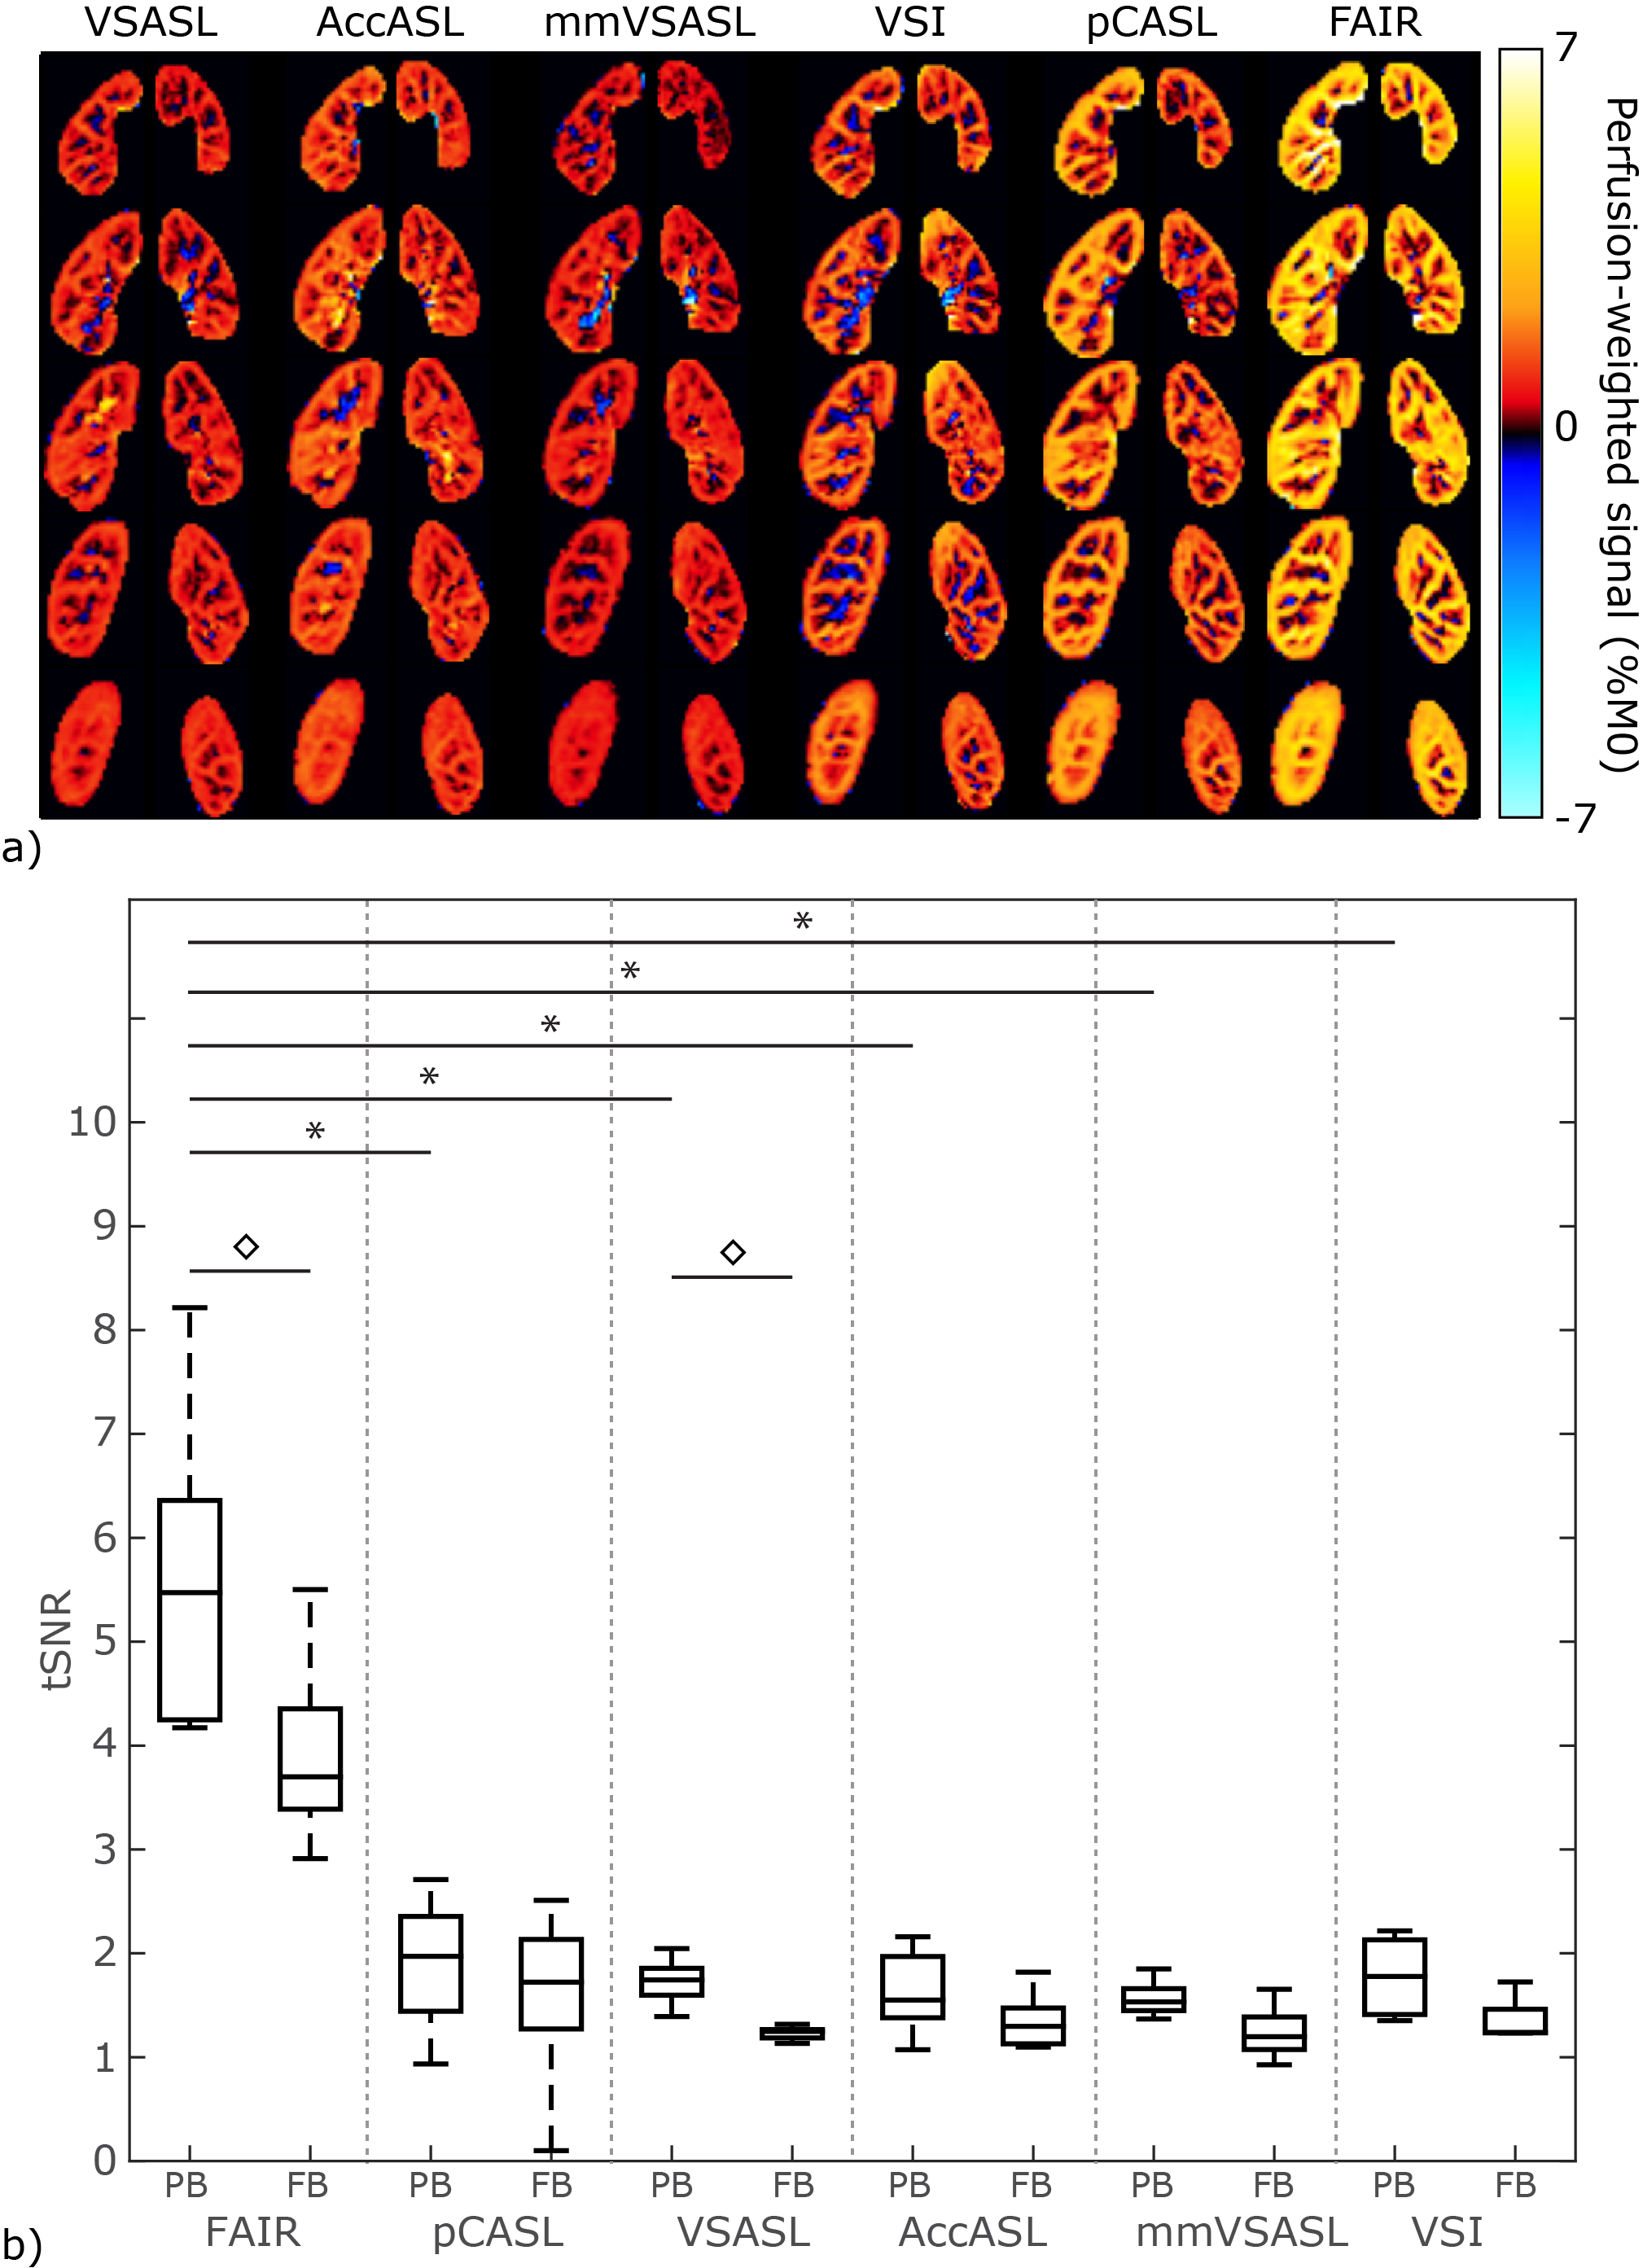
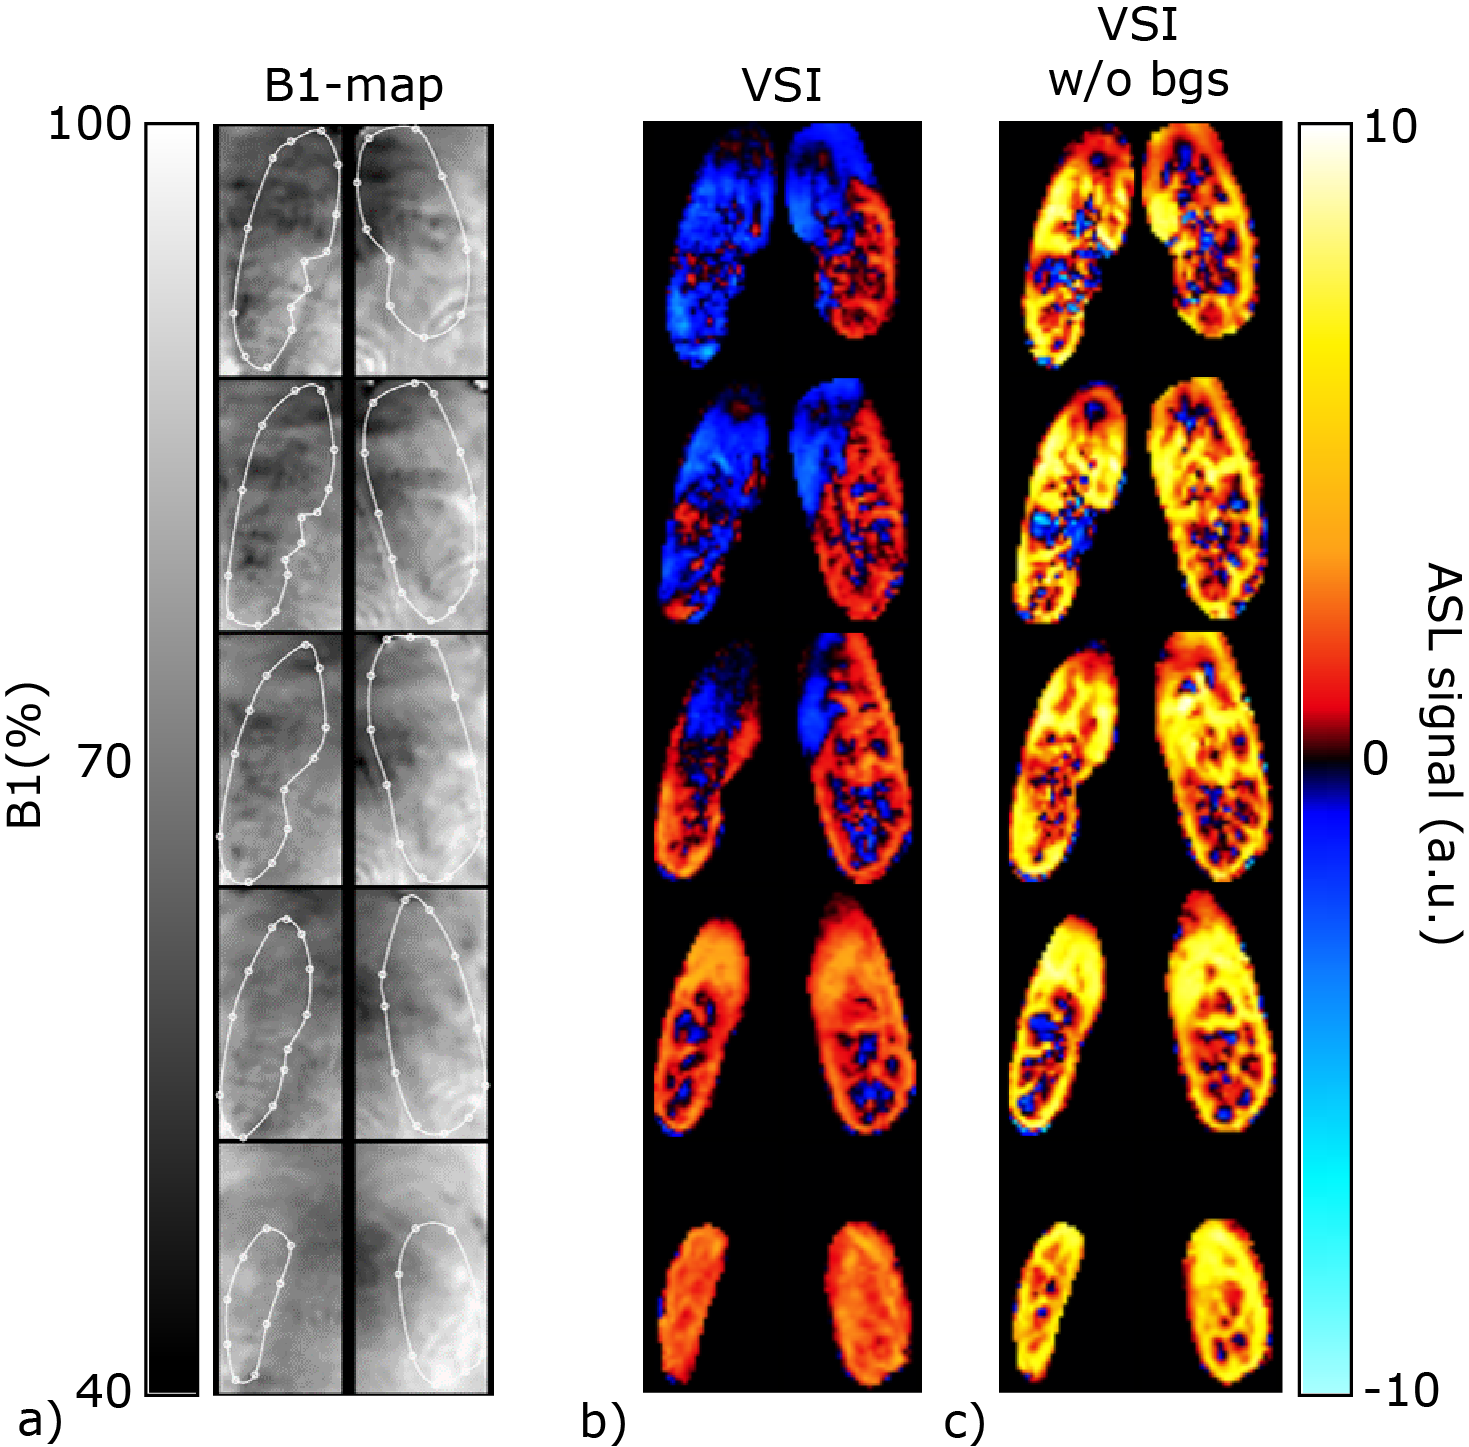
Brain: PWS maps and tSNR for all labeling methods in the brain are shown in Fig1; VSI showed a significantly higher tSNR compared with all other ASL techniques. Variation in tSNR over volunteers was comparable between VSI and pCASL, while VSASL and mm-VSASL showed a higher variability. Increased perfusion in the visual cortex during visual stimulation is most clearly present in VSI- and pCASL-images (Fig2).Kidney: One volunteer was excluded due to excessive through-slice movement. The PWS maps and tSNR in kidney, Fig3a, clearly showed higher PWS and tSNR for FAIR compared with the rest. However, a downside of FAIR, is that depending on the anatomy not the whole kidney could be covered (between 54-80% of the kidney) because inclusion of the aorta in the imaging must be avoided to allow labeling of the aortic blood. The flow-based techniques, particularly VSASL, outperform pCASL, since they show a similar tSNR with less variability over the volunteers. Small differences were observed in tSNR between paced and free-breathing for VSASL and FAIR (Fig3b). VSI in the kidney had variable success, showing severe artefacts in some volunteers, which can likely be attributed to sub-optimal background suppression pulses due to B1-inhomogeneity (Fig4). Although this effect was most severe in VSI, because it uses three background suppression pulses instead of two, also the other ASL techniques were affected at the same locations.
Discussion
Our results showed potential for VSI in the brain, both in terms of robustness of the signal and the ability to detect perfusion changes. For the kidney VSI with the current settings, it is less convincing, mainly due to B1-problems of the background suppression pulses, and possibly because of B1-sensitivity of the labeling pulses. Increased tSNR in gray matter was found for VSI compared with the gold standard (pCASL), which is especially notable since Qin (2016)5 reported similar tSNR between pCASL and VSI. In kidney, the flow-based ASL methods are still outperformed by FAIR in terms of tSNR. However, flow-based techniques do not place constraints on planning, as FAIR does, making them more time-efficient and guaranteeing whole organ coverage. Improvements of the pCASL-sequence have been proposed to make it more robust to field inhomogeneities11,12, which should be investigated in future studies. In addition, it would be valuable to have a reliable functional test to assess perfusion-sensitivity in the kidney, similar to the visual task for brain perfusion. Breathing strategy only had a minor effect on the perfusion signal showing the potential to perform free-breathing kidney-ASL at 3T.Acknowledgements
This work is part of the research programme Drag ‘n Drop ASL with project number 14951, which is (partly) financed by the Netherlands Organisation for Scientific Research (NWO). We thank MeVis Medical Solutions AG (Bremen, Germany) for providing MeVisLab medical image processing and visualization environment, which was used for image analysis.References
1. Alsop DC, Magn Res Med, 2015. 2. Odudu A, Nephrol. Dial. Transplant, 2018. 3. Wong EC, Magn Res Med, 2006. 4. Schmid S, Magn Res Med, 2014. 5. Guo J, Magn Res Med, 2015. 6. Qin Q, Magn Res Med, 2016. 7. Bones IK, Magn Res Med, 2019. 8. Bones IK, Proceedings ISMRM Conference, 2019. 9. Harteveld AA, Proceedings ISMRM Conference, 2019. 10. Huizinga W, Medical Image Analysis, 2016. 11. Zhao L, Magn Res Med, 2017. 12. Greer J, Proceedings ISMRM Conference, 2019Figures