0018
Exploring label dynamics of velocity selective arterial spin labeling in the kidney1Center for Image Sciences, University Medical Center Utrecht, Utrecht, Netherlands, 2C.J.Gorter Center for High Field MRI, Department of Radiology, Leiden University Medical Center, Leiden, Netherlands, 3Department of Radiology, University Medical Center Utrecht, Utrecht, Netherlands
Synopsis
VSASL for renal application has constraints on the cut-off velocity, as low Vc in the presence of respiratory motion causes spurious labeling of moving tissue. With higher Vc, label could be generated more upstream in the vascular tree, potentially introducing ATT sensitivity. To study label dynamics of renal VSASL using a Vc compatible with free-breathing (Vc of 10cm/s), data at multiple time points were acquired. High ASL signal was already observed at early time points, thus supporting that spatially non-selective VSASL in the kidney generates label close to, or even inside the target tissue, also using a free-breathing compatible Vc.
INTRODUCTION
Velocity selective arterial spin labeling (VSASL) is a flow-based technique that magnetically labels blood with a velocity exceeding a cut-off velocity Vc.1–3 Choosing a low Vc , label is thought even to be generated in small vessels inside the tissue, in theory reducing the dependence of ASL on arterial transit time (ATT).3,4 So far, for quantification of VSASL, Buxton’s pulsed ASL model has been utilized assuming a negligible ATT. However, for ASL of the kidneys, higher Vc are generally chosen than in e.g. the brain, since low Vc in the presence of respiratory motion causes spurious labeling of moving tissue.5 The label front could therefore shift more upstream in the vascular tree, potentially introducing ATT sensitivity. In this study, we acquired renal VSASL data at multiple time points (t) to assess its label dynamics and compared these to the label dynamics of conventional pulsed (FAIR, flow alternating inversion recovery) and pseudo-continuous ASL (pCASL).METHODS
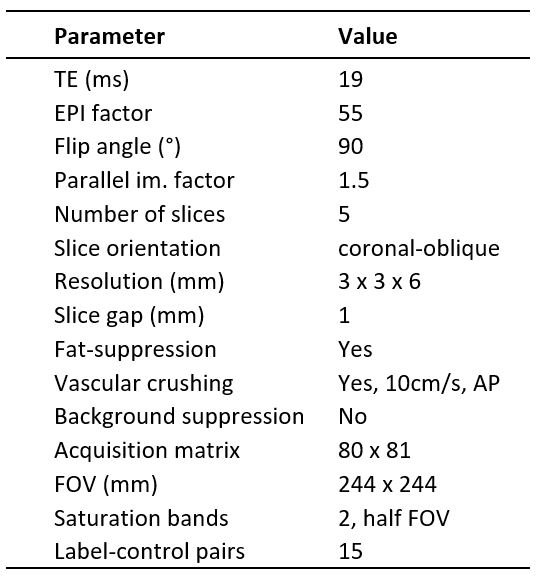
Imaging: Kidneys of 6 healthy subjects (age 25-31, 2 men) were scanned at 1.5T (Ingenia, Philips, The Netherlands) using a 28-element phased-array receiver-coil during free-breathing. Five coronal-oblique slices were acquired with a gradient echo EPI readout (Table 1) using single VSASL3, balanced pCASL6 and FAIR7. Sequence diagrams are illustrated in Figure 1.Experiments: ASL data was acquired at six time points [t: 400, 800, 1200, 2000, 2600, 3200ms] for single VSASL (Vc=10cm/s, gradient encoding=anterior-posterior), FAIR and pCASL. For pCASL, the label duration varied for measurements at different t to allow for detection of short bolus arrival times, resulting in short post labeling delays (PLDs) (Table 2). In view of short PLDs we did not apply background suppression pulses for any ASL technique. For all ASL techniques, imaging included vascular crushing gradients to reduce venous contributions and blood volume weighting from larger vessels: cut-off velocity 10cm/s in anterior-posterior direction. Per subject, a T1-map8 and M0-image were acquired.
Analysis: Images were aligned using Elastix9 with a group based principal component approach10, for each kidney separately. Subtraction images (ΔM) of all VSASL repetitions were checked for spurious labeling by visual inspection. A renal cortex region-of-interest was obtained from the T1-map. Dynamic behavior of tagged blood was assessed by calculating the perfusion-weighted signal (PWS=ΔM/M0×100%) averaged over the cortex region-of-interest for each t. Renal blood flow (RBF) was calculated by fitting Buxton’s general kinetic model11 to the multiple time point data. VSASL data was quantified using Buxton’s pulsed model including correction for diffusion weighting.12 Group averages and inter-subject variation were calculated. Statistical testing was done using Wilcoxon’s signed rank test with α=0.05.
RESULTS
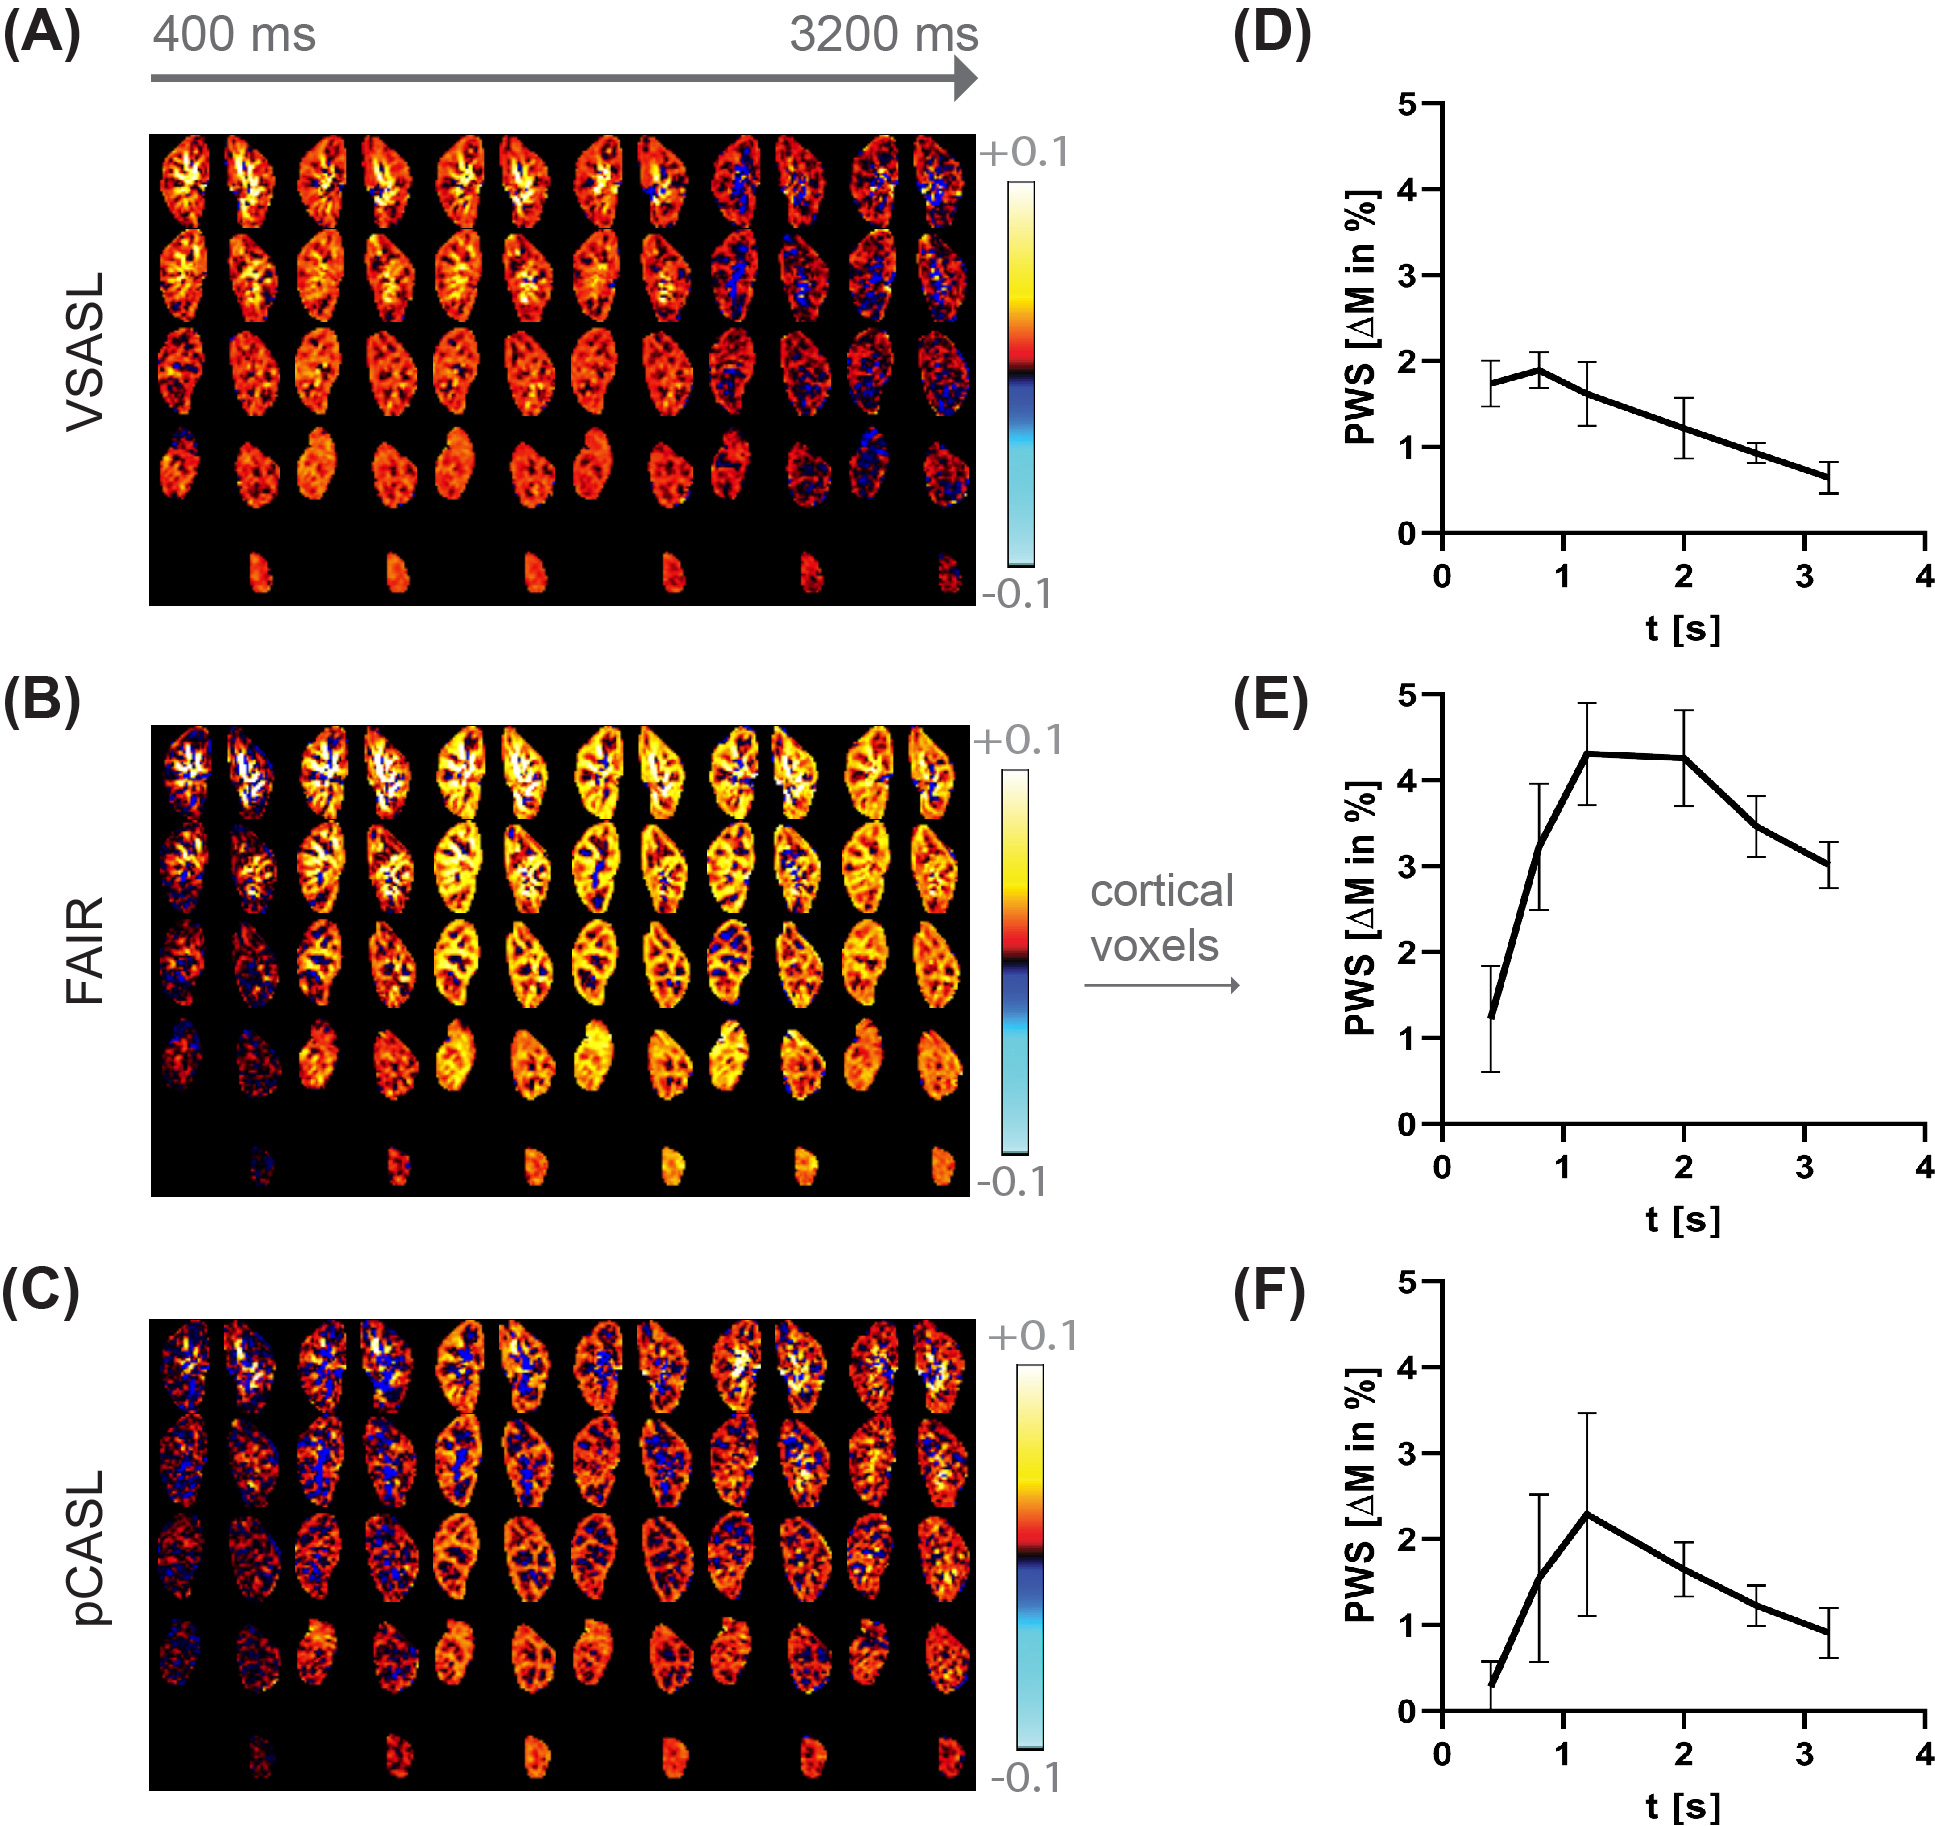
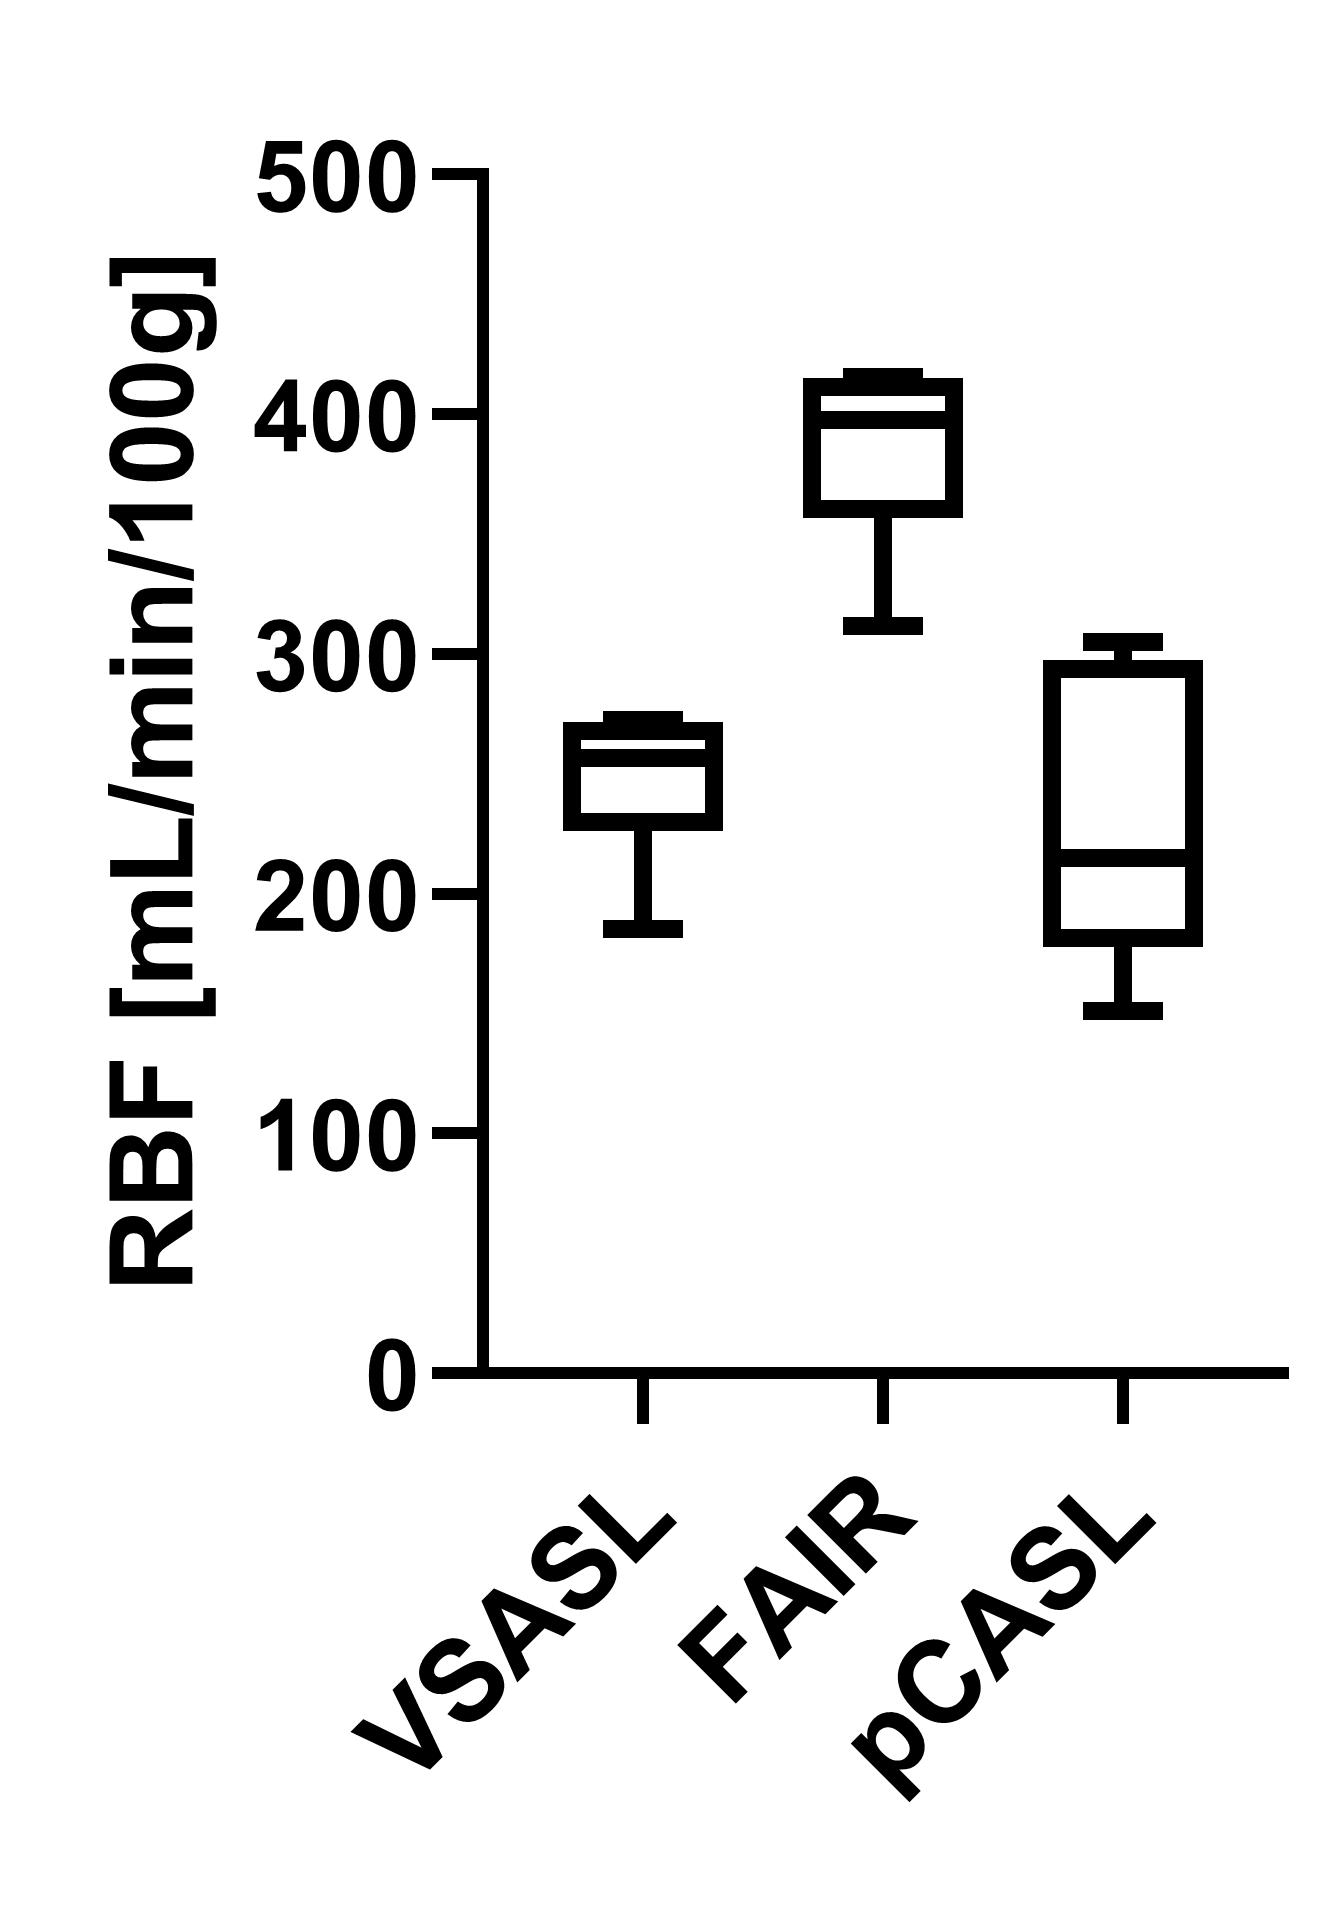
Data of all subjects were included in the analysis. With Vc=10cm/s and gradient encoding in anterior-posterior direction no spurious labeling in VSASL subtraction images was found. For VSASL the PWS measured at the earliest t=400ms is already relatively high with 92% of the peak and rises slightly until it reaches the peak at 800ms, with a steady decrease for increasing t (Figure 2A&D). In contrast, for FAIR (Figure 2B&E) and pCASL (Figure 2C&F) the PWS starts off lower with 28% and 12% of the peak, respectively (p<0.05). Also, the peak appears later, around 1200ms. Overall, FAIR delivered the highest peak PWS of 4.31±0.60%, followed by pCASL 2.29± 1.18% and VSASL 1.90±0.21% (p<0.05). Fitting of ASL data from multiple time points for all three techniques yielded the following group average cortical RBF values for FAIR 385±39 mL/min/100g, VSASL 247±33 mL/min/100g and pCASL 228±61 mL/min/100g (Figure 3).DISCUSSION & CONLUSION
For VSASL, we found high PWS already at early time points, quickly reaching the peak, followed by constant signal decrease. These findings support label generation close to, or even inside the target tissue with rapid inflow to the cortex. This is in agreement with renal physiology, as even in interlobar arteries velocities around 28cm/s were reported.13 Other factors could contribute to high PWS at early time points. First, blood volume weighting of ΔM, originating from label generation in blood already in the tissue, instead of inflow dependent perfusion weighting, even though vascular crushing was applied. Second, eddy currents could result in subtraction artefacts at early time points even with a minimum t of 400ms. Third, diffusion contribution to the VSASL signal is stronger for short t, though expected rather small with 0.05% of M0 for Vc=10cm/s.12 Our results for label dynamics of VSASL in the kidney with a Vc of 10cm/s are similar to those of VSASL in the brain with a low Vc of 2cm/s.4 Also here VSASL label dynamics differ from conventional, spatially-selective ASL techniques FAIR and pCASL. We modified Buxton’s pulsed model with diffusion weighting correction and found lower RBF for VSASL than FAIR. However, as opposed to pCASL and FAIR, the PWS time curve for VSASL has few features that anchor the model fit, using BD and ATT as free parameters, challenging fit accuracy. Assuming a blood volume-weighted signal contribution, the model should be extended for that. The results of this study support that spatially non-selective VSASL brings the labeling location closer to, or even inside the target tissue. This underlines its potential as an ATT insensitive technique, also for renal ASL where respiratory motion limits the cut-off velocity to higher values.Acknowledgements
This work is part of the research program Applied and Engineering Sciences with project number 14951 which is (partly) financed by the Netherlands Organization for Scientific Research (NWO). We thank MeVis Medical Solutions AG (Bremen, Germany) for providing MeVisLab medical image processing and visualization environment, which was used for image analysis.References
1. Norris DG, Schwarzbauer C. Velocity Selective Radiofrequency Pulse Trains. J Magn Reson. 1999;137:231-236.
2. Duhamel G, De Bazelaire C, Alsop DC. Evaluation of systematic quantification errors in velocity-selective arterial spin labeling of the brain. Magn Reson Med. 2003;50:145-153.
3. Wong EC, Cronin M, Wu WC, Inglis B, Frank LR, Liu TT. Velocity-selective arterial spin labeling. Magn Reson Med. 2006;55:1334-1341.
4. Guo J, Wong EC. Increased SNR efficiency in velocity selective arterial spin labeling using multiple velocity selective saturation modules (mm-VSASL). Magn Reson Med. 2015;74(3):694-705.
5. Bones IK, Franklin SL, Harteveld AA, et al. Influence of labeling parameters of velocity selective arterial spin labeling for renal perfusion imaging. In: Proceedings of the 27th Annual Meeting of ISMRM 2019:4948.
6. Dai W, Garcia D, De Bazelaire C, Alsop DC. Continuous flow-driven inversion for arterial spin labeling using pulsed radio frequency and gradient fields. Magn Reson Med. 2008;60(6):1488-1497.
7. Kim S-G. Quantification of Relative Cerebral Blood Flow Change by Flow-Sesitive Alternating Inversion Recovery (FAIR) Technique: Application to Functional Mapping. Magn Reson Med. 1995;34:293-301.
8. Clare S, Jezzard P. Rapid T1 mapping using multislice echo planar imaging. Magn Reson Med. 2001;45:630-634.
9. Klein S, Staring M, Murphy K, Viergever MA, Pluim J. elastix: A Toolbox for Intensity-Based Medical Image Registration. IEEE Trans Med Imaging. 2010;29(1):196-205.
10. Huizinga W, Poot DHJ, Guyader JM, et al. PCA-based groupwise image registration for quantitative MRI. Med Image Anal. 2016;29:65-78.
11. Buxton RB, Frank LR, Wong EC, Siewert B, Warach S, Edelman RR. A General Kinetic Model for Quantitative Perfusion Imaging with Arterial Spin Labeling. Magn Reson Med. 1998;40:383-396.
12. Schmid S, Ghariq E, Teeuwisse WM, Webb A, Van Osch MJP. Acceleration-selective arterial spin labeling. Magn Reson Med. 2014;71(1):191-199.
13. Deeg KH, Wörle K, Wolf A. Dopplersonographische Bestimmung von altersabhängigen Normalwerten der Flussgeschwindigkeiten und des Resistance-Index in den Nierenarterien gesunder Kinder. Ultraschall der Medizin. 2003;24(5):312-322.
Figures