0017
Differences in quantitative glioma perfusion imaging with ASL and DSC: validation with 15O-H2O PET1Institute of Radiopharmaceutical Cancer Research, Helmholtz-Zentrum Dresden-Rossendorf, Dresden, Germany, 2Neurosurgical Center Amsterdam, Amsterdam University Medical Center, location VU, Amsterdam, Netherlands, 3Department of Radiology & Nuclear Medicine, Amsterdam University Medical Center, location VU, Amsterdam, Netherlands, 4Department of Neuroradiology, Bonn University Hospital, Bonn, Germany, 5Department of Radiology and Nuclear Medicine, Erasmus MC, Rotterdam, Netherlands, 6UCL Institutes of Neurology and Healthcare Engineering, London, United Kingdom, 7Ghent Institute for Functional and Metabolic Imaging (GIfMI), Ghent University, Ghent, Belgium
Synopsis
While agreement between ASL, DSC, and PET perfusion is well established in healthy volunteers, an analogous comparison in gliomas is still missing and more challenging. We compared ASL and DSC perfusion measurements with the gold-standard of 15O-H2O-PET perfusion measurements in eight patients diagnosed with gliomas. We showed the importance of normalization to the contralateral hemisphere, and identified several examples of different regional perfusion as assessed with ASL and DSC and interpreted them using the PET reference.
Introduction
Glioma vascularization and perfusion are important diagnostic and prognostic factors that may aid in tumor grading, determining the extent of tumor infiltration and evaluation of treatment response to, e.g. antiangiogenic drugs. Perfusion can be measured with MRI using either Dynamic Susceptibility Contrast (DSC)1 or Arterial Spin Labeling (ASL)2 sequences. DSC provides a proxy estimate of perfusion by measuring mean transit time and blood volume and is sensitive to blood-brain-barrier breakdown. ASL measures true tissue perfusion and may provide similar or complementary information to DSC3. Both techniques have their shortcomings, but the gold-standard for perfusion imaging, PET measurement with a 15O-H2O tracer, is costly, invasive, and impractical in clinical settings due to very short tracer half-life. Here, we compared ASL and DSC to the PET reference to understand their benefits and limitations as a surrogate of true regional perfusion in patients with gliomas.Methods
As part of the FRONTIER study, eight glioma patients were scanned before surgery using Philips 3T Achieva MR and Gemini PET-CT4. Dynamic PET scan was acquired for 10 min after injection of 370 MBq of 15O-H2O with simultaneous online arterial blood sampling at a rate of 5 ml/min with manual samples of 9 ml each withdrawn at 5, 7, and 9 min post-injection. Pseudo-continuous ASL was acquired with a 2D EPI readout, post-labeling delay 1800 ms and labeling duration 1800ms, with background suppression, and 3x3x5 mm3 resolution. DSC was acquired with a preloaded contrast, TR/TE 1900/30ms, and 1.7x2.4x3.6 mm3 resolution.ASL cerebral blood flow (CBF) was quantified with ExploreASL5, and DSC CBF with Olea Sphere 3.0 with AIF obtained manually from the middle cerebral artery6. PET CBF maps were quantified using kinetic modeling of the dynamic PET images and the online arterial samples. The manual samples were used to calibrate the online detection system.Both the ASL and DSC images were registered to the PET images, and downsampled to the PET 6x6x6 mm3 resolution7. Tumor regions of interest (ROI) were manually delineated on the post-contrast T1-weighted and FLAIR images for the enhancing and non-enhancing tumors, respectively (Figure 1). Maximum and voxel-wise CBF was compared between modalities in the tumor ROIs and in the contralateral hemisphere gray matter (GM). Absolute and normalized CBF - divided by the mean contralateral hemisphere GM CBF - were assessed. Linear regression and joint-histograms were used to evaluate the mean and voxel-wise results.Results
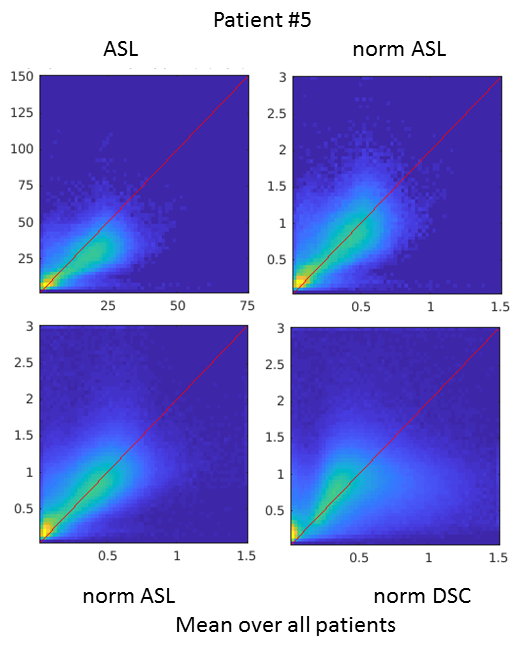
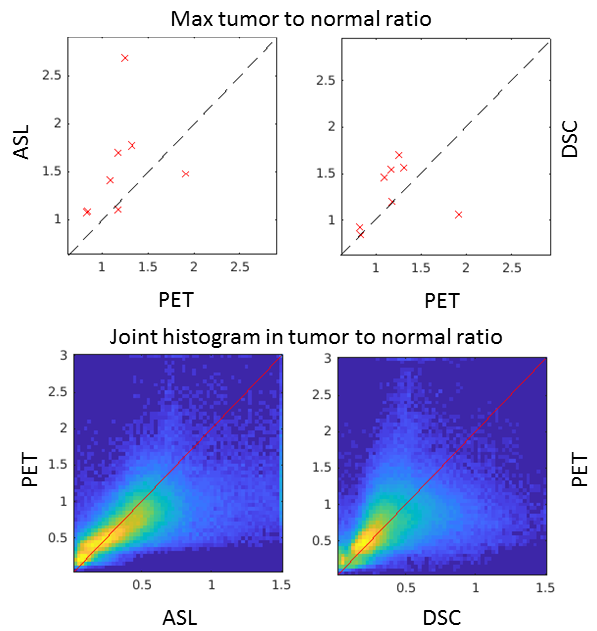
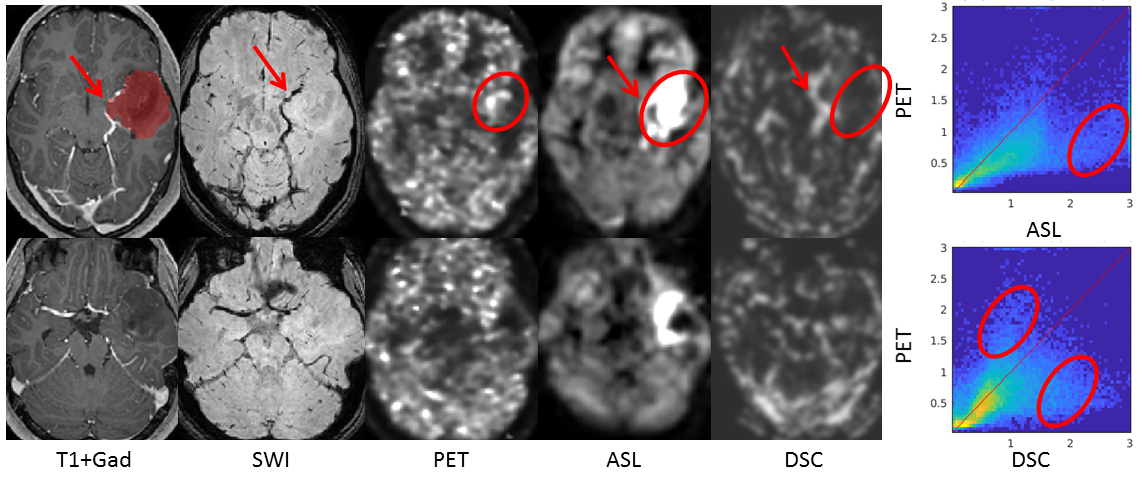
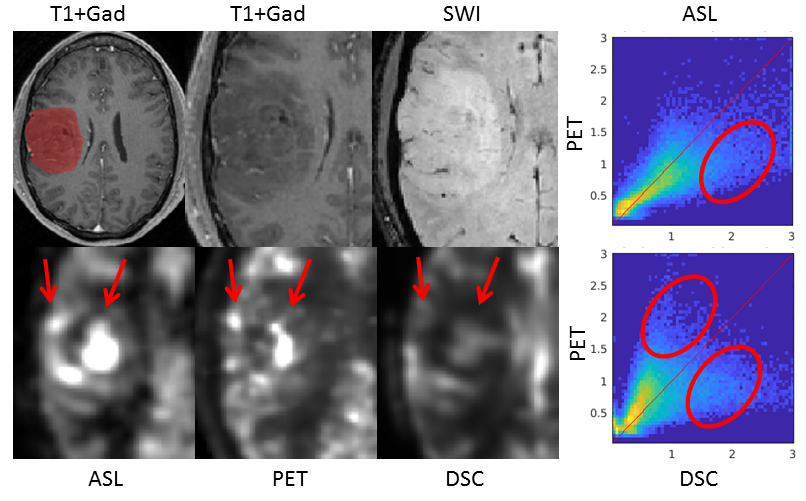
In the GM contralateral to the tumor, the absolute ASL CBF was relatively different on the individual level compared with PET (Figure 2), most probably due to labeling efficiency issues. After normalization, the values in healthy tissue were consistent between ASL, DSC, and PET.Although outliers were present in both ASL and DSC CBF, a linear relationship between modalities was observed for the maximum of normalized CBF in the tumor ROI (Figure 3). Voxel-wise analyses of normalized CBF showed good agreement between ASL and PET for low values of normalized CBF (i.e. <1.5). For high values (> 1.5), ASL tended to overestimated CBF in certain patients. Upon visual inspection, this overestimation seemed due to the presence of label in the vascular compartment in highly vascularized tumors or in cases of arterio-venous shunting (Figure 4). DSC was in agreement with PET for normalized CBF below 0.8, above this threshold DSC showed both regions of CBF overestimation and regions of no contrast accumulation despite being well-perfused according to PET (Figure 5).Discussion and conclusion
ASL has already been shown to have a reasonable agreement with PET in volunteers8. However, ASL can also partly show intravascular signal and DSC does not measure the perfusion directly, making both imaging techniques challenging in tumors. Here, we have shown good performance of both ASL and DSC by comparing to the 15O-H2O PET. We have shown that CBF normalization to contralateral GM improves the agreement of ASL/DSC and PET in tumors, after which a linear relationship in tumor-maximum was observed between all three modalities. The voxel-wise analysis, however, showed that ASL can overestimate CBF in some tumors, which may be due to the presence of vascular shunting offering a different type of contrast than tissue perfusion. We also observed increased CBF in both PET and ASL in non-enhancing tumors where CBF was underestimated by DSC. While ASL tended to overestimate CBF and pick up vascular signal, it was more sensitive than DSC to capture increased perfusion. This can provide complementary information to DSC measurements. However, we have focused on technical validation of the measurement here, and clinical utility for tumor classification or imaging or tumor infiltration still needs to be investigated.In summary, ASL presents a viable alternative to DSC with a monotonic relation to PET CBF, can present complementary information to DSC and thus warrants further research in its utility for glioma assessment.Acknowledgements
The authors acknowledge the following funding: a residency fellow grant from the Dutch Cancer Society (nr OAA/H1/VU 2015–7502 to N.V.), an institutional grant from the Cancer Centre Amsterdam (nr 2012-2-05 to P.C.W.H.), and a Netherlands Organization for Health Research and Development grant (10–10400–98-14002 to T.K.), F.B. is supported by the National Institute for Health Research University College London Hospitals biomedical research centre, and COST Action CA18206: Glioma MR Imaging 2.0.
References
- Villringer A, Rosen BR, Belliveau JW, Ackerman JL, Lauffer RB, Buxton RB, Chao YS, Wedeen VJ, Brady TJ. Dynamic imaging with lanthanide chelates in normal brain: contrast due to magnetic‐susceptibility effects. Magn Reson Med 1988; 6:164–174.
- Alsop DC, Detre JA, Golay X, Günther M, Hendrikse J, Hernandez‐Garcia L, Lu H, MacIntosh BJ, Parkes LM, Smits M, Van Osch MJ. Recommended implementation of arterial spin‐labeled perfusion MRI for clinical applications: a consensus of the ISMRM perfusion study group and the European consortium for ASL in dementia. Magnetic resonance in medicine. 2015 Jan;73(1):102-16.
- Rau MK, Braun C, Skardelly M, Schittenhelm J, Paulsen F, Bender B, Ernemann U, Bisdas S. Prognostic value of blood flow estimated by arterial spin labeling and dynamic susceptibility contrast-enhanced MR imaging in high-grade gliomas. Journal of neuro-oncology. 2014 Dec 1;120(3):557-66.
- Verburg N, Pouwels PJ, Boellaard R, Barkhof F, Hoekstra OS, Reijneveld JC, Vandertop WP, Wesseling P, de Witt Hamer PC. Accurate Delineation of Glioma Infiltration by Advanced PET/MR Neuro-Imaging (FRONTIER Study) A Diagnostic Study Protocol. Neurosurgery. 2016 Oct 1;79(4):535-40.
- Mutsaerts, H. J., Petr, J., Groot, P., Ingala, S., Robertson, A., Vaclavu, L., … Barkhof, F. (2019). ExploreASL: a collaborative effort to process and explore multi-center ASL data. In ISMRM ’19: Proceedings of the ISMRM 27th Annual Meeting & Exhibition (Vol. 27, p. 2705). International Society for Magnetic Resonance in Medicine.
- Bleeker EJ, Van Buchem MA, Van Osch MJ. Optimal location for arterial input function measurements near the middle cerebral artery in first-pass perfusion MRI. Journal of Cerebral Blood Flow & Metabolism. 2009 Apr;29(4):840-52.
- Cardoso MJ, Modat M, Vercauteren T, Ourselin S. Scale factor point spread function matching: beyond aliasing in image resampling. InInternational Conference on Medical Image Computing and Computer-Assisted Intervention 2015 Oct 5 (pp. 675-683). Springer, Cham.
- Heijtel DF, Mutsaerts HJ, Bakker E, Schober P, Stevens MF, Petersen ET, van Berckel BN, Majoie CB, Booij J, van Osch MJ, Boellaard R. Accuracy and precision of pseudo-continuous arterial spin labeling perfusion during baseline and hypercapnia: a head-to-head comparison with 15O H2O positron emission tomography. Neuroimage. 2014 May 15;92:182-92.
Figures