0014
Gd3+ Deposition as an Underestimated Hazard? – Potential Masking of Gadolinium Long-Term Deposition in Biological Regimes1Leibniz-Forschungsinstitut fuer Molekulare Pharmakologie (FMP), Berlin, Germany, 2BIOphysical Quantitative Imaging Towards Clinical Diagnosis (BIOQIC), Berlin, Germany, 3Center for Cardiovascular Research (CCR), Charite Berlin, Berlin, Germany, 4Freie Universität Berlin, Berlin, Germany, 5Department of Radiology, Charite Berlin, Berlin, Germany
Synopsis
Gd3+-ions can be released from GBCAs after in vivo application and polysaccharides like glycosaminoglycans are candidates for binding of released Gd3+-ions by acting as competing chelators. We showed that the chelation of Gd3+-ions to polysaccharides cause an increase of R1 due to the high relaxivity of such complexes. However, at high GAG/Gd3+ ratios and in cell experiments, we observed a decrease of R1 after the chelation of Gd3+. Our results demonstrate the importance of more in vivo-like setups for the investigation of gadolinium transchelation processes to prevent an underestimation of the amount of deposited gadolinium in biological tissues.
Purpose:
Gadolinium-based contrast agents (GBCA) can dissociate in the presence of divalent, endogenous ions like Zn²⁺ [1], because particularly linear GBCAs show a lack of stability. This might cause the release of Gd3+-ions and their deposition in biological tissues, which was repeatedly observed in T1-weighted images of patients that received multiple GBCA administrations [2-4]. However, the exact mechanisms leading to long-term depositions in the body are still unknown and are a highly discussed topic [1-4]. The observed hyperintensities are most likely caused by Gd3+-containing macromolecular structures with low tumbling rates and thus high relaxivities [4]. It was shown that glycosaminoglycans (GAGs) as components of the extracellular matrix are candidates for such macromolecular structures since they might act as competing chelators [1]. Nevertheless, such gadolinium-GAG complexes are a hardly studied topic. In this study, chondriotinsulfate A (CSA) in aqueous solution and THP-1 cells [5] with a well-studied glycocalix, which consists to a great extent of CSA, were used to investigate the possible transchelation process of Gd3+-ions to GAG structures under in vivo-like conditions in cell-suspensions.Methods and materials
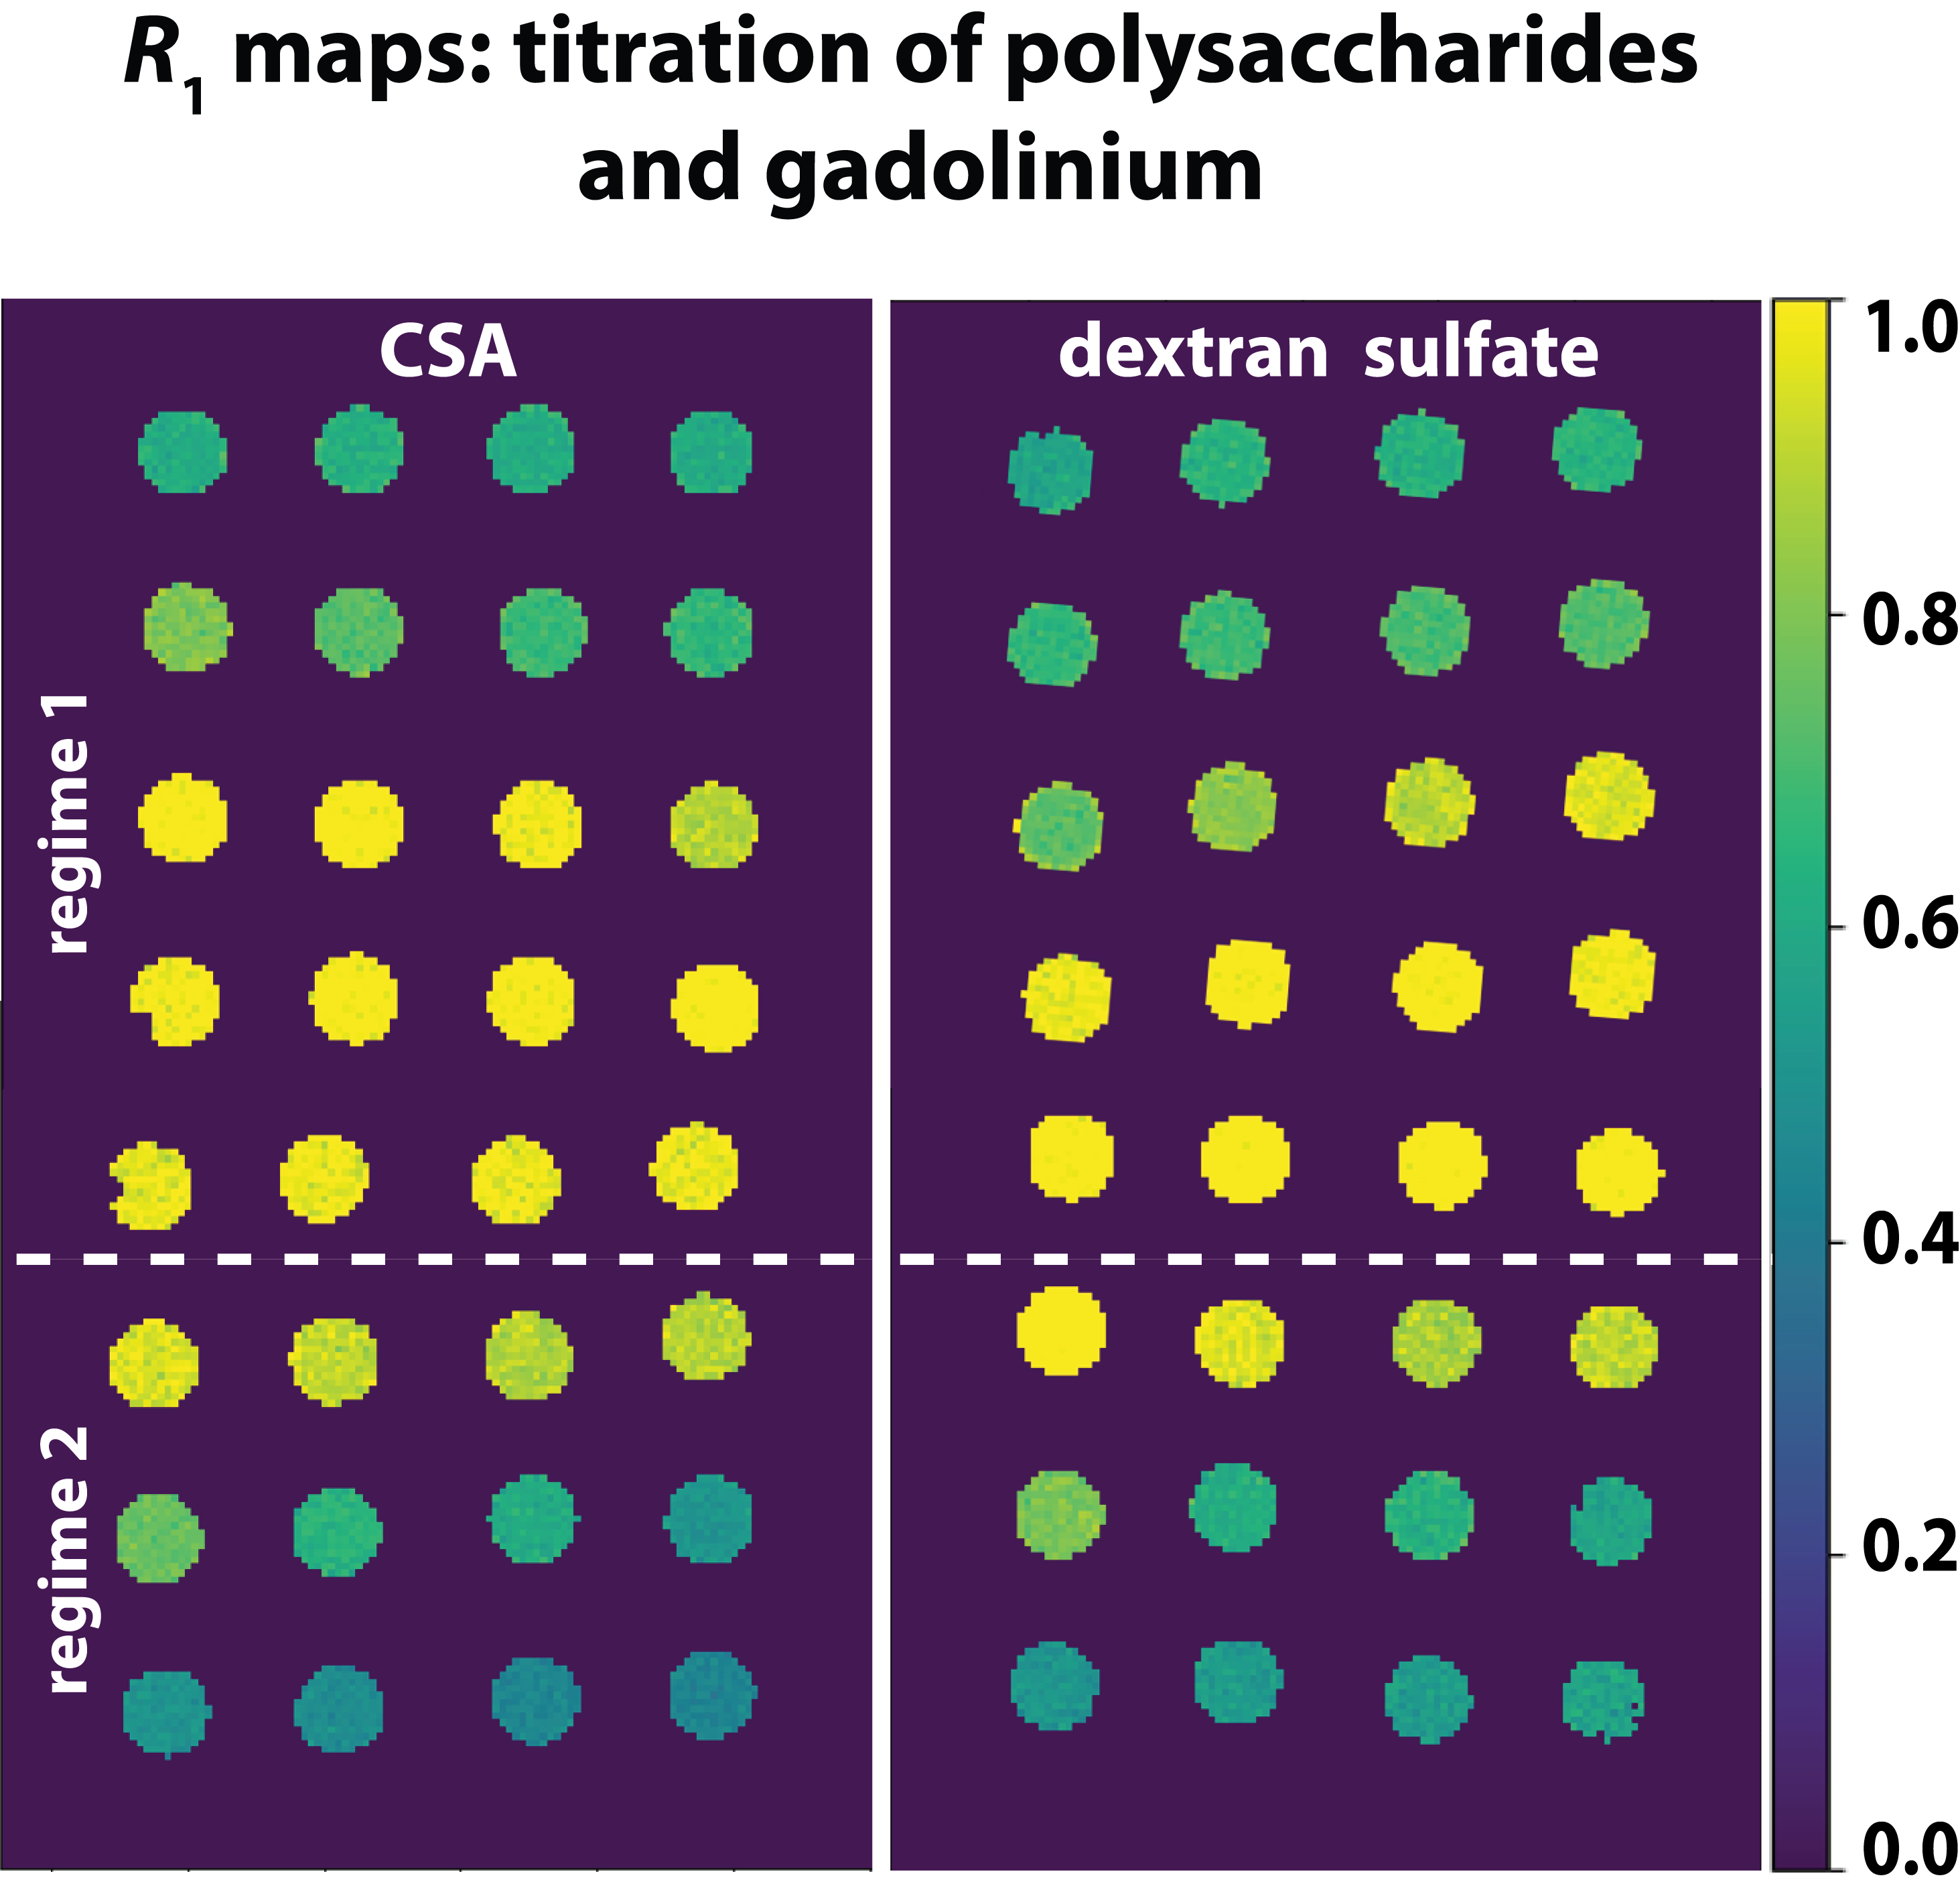
THP-1 cells were cultured in RPMI medium with 1% PLS and 10% of FCS. After centrifugation of approx. 6 million cells, they were washed and resuspended with HEPES buffer (pH = 7.4). The cell suspension was mixed with GdCl3 to achieve a final sample of 200 µl with 25 µM of GdCl3 in solution. T1-relaxation time measurements of the suspension and of the cell supernatant were performed. CSA and dextran sulfate in combination with GdCl3 were used as a simplified system to model the chelation processes of Gd3+-ions to GAGs. All MR measurements were performed on a 9.4 T preclinical MRI system (Bruker, Ettlingen, Germany). T1 measurements were performed using a dephasing recovery sequence consisting of 50 π/2 pulses with subsequent gradient spoiling and image acquisition. R1 values were calculated from ROI-averaged values from R1 maps (Fig. 1).Results
The results of the cell experiments show decreasing R1 values from 0.46 s-1 to 0.41 s-1 18 min after the addition of Gd3+-ions. However, no changes could be observed in water with an equivalent amount of Gd3+-ions (Fig. 2). To exclude that sedimentation of the cells is causing this effect, the solutions were remixed and measured again (Fig. 3) confirming the observed reduction of R1. In the model solutions (Gd3+ in CSA and dextran sulfate), R1 enhancements were observed upon interaction between these polysaccharides and Gd3+ followed by an decrease of R1 with increasing GAG/Gd3+-ratios (Fig. 4). The plots show R1 as a function of the concentration ratio between the different polysaccharides and Gd3+ in solution. R1 increases from 0.6 s-1 (R1 of 25 μM Gd3+ in H2O) to 1.05 s-1 in CSA (Fig. 4A) and to 0.84 s-1 in dextran sulfate (Fig. 4B). The maxima are reached at ratios of ~10 and ~0.3 for CSA and dextran sulfate, respectively. Subsequently, R1 decreases to about 0.35 s-1 at a ratio of 300 for dextran sulfate and to about 0.43 s-1 at a ratio of 2000 for CSA (Fig. 4A,B). In both cases, the last point is almost identical with the R1 value of pure water (R1 of pure H2O: 0.34s-1).Discussion
Glycosaminoglycans are an essential part of the ECM throughout the human body and have a high chelation potential for metal ions. The distribution of these structures is very heterogeneous and has local hotspots throughout the body. It could be proven that gadolinium binding to GAGs leads to increased R1 values, which could underpin the role of these complexes in the observed hyperintensities in biological tissues [1]. The binding of Gd3+ to macromolecules causes a decreased tumbling rate compared to free Gd3+-ions in solution, which leads to a higher relaxivity. Nevertheless, contrary to this initial trend at low [GAG]/[Gd3+] ratios, a signal loss due to reduced relaxivity occurs for high [GAG]/[Gd3+]-ratios. The increasing number of available coordination sides from the sulfate groups of the polysaccharides presumably causes a coordination of the Gd3+-ions in a way that does not involve any water in the inner sphere. This lowers the influence of the gadolinium on R1 of the bulk water and is masking the real amount of deposited gadolinium ions. Eventually, the intrinsic R1 of water can be reached for even higher ratios. In experiments with THP-1 cells, the same effect of decreasing R1 values could be observed and correlated to the binding of Gd3+-ions to the glycocalyx of the cells, where water seems to have no direct excess to the paramagnetic ions. Our quantifications show that about 67% of the gadolinium ions that were added to the cell suspension in form of GdCl3 were bound and silenced by the interaction with THP-1 cells.Conclusion
Our results show that the binding of Gd3+-ions to glycosaminoglycans can cause an increase or a decrease of R1, depending on the experimental conditions. Besides the well documented hyperintense signals it is therefore possible for certain endogenous structures like glycosaminoglycans of the glycocalyx of cells to `silence’ the released Gd3+-ions after chelation. This raises the question if the amount of deposited gadolinium in biological tissues was underestimated over the last years, when investigated by means of MR relaxometry.Acknowledgements
No acknowledgement found.References
1. Taupitz, M., Stolzenburg, N., Ebert, M., Schnorr, J., Hauptmann, R., Kratz, H., ... & Wagner, S. (2013). Gadolinium‐containing magnetic resonance contrast media: investigation on the possible transchelation of Gd3+ to the glycosaminoglycan heparin. Contrast media & molecular imaging, 8(2), 108-116.
2. Kanda, T., Ishii, K., Kawaguchi, H., Kitajima, K., & Takenaka, D. (2013). High signal intensity in the dentate nucleus and globus pallidus on unenhanced T1-weighted MR images: relationship with increasing cumulative dose of a gadolinium-based contrast material. Radiology, 270(3), 834-841.
3. Radbruch, A., Weberling, L. D., Kieslich, P. J., Eidel, O., Burth, S., Kickingereder, P., ... & Bendszus, M. (2015). Gadolinium retention in the dentate nucleus and globus pallidus is dependent on the class of contrast agent. Radiology, 275(3), 783-791.
4. Gianolio, E., Gregorio, E. D., & Aime, S. (2019). Chemical Insights into the Issues of Gd Retention in the Brain and Other Tissues Upon the Administration of Gd‐Containing MRI Contrast Agents. European Journal of Inorganic Chemistry, 2019(2), 137-151.
5. Tsuchiya, S., Yamabe, M., Yamaguchi, Y., Kobayashi, Y., Konno, T., & Tada, K. (1980). Establishment and characterization of a human acute monocytic leukemia cell line (THP‐1). International journal of cancer, 26(2), 171-176.
Figures
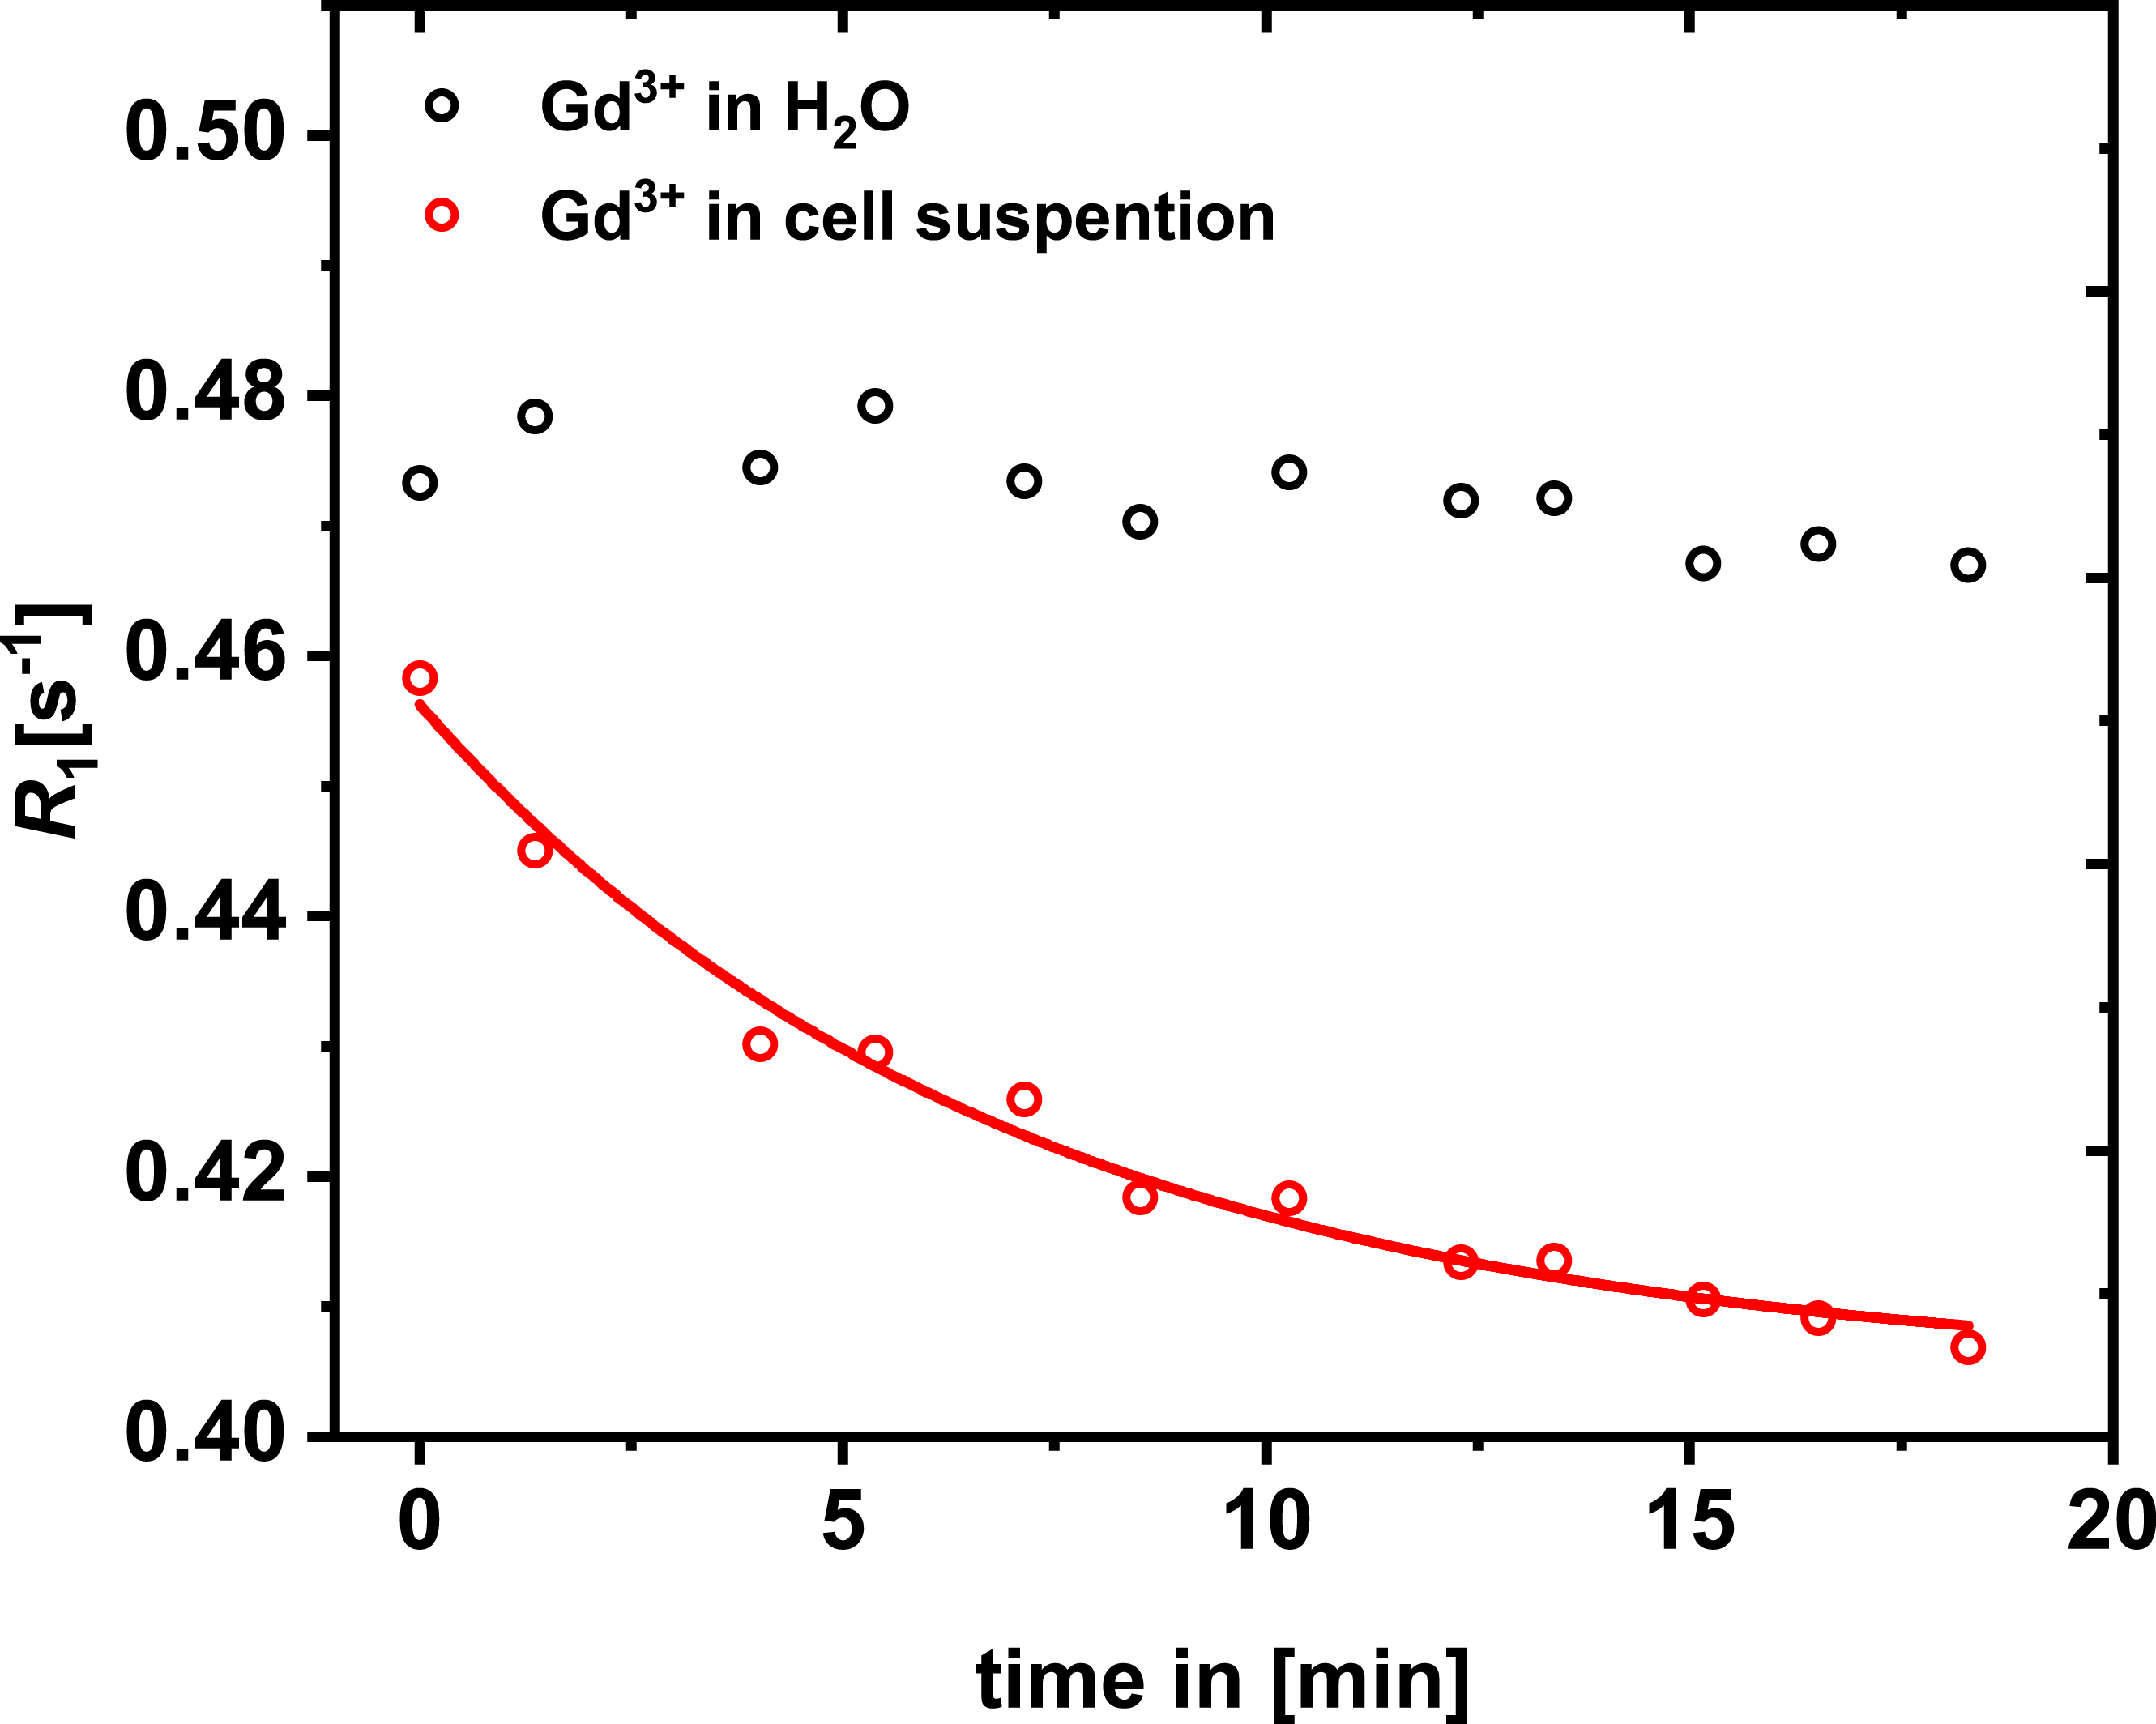

R1 maps of a aqueous control solution and a resuspented THP-1 cell sample with the same amount of added Gd3+-ions. A signal decrease can be observed in the cell suspension compaired to the control solution.
