0012
Unsupervised neural networks to improve quantitative DCE modelling1The Institute of Cancer Research and Royal Marsden NHS Foundation Trust, London, United Kingdom, 2Centre for Big Data Research in Health, University of New South Wales, Sydney, Australia
Synopsis
We introduce a novel approach to fitting parameters from DCE MRI using an unsupervised neural network. The network is trained on in vivo data, with no ground truth, and is able to predicts DCE model parameters directly from the obtained MRI images. In simulations, our method outperformed the ordinary least squares fit approach in that it is more accurate and precise. In vivo, it produced substantially less noisy parameter maps than the current practise least-squares fit.
Introduction
Although quantitative DCE has shown promising results in studies looking at classification and treatment response assessment of various sites [1,2], it is not routinely used as a decision-making tool, for example for, treatment adaptation. One reason for this, is that the standard approach of least-squares fitting of advanced models to dynamic contrast-enhanced (DCE) MRI data, such as the extended Tofts model [3], is inaccurate (test-retest coefficient of variation in the order of 20% [4]) and time-consuming. Improving the fitting algorithm could help introduce DCE into a clinical routine and improve treatment efficacy.Recently, a novel approach to fitting MRI data, based on deep neural networks, was introduced for diffusion MRI [5], which greatly increased the speed and performance. Therefore, in this work, we developed and tested two neural-networks for estimating DCE parameters.
Methods
All analysis was done in Python 3.6 using Pytorch 1.3. Two network designs were tested: a network for estimating the DCE parameters from the contrast enhancement curve (Tofts-NET), which is a direct replacement of the conventional DCE approaches, and a network that estimated both the DCE parameters and T1i directly from the MRI data (DCE-NET). The inputs to both networks (Fig. 1) were single voxel time curves. Tofts-NET got contrast concentration curves, whereas DCE-NET got voxel signal values during contrast enhancement and from dual flip angle data pre-contrast. Networks were fully connected 3-layer networks of constant width, that ended with 4 (Tofts-NET) or 6 (DCE-NET) output parameters, representing the rate constant (kep), extravascular space (ve), perfusion fraction (vp) and the time of contrast arrival (dt) for both networks, and the initial T1 (T1i) and scaling factor S0 for DCE-NET. The loss functions were the mean of the squared difference between the input signal and the reconstructed signal, where the reconstructed signal was computed according to the extended Tofts model with the estimated parameters (Tofts-NET), and included further relaxometry (DCE-NET). The networks were trained unsupervised (no ground-truth DCE parameters). Training was done with an Adam optimiser (learning rate of 0.001) [6].The networks were compared to the least-squares fit. A computational efficient hematocrit-adjusted population-based arterial input function (AIF) that we implemented in Pycharm, was used [7] for both the least-squares fit as the networks.
DCE data was simulated using 0.1<Kep<2.0 min-1, 0.0<ve<0.7, 0.00<vp<0.05, 45<dt<66 sec, 0.2<T1i<1.7 sec. Other simulation settings were identical to our acquisition protocol stated in Table 1. DCE data were simulated using signal-to-noise ratio (SNR; defined pre-contrast) values ranging from 7 to 80. Per SNR-value, 100,000 DCE curves were simulated and the neural networks were trained and evaluated. Due to time constraints, the least-squares algorithm was only fitted to the first 5,000 DCE curves. Systematic and random errors were determined by comparing estimated parameters to the ground truth input.
Repeated DCE MRI were obtained (Table 1) in eight head and neck cancer patients (data from [8,9]) after intravenous injection of gadolinium contrast agent (automatic injector; 0.2 mL/kg body mass, 2 mL/s injection rate). Per patient, a network was trained specifically to their hematocrit value (used in the loss function). To accelerate training, a pre-trained network at hematocrit value of 0.4 on simulated data with SNR of 15 was used for the initialization of the weights while the learning rate was decreased to 0.0002. Data were assessed qualitatively (visually).
Results
In the simulations, the deep-learning approaches outperformed traditional training substantially (Figure 2). The DCE-NET performed better in noisy data, whereas the Tofts-NET performed better in less noisy data.In patients, the least-squares fit took an average of 10±5 hours per patient (1.1×10⁵±0.1×10⁵ voxels). The neural networks were substantially faster and were trained in 66±51 minutes in the same data whereas inference occurred in 42±25 seconds (all on a 3.5 GhZ Intel i7-4771 CPU).
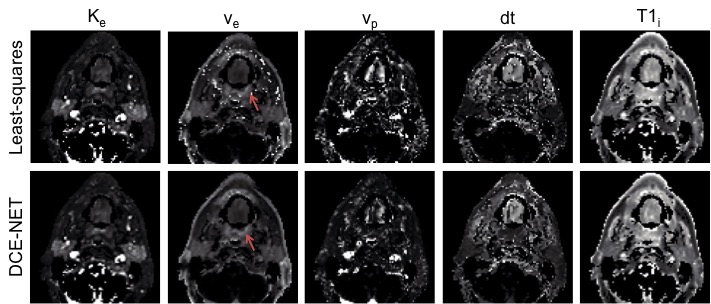
The parameter maps from the neural networks gave similar parameter values as the least-squares approaches, however, showed more pleasing parameter maps with less speckle (Figure 3 and Figure 4).
Discussion
Neural networks performed substantially more accurate DCE fits than the least-squares fitting approach and were considerably faster. The training time is still long for on scanner analysis, however, we believe the networks can be further accelerated by training on dedicated GPU hardware instead of on a CPU from a standard desktop.For Tofts-NET data needs pre-processing to contrast concentration curve. When data is less noisy, the pre-processing least-squares fit to obtain the T1i works accurately and hence the contrast enhancement curves are accurate. At high SNR the Tofts-NET then outperforms DCE-NET as it has an easier task at hand (only fit 4 parameters instead of 6). The DCE-NET estimates the T1i directly from the MRI data, and uncertainties herein are taken into account by the network. Hence DCE-NET performed better than Tofts-NET in more noisy data.
Conclusion
We developed a novel approach for obtaining quantitative DCE parameters from DCE data that relies upon neural networks. Our networks outperform conventional least-squares fitting approach as they are considerably faster, have a substantially lower random error in simulated data, and result in less noisy parameter maps in vivo.Acknowledgements
This work was supported by Cancer Research UK Programme Grants C33589/A19727 and C7224/A23275.References
[1] Dijkhoff RAP, Beets-Tan RGH, Lambregts DMJ, Beets GL, Maas M. Value of DCE-MRI for staging and response evaluation in rectal cancer: A systematic review. Eur J Radiol 2017. https://doi.org/10.1016/j.ejrad.2017.08.009.
[2] Wang C-H. Review of treatment assessment using DCE-MRI in breast cancer radiation therapy. World J Methodol 2014. https://doi.org/10.5662/wjm.v4.i2.46.
[3] Tofts PS. Modeling tracer kinetics in dynamic Gd-DTPA MR imaging. J Magn Reson Imaging 1997;7:91–101. https://doi.org/10.1002/jmri.1880070113.
[4] Klaassen R, Gurney-Champion OJ, Wilmink JW, Besselink MG, Engelbrecht MRW, Stoker J, et al. Repeatability and correlations of dynamic contrast enhanced and T2* MRI in patients with advanced pancreatic ductal adenocarcinoma. Magn Reson Imaging 2018;50:1–9. https://doi.org/10.1016/j.mri.2018.02.005.
[5] Barbieri S, Gurney‐Champion OJ, Klaassen R, Thoeny HC. Deep learning how to fit an intravoxel incoherent motion model to diffusion‐weighted MRI. Magn Reson Med 2020;83:312–21. https://doi.org/10.1002/mrm.27910.
[6] Kingma DP, Ba J. Adam: A Method for Stochastic Optimization. ArXiv Prepr 2014:1–15.
[7] Orton MR, d’Arcy JA, Walker-Samuel S, Hawkes DJ, Atkinson D, Collins DJ, et al. Computationally efficient vascular input function models for quantitative kinetic modelling using DCE-MRI. Phys Med Biol 2008;53:1225–39. https://doi.org/10.1088/0031-9155/53/5/005.
[8] Welsh L, Panek R, McQuaid D, Dunlop A, Schmidt M, Riddell A, et al. Prospective, longitudinal, multi-modal functional imaging for radical chemo-IMRT treatment of locally advanced head and neck cancer: the INSIGHT study. Radiat Oncol 2015;10:112. https://doi.org/10.1186/s13014-015-0415-7.
[9] Wong KH, Panek R, Dunlop A, Mcquaid D, Riddell A, Welsh LC, et al. Changes in multimodality functional imaging parameters early during chemoradiation predict treatment response in patients with locally advanced head and neck cancer. Eur J Nucl Med Mol Imaging 2017;45:759–67. https://doi.org/10.1007/s00259-017-3890-2.
Figures