0010
Partial Volume Correction of the Arterial Input Function with Surrounding Tissue Signal for Dynamic Contrast Enhanced MRI in the Brain1Centre d’imagerie moléculaire de Sherbrooke, Département de médecine nucléaire et radiobiologie, Université de Sherbrooke, Sherbrooke, QC, Canada, 2MR Clinical Science, Philips Healthcare Canada, Markham, ON, Canada, 3Service de neurochirurgie, Département de chirurgie, Université de Sherbrooke, Sherbrooke, QC, Canada
Synopsis
The arterial input function measured for brain dynamic contrast-enhanced MRI is contaminated by the signal contribution of surrounding tissues. This work corrects these partial volume effects on signal level by using the surrounding gray matter enhancement to discriminate pure arterial signal. The method also accounts for the high contrast agent concentration reached in arteries and veins that leads to signal non-linearity, saturation, and concurrent unwanted $$$T_2^*$$$ effects. This partial volume correction method is compared to concentration scaling on a digital reference object and on eight subjects. Better recovery of the arterial first pass and recirculation are shown.
Introduction
Accurate pharmacokinetic modeling in DCE-MRI depends on the quality of the arterial input function (AIF). In the brain, the AIF is typically measured from arteries smaller than the voxel volume. The measured signal has contributions from both arterial blood and surrounding tissue. These partial volume effects (PVE) are minimal for the superior sagittal sinus (SSS) where the venous output function (VOF) can be measured. This VOF can be taken as a surrogate for the AIF, but it underestimates the transfer constants ($$$K^\mathrm{Trans}$$$), it overestimates distribution volumes ($$$v_e$$$), and it correlates poorly with plasma volumes ($$$v_p$$$).1 Alternatively, partial volume correction methods (PVCM) scale the AIF with a blood volume fraction to match the VOF’s area under the curve (AUC). However, scaling at the signal level is required to account for signal-to-concentration non-linearity.2 We improved this method by using the nearby gray matter (GM) signal as a reference for tissue contribution to extract the arterial enhancement. This AIF pipeline will be shared in an open-source toolbox.Methods
Cohort: This study was approved by the institutional ethics committee. Results are shown for eight participants.Acquisition: Imaging was performed on a Philips Ingenia 3.0 T scanner with a 32-channel head receiver coil. A 3D T1-weighted spoiled gradient-echo (SPGR) sequence was designed for DCE ($$$\mathrm{TE}=1.85\,\mathrm{ms}$$$; $$$\mathrm{TR}=4\,\mathrm{ms}$$$; flip angle$$$\,=9.2°$$$; $$$\mathrm{FOV}=220\times165\times90\,\mathrm{mm}^3$$$; acquired spatial resolution$$$\,=2.3\times2.3\times2.3\,\mathrm{mm}^3$$$; reconstructed images matrix$$$\,=96\times96\times39$$$; SENSE factors$$$\,=2.3\times1.2$$$; time resolution$$$\,=2.0\,\mathrm{s}$$$; viewsharing keyhole with 10 s footprint). Dynamic acquisition duration was 4 min, with a half dose (0.05 mL/kg) injection of gadobutrol starting at 60 s.
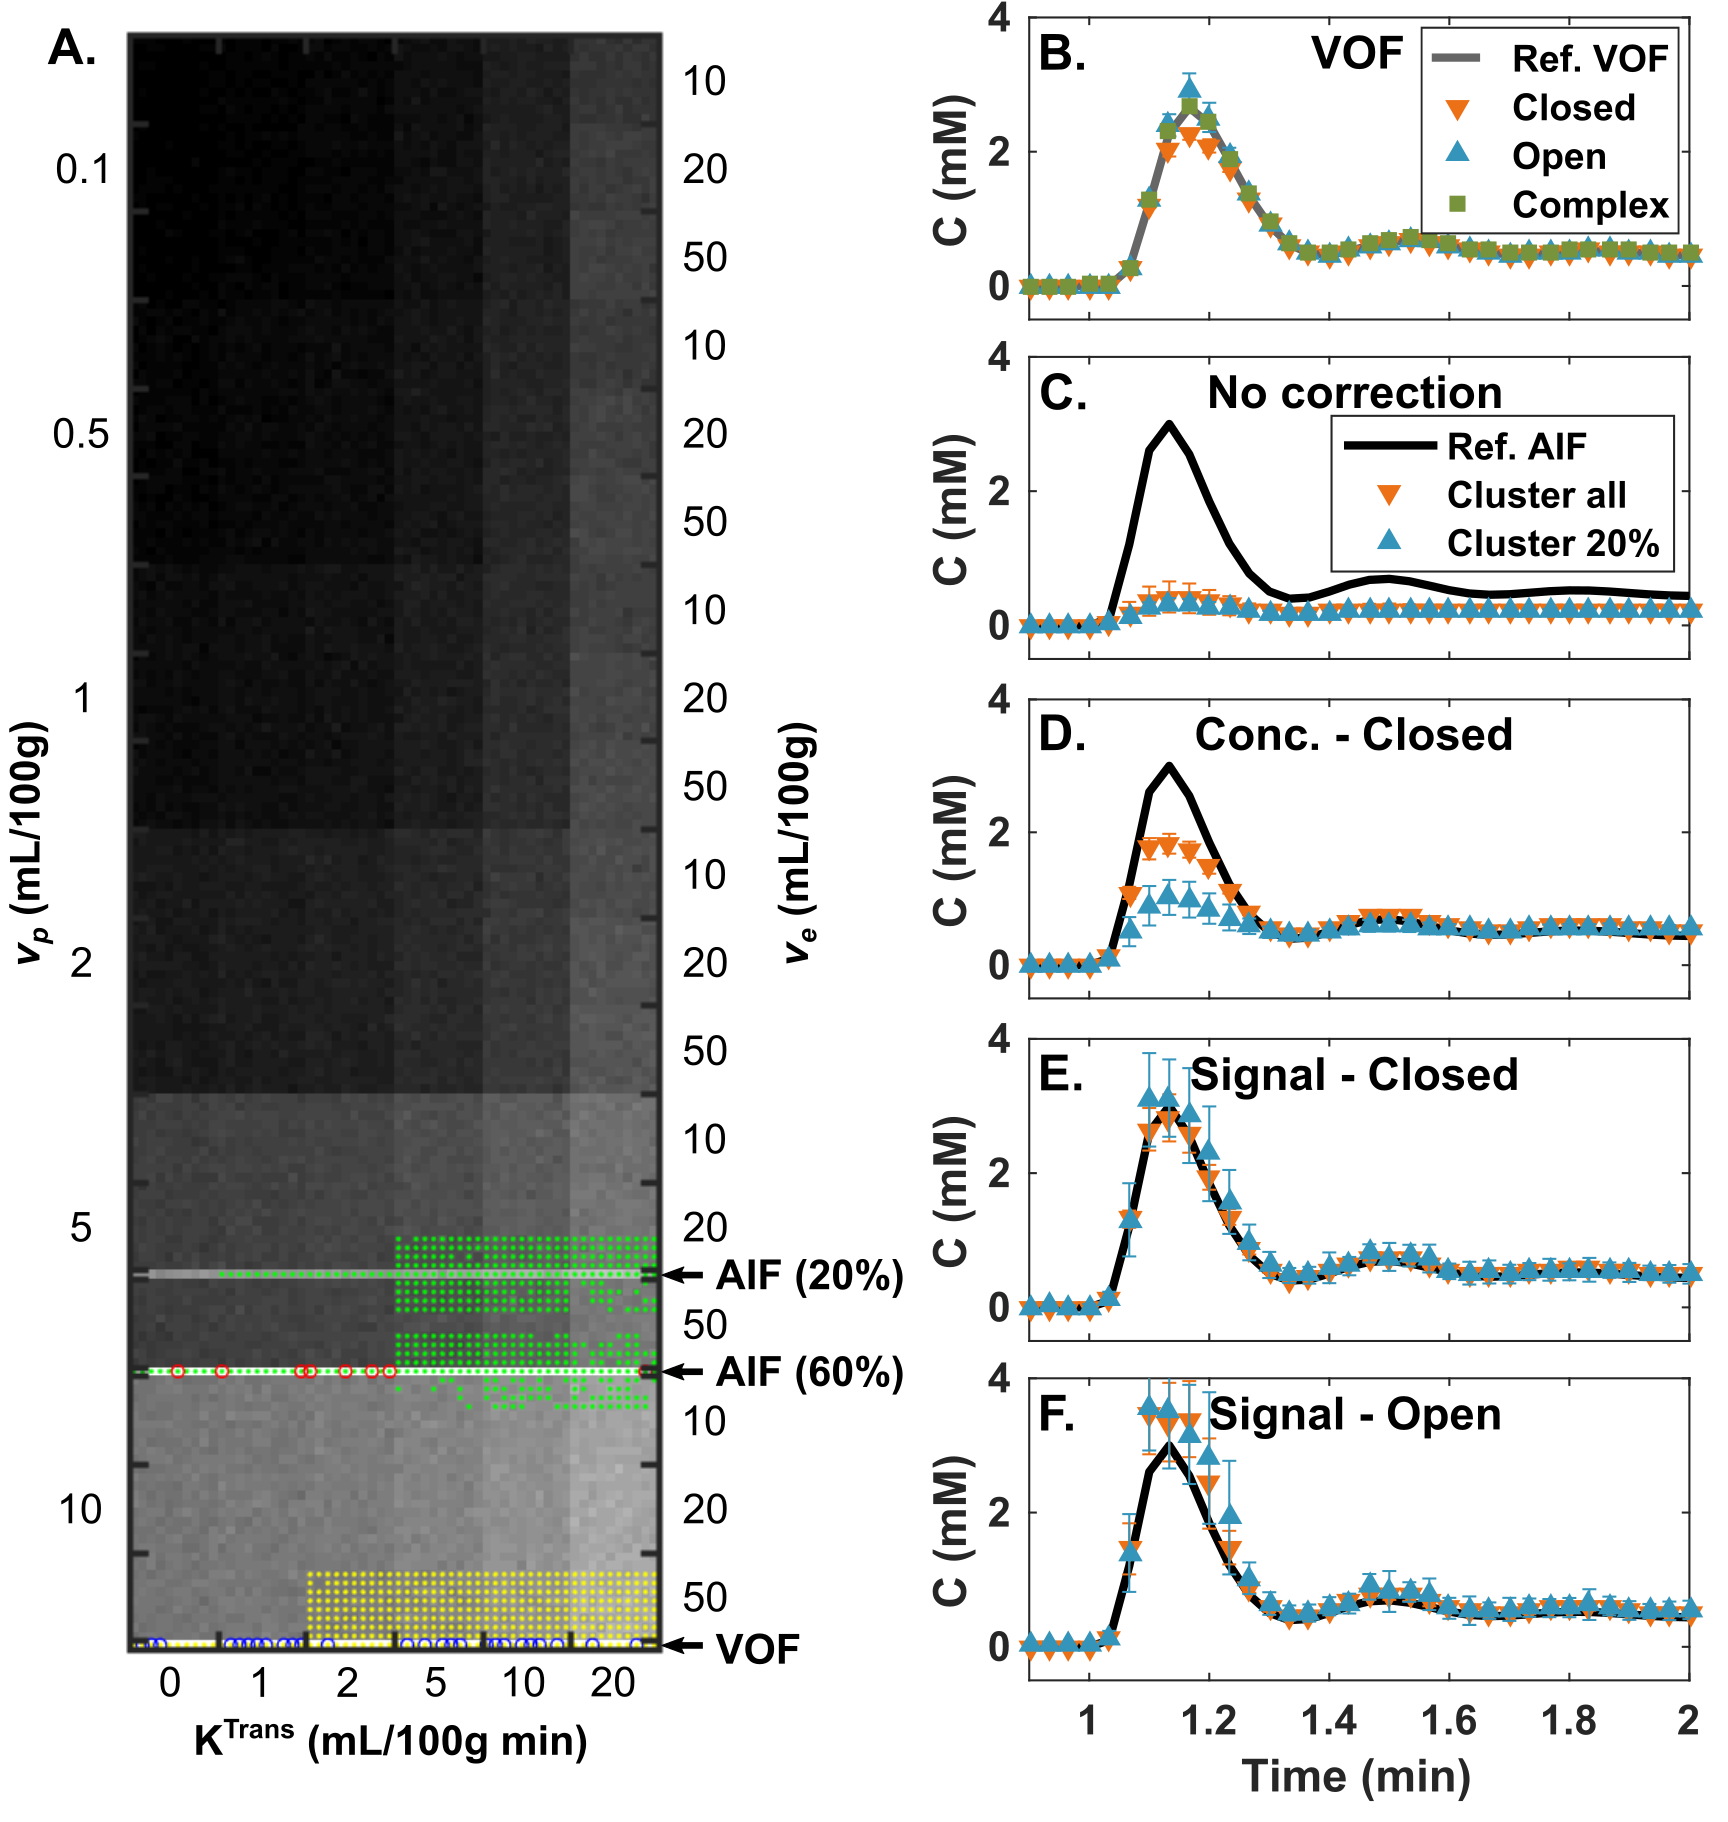
Simulations: A digital reference object (DRO) of the extended Tofts-Kety model was produced (QIBA_v4 specifications3), which in our case included a parametrized Horsfield AIF4 scaled to typical concentrations reached by the half dose injection, tissue transverse relaxivity ($$$r_2^*$$$) of 87 mM-1s-1,5 and added noise (SNR of 35). Three rows were added to the DRO:
- A VOF, generated by dispersing the AIF with a log-normal vascular transport function,6
- Two AIFs with a blood volume fraction of 20% or 60% mixed with tissue signals.
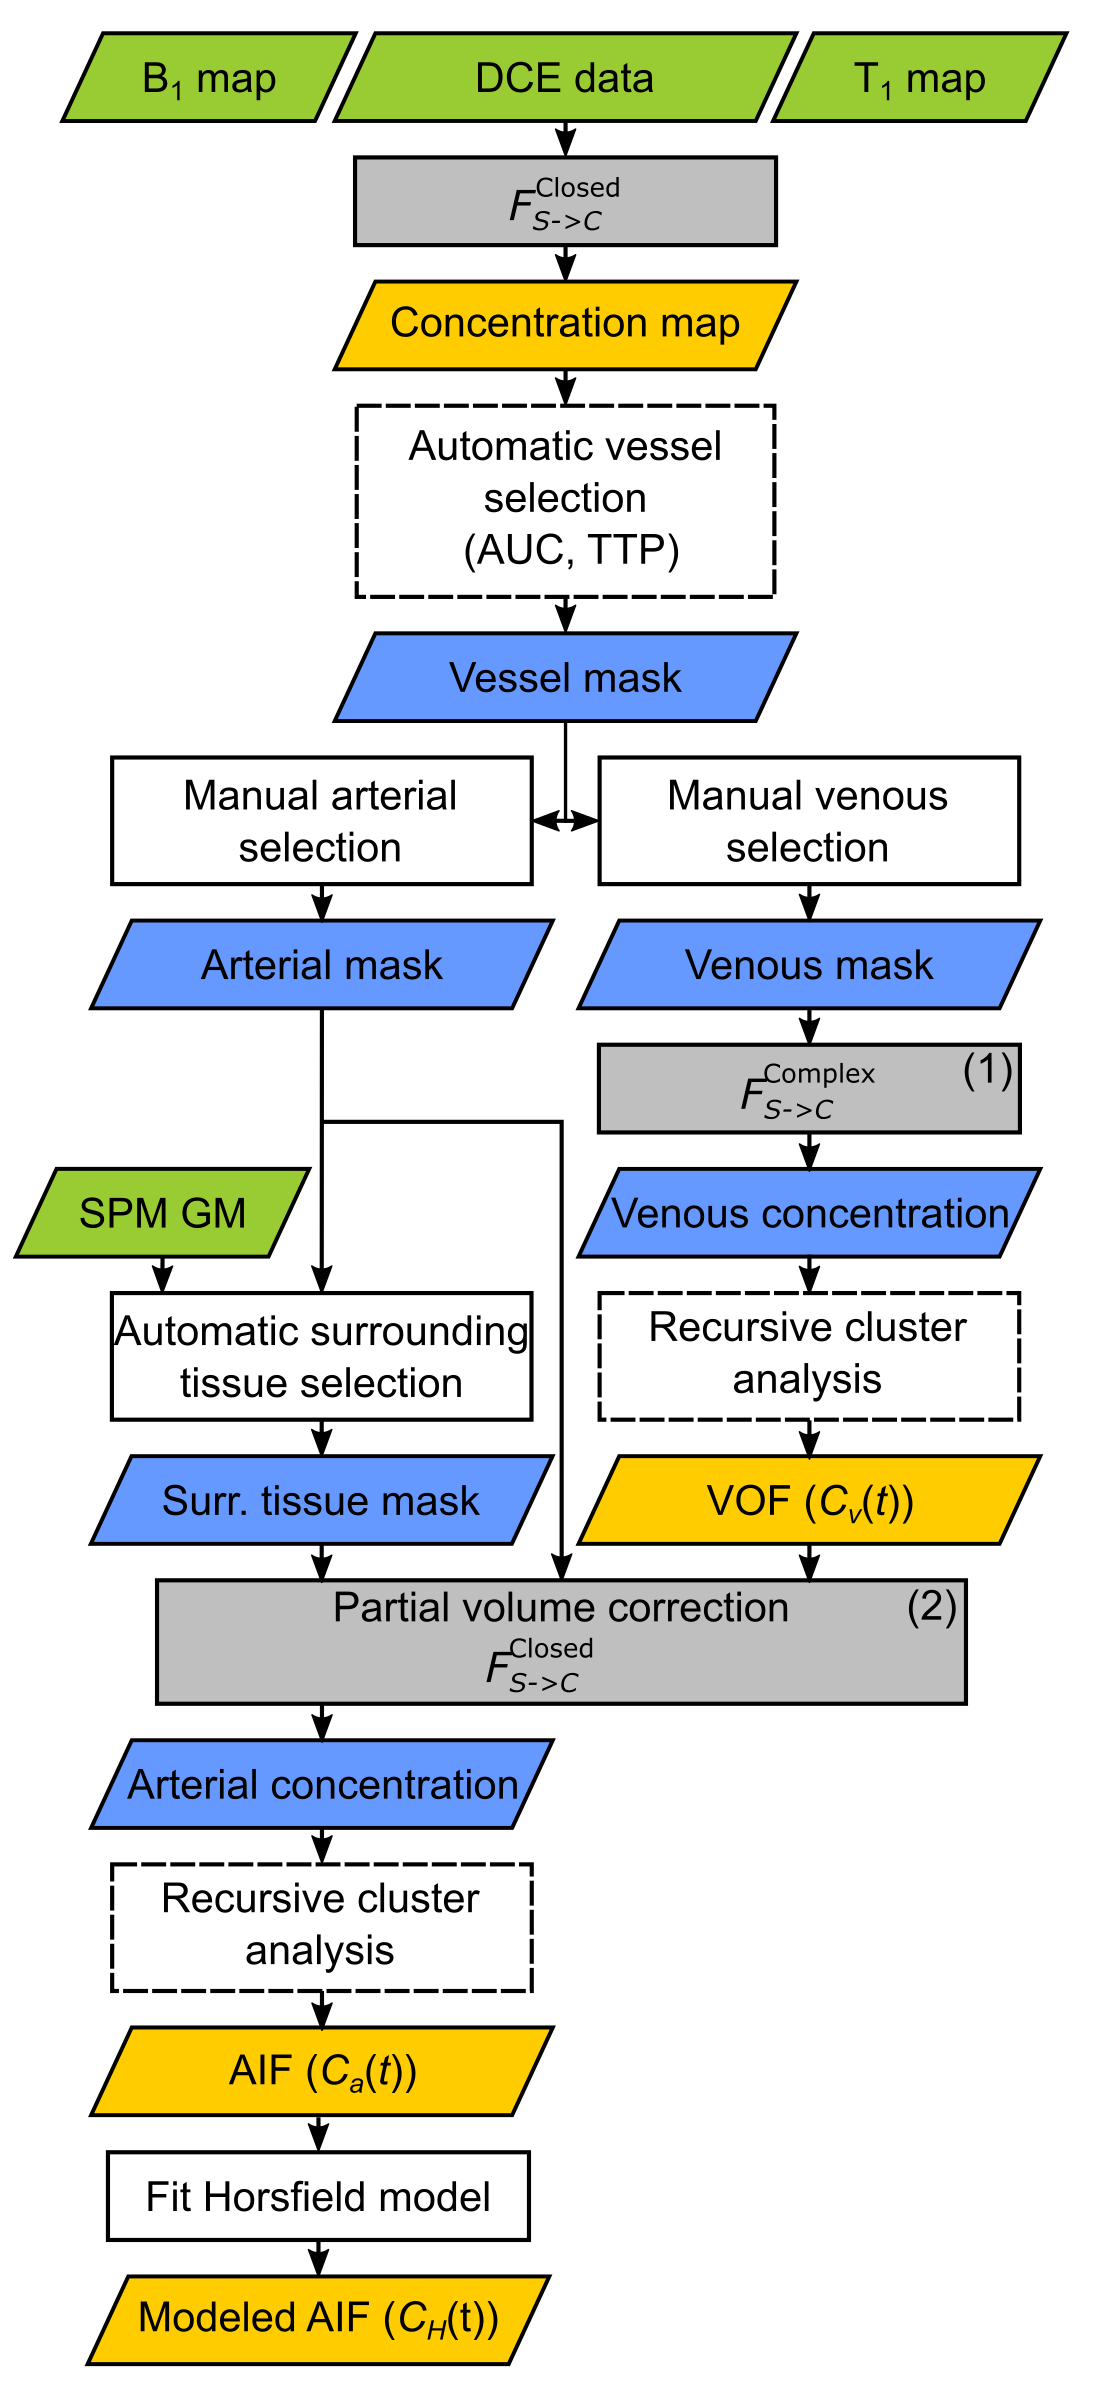
Processing: VOF is taken from SSS voxels and is considered as a PVE-free reference. Our AIF-PVCM was applied at the measured voxel signal ($$$S_m(t)$$$) level correcting for surrounding tissues with nearby GM signal ($$$S_t(t)$$$) from a voxel automatically selected from nearest neighbours with minimum AUC within a GM mask derived from SPM. The corrected complex arterial signal ($$$S_a(t)$$$) was scaled with a range of blood volume fraction ($$$k$$$) on a voxel-wise basis:
$$S_a(t)=\left[S_m(t)-(1-k)S_t(t)\right]/k$$ Repeated arterial concentration calculation was done to find $$$k$$$ for which the AUC matches that of the VOF. Three different signal-to-concentration equations ($$$F_{S\to{C}}$$$) were considered:
- The standard non-linear closed-form SPGR equation,
- The non-linear open-form equation9 that includes $$$T_2^*$$$ relaxation with quadratic blood relaxivity, fitted only for arterial-like voxels,
- The complex-form equation, fitted for the VOF of the SSS as described by Simonis et al.,10 but modified to consider the quadratic relaxivity of blood.
Results and Discussion
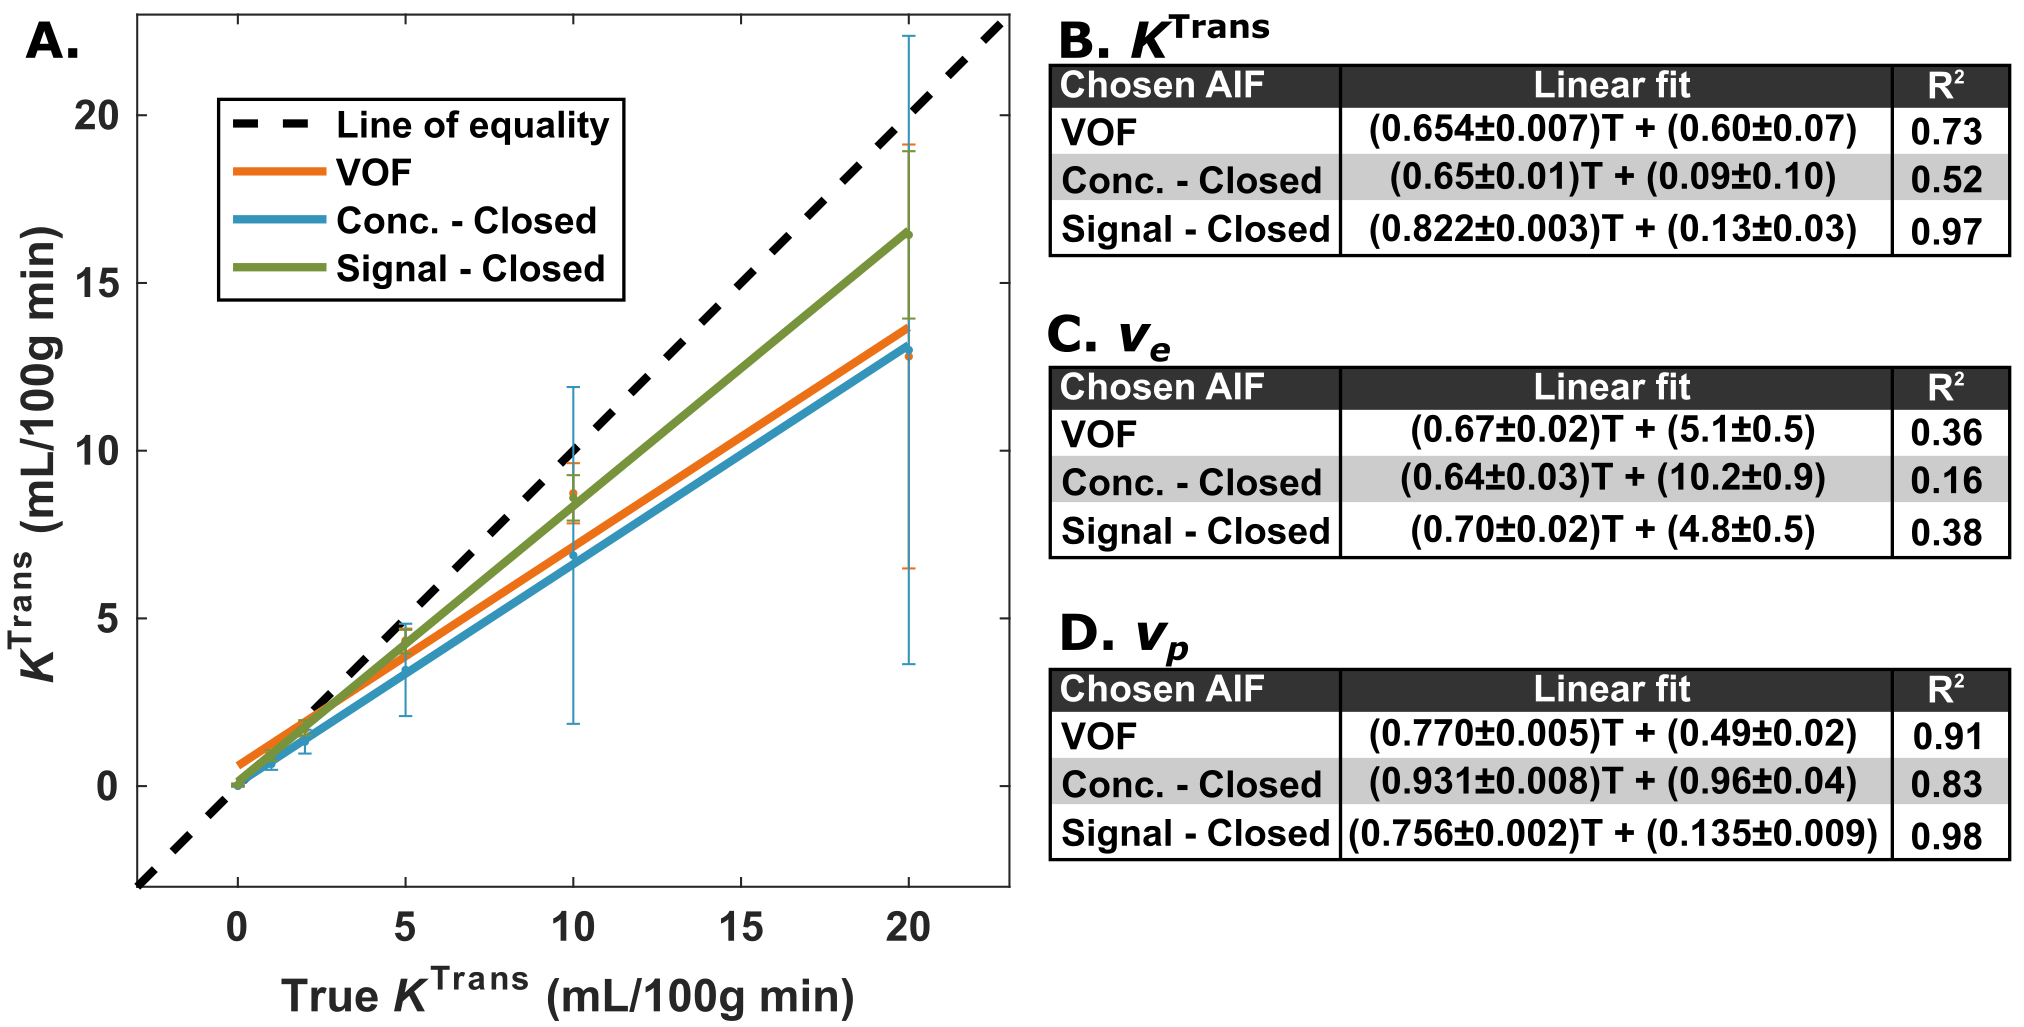
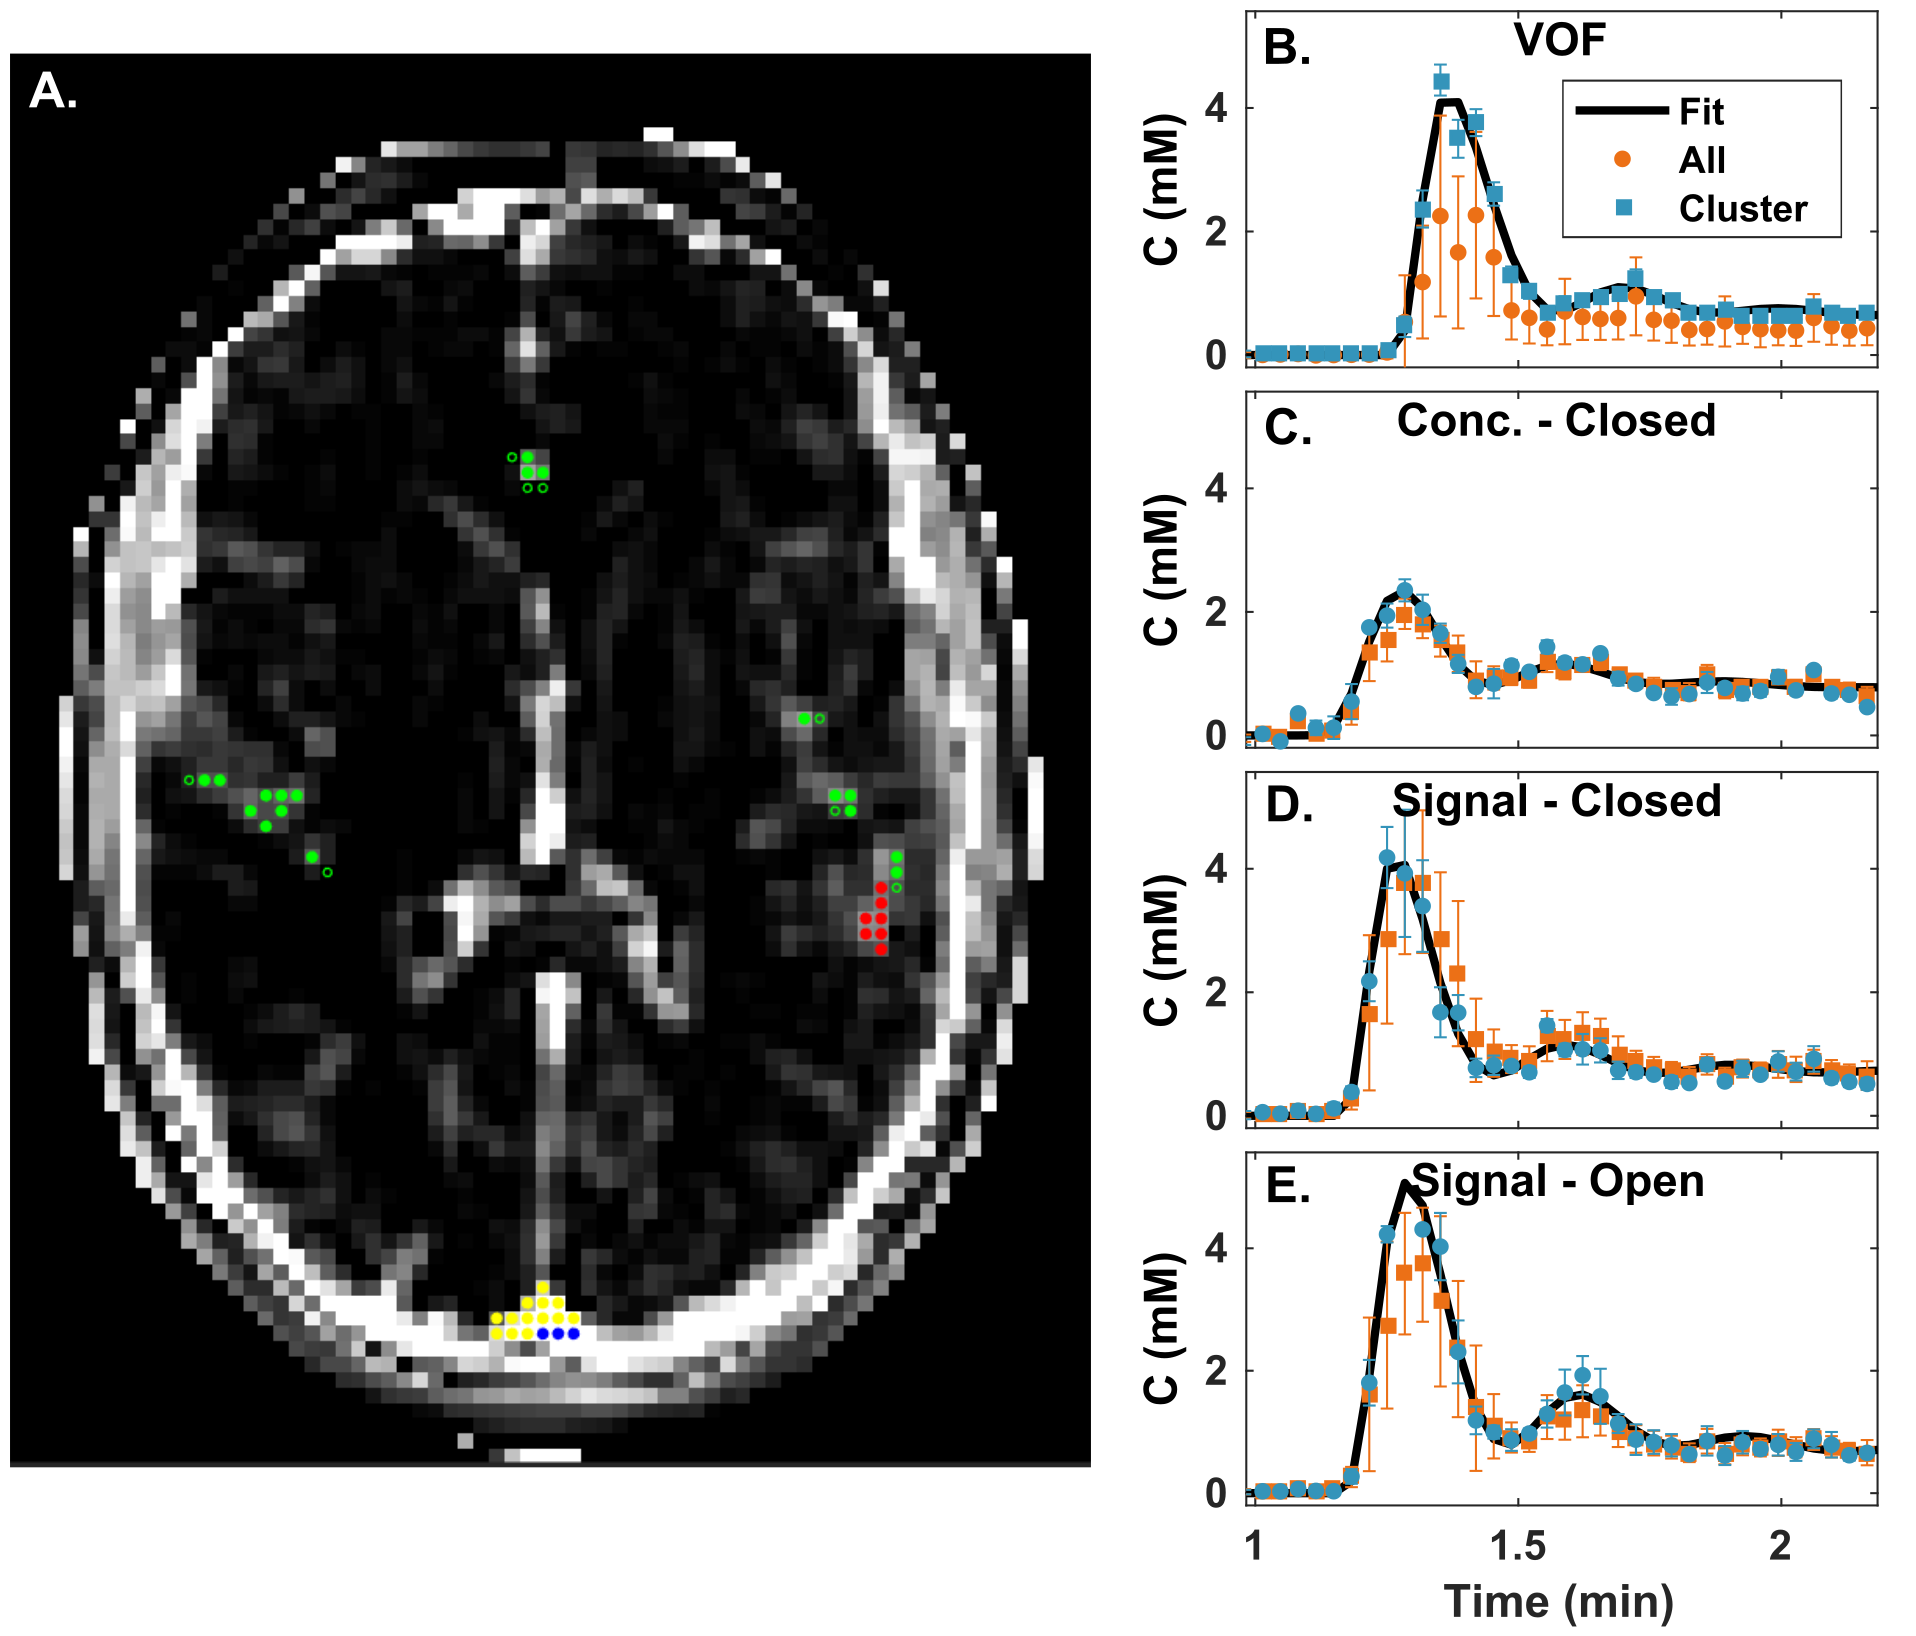
Figure 2 shows the DRO image, reference and calculated vessel curves. Our semi-automated voxel selection method successfully selected voxels from the DRO VOF and AIF rows (Fig. 2A). The complex-form equation was chosen for the final VOF (Fig. 2B). It recovers the peak concentration that is decreased with the closed-form, sensitive to $$$T_2^*$$$ effects, without the added noise of the open-form. Uncorrected AIF vascular rows are degraded by PVE (Fig. 2C). AIF-PVCM does not recover peak AIF non-linearity with concentration based scaling (Fig. 2D); signal based scaling with the closed-form equation recovers the peak AIF (Fig. 2E) with reduced noise sensitivity compared to the open-form equation (Fig. 2F). Figure 3 compares the calculated DRO parameters globally against their true values for the clustered PVE-corrected AIF with concentration scaling (Fig. 2D), with closed-form signal (Fig. 2E), or directly with the VOF (Fig. 2B). Closed-form signal scaling results in an estimation of $$$K^\mathrm{Trans}$$$ closer to the line of equality (Fig. 3A) and provides the highest coefficient of determination for $$$K^\mathrm{Trans}$$$ and $$$v_p$$$ (Fig. 3B,D). Figure 4 shows the detailed voxel selection, AIF-PVCM and fitting for a representative patient. When comparing the AIF and VOF curves for all patients, the closed-form signal-based PVCM resulted in an average blood fraction of (23±6)%, a cardiac output of (6.9±3.0) L/min, a (5.4±2.2) s shorter time to peak, and an AIF to VOF AUC ratio of (1.01±0.04) and of (1.4±0.5) for the global acquisition and the first pass, respectively. It was not clear, however, whether the AIF was less dispersed than the VOF with a full width at half maximum ratio relative increase of (14±41)%.Conclusion
Robust PVCM is essential to measure the AIF in small arteries that are free of inflow effect, bolus delay and dispersion that typically affect the large arteries or veins in the brain. Our PVCM with closed-form signal scaling recovers the PVE free concentration from small arteries using surrounding tissue signal. Performance is increased for our DRO pharmacokinetics against contrast based PVE or VOF surrogate.Acknowledgements
This work was supported by a grant from the Fonds de recherche du Québec (FRQ)–Nature et technologies (2018‐ PR‐206157). B.B.M. acknowledges a scholarship from the National Sciences and Engineering Research Council of Canada.References
1. Footit C, Cron GO, Mercier JF, et al. Optimizing perfusion imaging of brain tumors: Validation of venous output function used as a surrogate AIF. In: Proc. Intl. Soc. Mag Reson. Med. Montreal; 2011:2038.
2. Hansen AE, Pedersen H, Rostrup E, Larsson HBW. Partial volume effect (PVE) on the arterial input function (AIF) in T 1-weighted perfusion imaging and limitations of the multiplicative rescaling approach. Magn Reson Med. 2009;62:1055-1059.
3. Barboriak DP. QIBA_v4 Extended Tofts. https://sites.duke.edu/dblab/qibacontent/. Accessed August 14, 2019.
4. Georgiou L, Wilson DJ, Sharma N, Perren TJ, Buckley DL. A functional form for a representative individual arterial input function measured from a population using high temporal resolution DCE MRI. Magn Reson Med. 2019;81:1955-1963.
5. Kjølby BF, Østergaard L, Kiselev VG. Theoretical model of intravascular paramagnetic tracers effect on tissue relaxation. Magn Reson Med. 2006;56:187-197.
6. Willats L, Connelly A, Calamante F. Modelling the Bolus Dispersion from DSC-MRI Data. In: Proc. Intl. Soc. Mag Reson. Med. Berlin, Germany; 2007:1445.
7. Akbudak E, Kotys MS, Conturo TE. Quadraticity and hematocrit dependence of DR2* AIF signals at 3T: a blood phantom study under physiologic conditions. In: Syllabus of the ISMRM Workshop on Quantitative Cerebral Perfusion Imaging Using MRI: A Technical Perspective. Venice, Italy; 2004:10-11.
8. van Osch MJP, Vonken EPA, Viergever MA, van der Grond J, Bakker CJG. Measuring the arterial input function with gradient echo sequences. Magn Reson Med. 2003;49:1067-1076.
9. Schabel MC, Parker DL. Uncertainty and bias in contrast concentration measurements using spoiled gradient echo pulse sequences. Phys Med Biol. 2008;53:2345-2373.
10. Simonis FFJ, Sbrizzi A, Beld E, Lagendijk JJW, van den Berg CAT. Improving the arterial input function in dynamic contrast enhanced MRI by fitting the signal in the complex plane. Magn Reson Med. 2016;76:1236-1245.
11. Horsfield MA, Thornton JS, Gill A, Jager HR, Priest AN, Morgan B. A functional form for injected MRI Gd-chelate contrast agent concentration incorporating recirculation, extravasation and excretion. Phys Med Biol. 2009;54:2933-2949.
12. Peruzzo D, Bertoldo A, Zanderigo F, Cobelli C. Automatic selection of arterial input function on dynamic contrast-enhanced MR images. Comput Methods Programs Biomed. 2011;104:e148-e157.
Figures