0009
Comparison between blood-brain barrier permeability to water and gadolinium-based contrast agents in an elderly cohort1Mark & Mary Stevens Neuroimaging and Informatics Institute, Keck School of Medicine, University of Southern California, Los Angeles, CA, United States, 2Department of Neurology, University of Southern California, Los Angeles, CA, United States
Synopsis
A diffusion-weighted arterial spin labeling (DW-ASL) technique has been proposed to non-invasively measure water exchange rate (kw) across the BBB. kw was compared with GBCAs permeability (Ktrans) in aged subjects at risk of small vessel disease. A positive correlation was found between kw and Ktrans only in the caudate, suggesting different BBB mechanisms probed by kw and Ktrans. Significant increase of kw was found in subjects with diabetes or high vascular risk while no Ktrans difference was observed. Water permeability could be a sensitive biomarker to study glymphatic function and vascular diseases before detectable BBB disruption occurs.
Introduction
Dynamic contrast‐enhanced (DCE) MRI using intravenous injection of gadolinium (Gd)‐based contrast agents (GBCAs) is commonly used for imaging BBB permeability. However, safety of gadolinium MRI is debated,1 and BBB permeability has to reach a critical level before extravasation.2 Water is an alternative endogenous tracer with limited permeability across the BBB. A diffusion-weighted arterial spin labeling (DW-ASL) technique has been proposed to non-invasively measure water exchange rate across the BBB.3,4 In this study, BBB permeability to water (kw) and contrast agents (Ktrans) were measured using DW-ASL and DCE-MRI in a cohort of elderly subjects at risk of cerebral small vessel disease (SVD). Regional kw and Ktrans values were compared and their correlations with vascular risk factors were evaluated.Methods
A diffusion prepared 3D gradient and spin echo (GRASE) pseudo-continuous arterial spin labeling (pCASL) sequence was used for DW-ASL and imaging parameters were:4 FOV = 224 mm, 12 axial slices, resolution = 3.5×3.5×8 mm3. A 2-stage approach was employed to measure arterial transit time (ATT) and kw in 9 mins 20 sec.3 DCE-MRI scan consisted of a pre-contrast T1-mapping protocol (3D FLASH with flip angles: 20, 50, 100, 120, 150) and a dynamic T1-weighted acquisition with parameters: FOV = 175 mm, 14 coronal slices, resolution=1.1×1.1×5 mm3, 64 frames were acquired in 16 mins. 20 mL of GBCA (Dotarem, 0.5 mmol/mL) was injected after 30 secs of image acquisition.Both DCE-MRI and DW-ASL data were motion corrected using SPM12. A novel total generalized variation (TGV) regularized single-pass approximation (SPA) model was applied to fit the kw by estimating ASL signals in the capillary/tissue compartments.4 Ktrans was fitted using Patlak model,5 which has good performance in low permeability regions using ROCKETSHIP.6 Both Ktrans and kw maps were normalized into the MNI space, and regional analysis was performed in the perforator territory of middle cerebral artery (MCAperf), caudate, medial-temporal lobe (MTL) and subregions, including hippocampus, parahippocampal gyrus (PHG) and amygdala.
MRI scans were performed in 16 aged subjects (3 male, age=67.9±3.0yrs) from the MarkVCID cohort on a Siemens 3T Prisma system (Erlangen, Germany) using a 20-channel head coil. Test and retest DW-ASL scans were collected ~6 weeks apart to evaluate the reproducibility of kw measurement. kw values were averaged from 2 scans and compared with Ktrans across 16 subjects using linear regression. Vascular risk factor (VRF, scored from 0 to 3) was calculated as the combination of presences of type-2 diabetes, hypertension or hypercholesterolemia. VRF≥2 was considered as high vascular risk. Ktrans and kw were compared between normal subjects and subjects with diabetes or high vascular risk using two-sample t-test.
Results and discussion
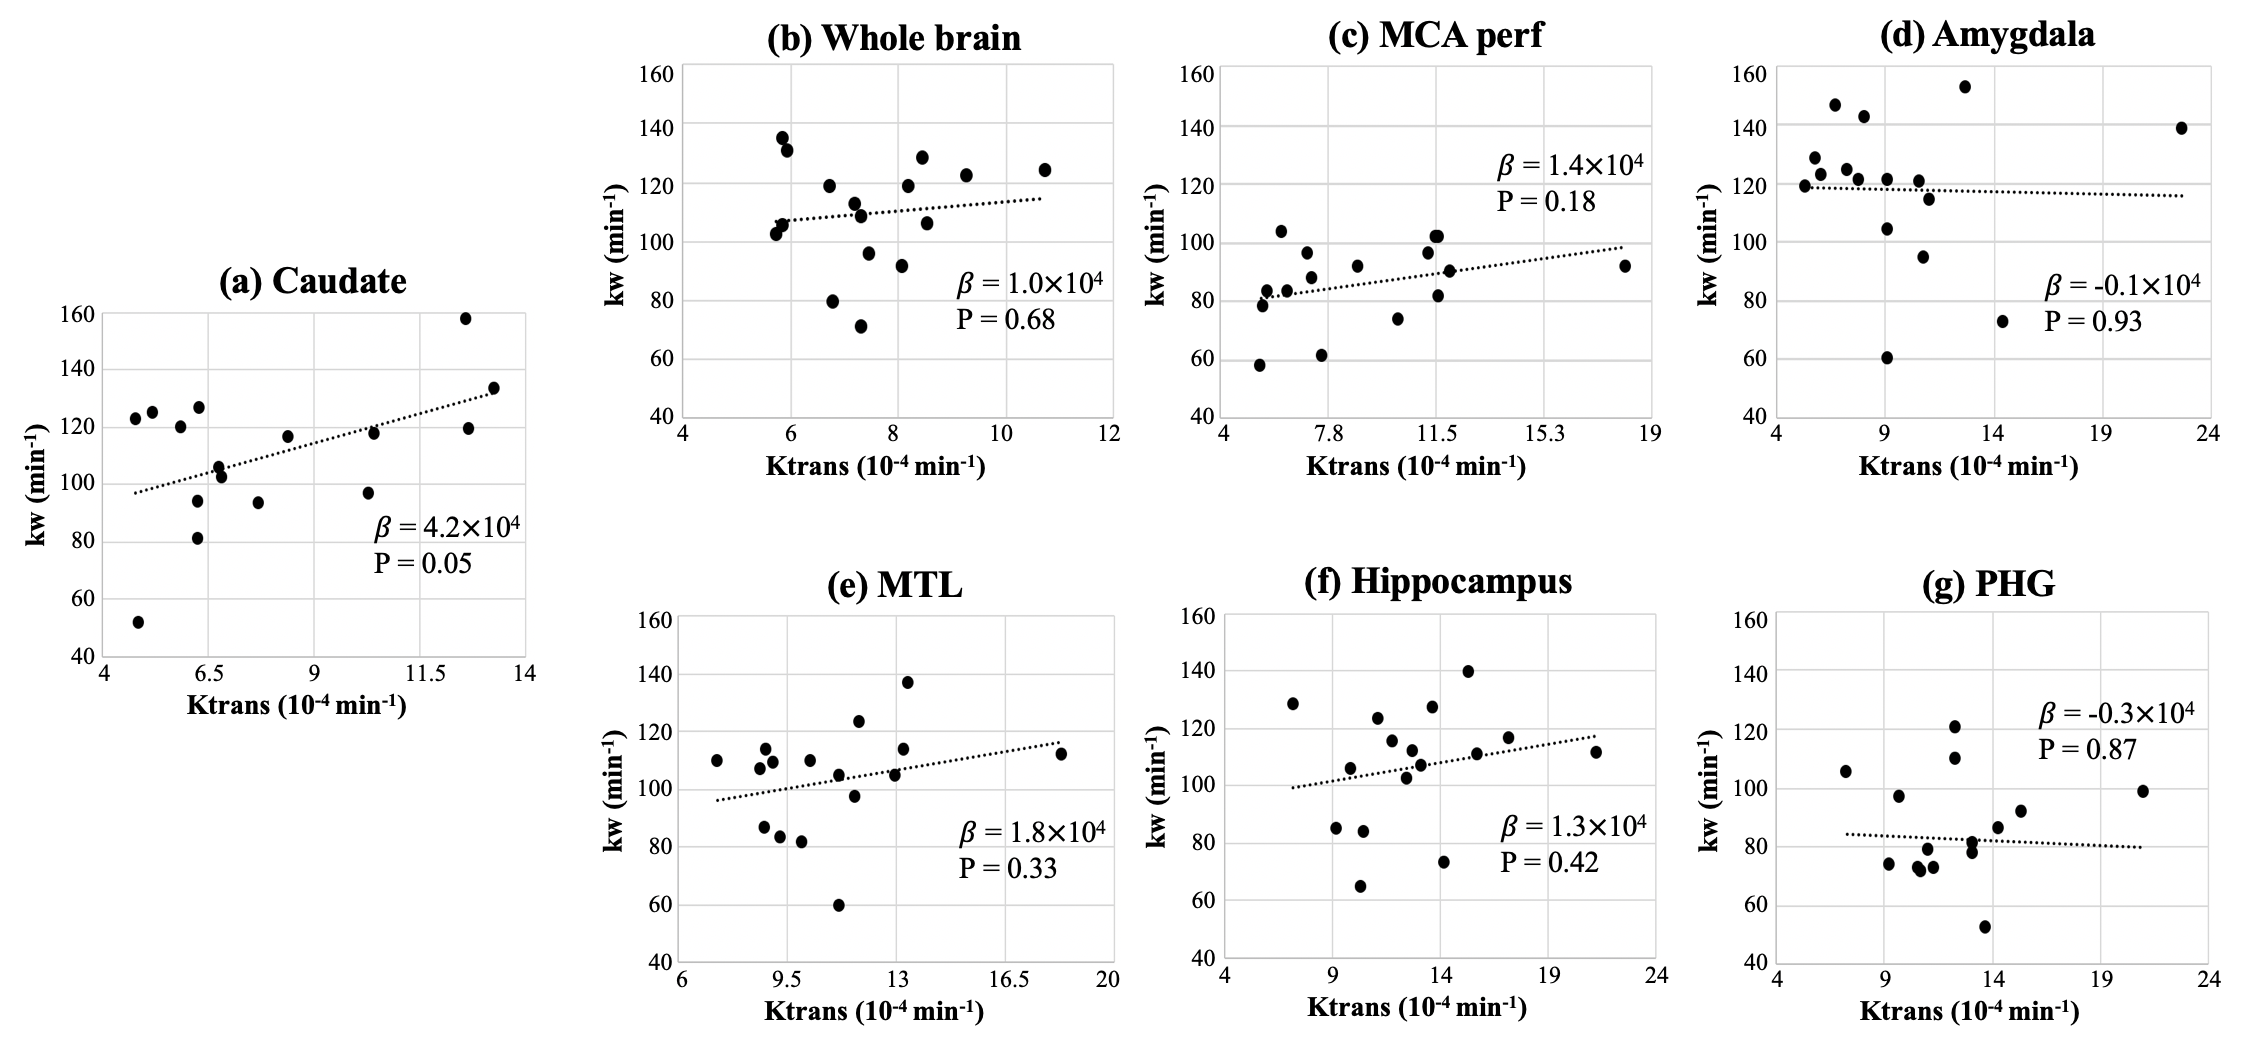
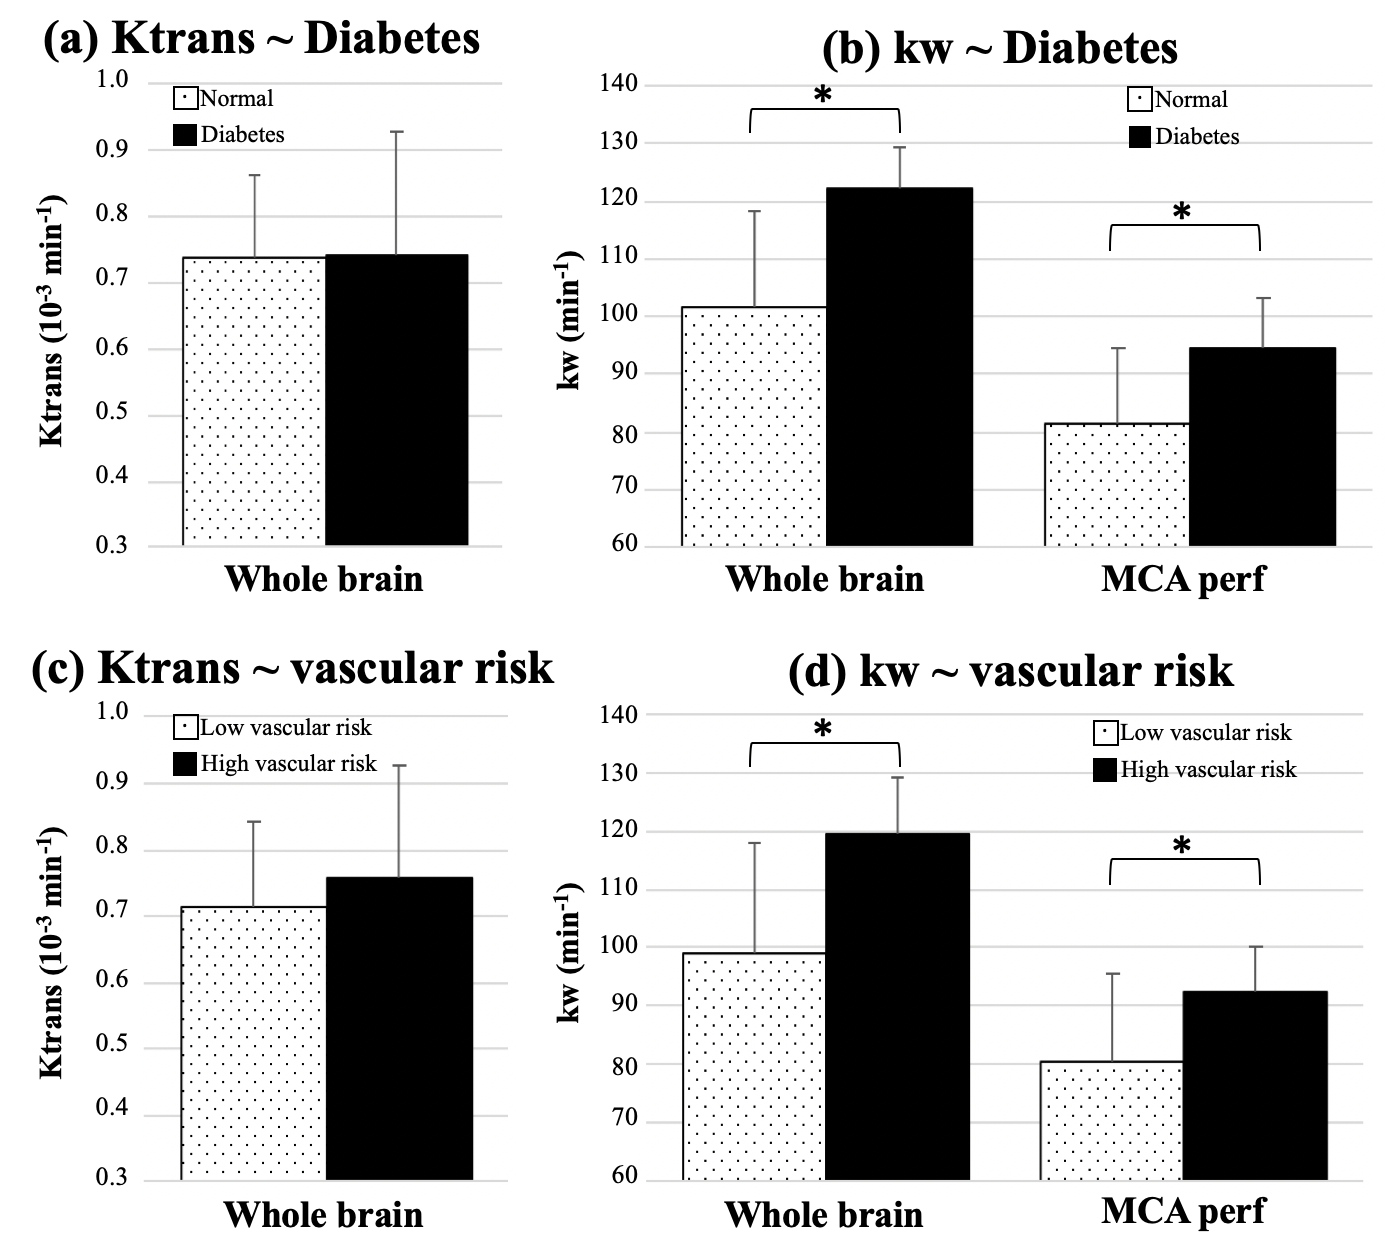
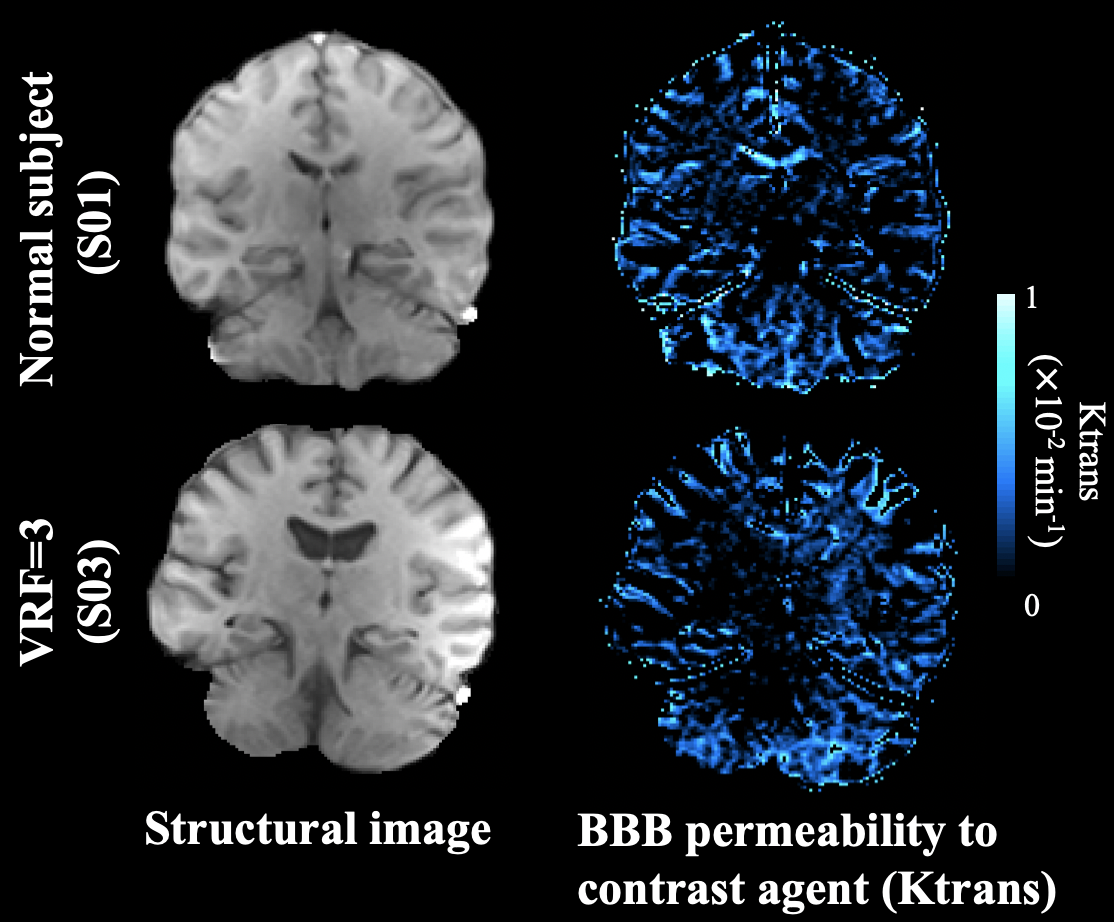
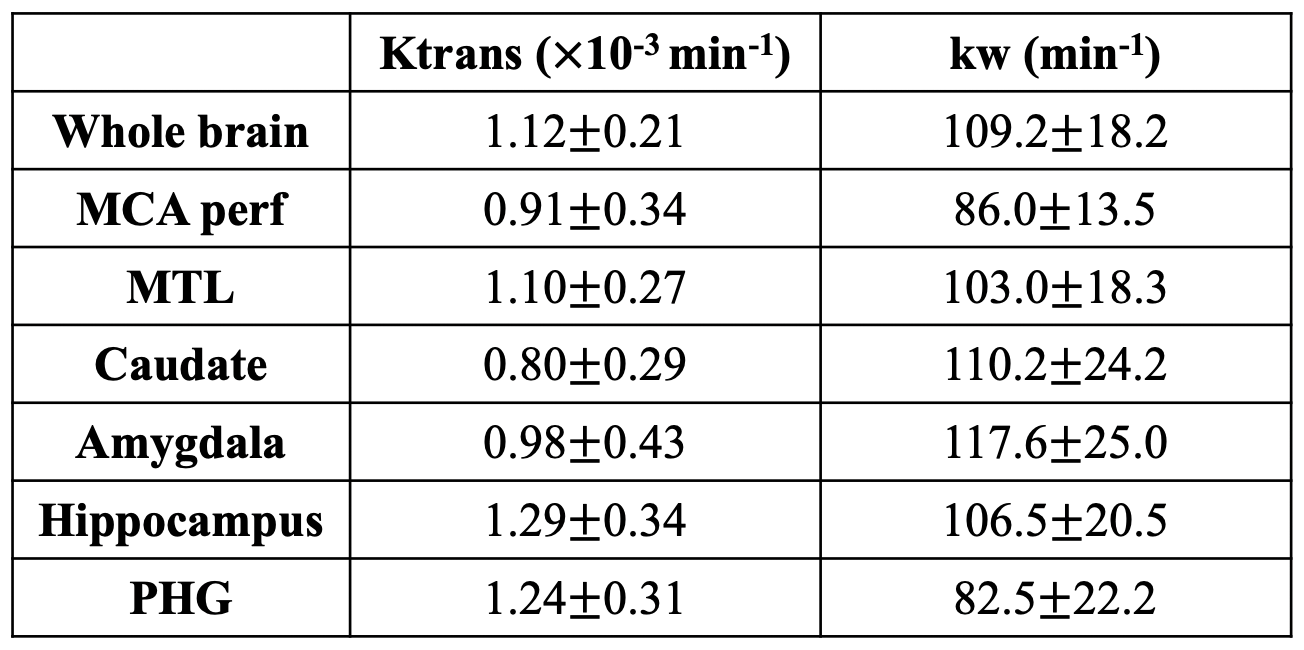
ICC=0.72 for test and retest kw measurements. Average Ktrans and kw values were summarized in Table 1. Figure 1 shows the scatter plots between whole-brain and regional kw and Ktrans values. Significant correlation was found between kw and Ktrans in caudate (β=4.2×10⁴, P = 0.05), as shown in figure 1 (a). Caudate is a critical subcortical region affected by SVD and BBB leakage in caudate has been reported.7 No significant correlations were found between kw and Ktrans in whole brain (P=0.68), MCA perforator territory (P=0.18), Amygdala (P=0.93), MTL (P=0.33), hippocampus (P=0.42) or parahippocampal gyrus (P=0.87), as shown in figure 1 (b-g). Considering the different transport mechanisms of water and GBCAs across the BBB, kw and Ktrans could reflect the vascular function and BBB integrity at different stages of disease progression.No significant difference of Ktrans was found between normal subjects and subjects with diabetes (P=0.65) or high vascular risk (P=0.47), as shown in figure 2 (a) and (c) respectively. Figure 3 shows the Ktrans maps from two representative subjects with VRF=0 and 3. In contrast, 20.5% (P=0.006, whole brain) and 16.2% (P=0.02, MCAperf) increase of kw was found in subjects with diabetes, and 20.6% (P=0.008, whole brain) and 14.7% (P=0.03, MCAperf) increase of kw was found in subjects with high vascular risk, as shown in figure 2 (b) and (d), respectively. Figure 4 shows the kw maps acquired from the test and retest scans of the same two subjects with VRF=0 and 3. Water exchange across the BBB is controlled by water channel protein aquaporin-4 (AQP4). AQP4 is important to maintain glymphatic functions and diabetes is associated with increased glymphatic CSF influx into interstitial spaces.8 Compared to Ktrans, our results suggested that water exchange rate across the BBB could be more sensitive to vascular diseases.
Conclusion
DW-ASL measures of water exchange rate across the BBB was compared with GBCAs permeability in aged subjects at risk of SVD. A positive correlation was found between kw and Ktrans only in the caudate, suggesting different BBB mechanisms probed by kw and Ktrans. Water permeability could be a sensitive biomarker to study glymphatic function and vascular diseases before detectable BBB disruption occurs.Acknowledgements
This work was supported by National Institute of Health (NIH) grant UH3-NS100614 and R01-EB014922.References
[1] Gulani V, Calamante F, Shellock FG, Kanal E, Reeder SB. International Society for Magnetic Resonance in Medicine. Gadolinium deposition in the brain: summary of evidence and recommendations. Lancet Neurol. 2017;16:564–570.
[2] Montagne A, Barnes SR, Sweeney MD, et al. Blood‐brain barrier breakdown in the aging human hippocampus. Neuron. 2015;85:296–302.
[3] St Lawrence KS, Owen D, Wang DJ. A two‐stage approach for measuring vascular water exchange and arterial transit time by diffusion‐ weighted perfusion MRI. Magn Reson Med. 2012;67:1275–1284.
[4] Shao X, Ma S J, Casey M, et al. Mapping water exchange across the blood–brain barrier using 3D diffusion‐prepared arterial spin labeled perfusion MRI[J]. Magnetic resonance in medicine, 2019, 81(5): 3065-3079.
[5] Heye A K, Thrippleton M J, Armitage P A, et al. Tracer kinetic modelling for DCE-MRI quantification of subtle blood–brain barrier permeability[J]. Neuroimage, 2016, 125: 446-455.
[6] Barnes S R, Ng T S C, Santa-Maria N, et al. ROCKETSHIP: a flexible and modular software tool for the planning, processing and analysis of dynamic MRI studies[J]. BMC medical imaging, 2015, 15(1): 19.
[7] Bridges L R, Andoh J, Lawrence A J, et al. Blood-brain barrier dysfunction and cerebral small vessel disease (arteriolosclerosis) in brains of older people[J]. Journal of Neuropathology & Experimental Neurology, 2014, 73(11): 1026-1033.
[8] Plog B A, Nedergaard M. The glymphatic system in central nervous system health and disease: past, present, and future[J]. Annual Review of Pathology: Mechanisms of Disease, 2018, 13: 379-394.
Figures