0008
Hemodynamics and permeability of the windows of the brain: dynamic contrast-enhanced MRI of the circumventricular organs1Department of Psychiatry and Neuropsychology, Maastricht University, Maastricht, Netherlands, 2Department of Radiology and Nuclear Medicine, Maastricht University Medical Center, Maastricht, Netherlands, 3Department of Electrical Engineering, Eindhoven University of Technology, Eindhoven, Netherlands
Synopsis
Circumventricular organs (CVOs), located around the ventricles without blood-brain barrier, maintain homeostasis between the blood, cerebrospinal fluid, and brain. Secretory CVOs are involved in peptide release and sensory CVOs regulate signal transmission. These organs can be an entrance point for pathogens. For the first time, physiological properties of the CVOs were assessed in vivo with dynamic contrast-enhanced (DCE) MRI.
Assessing pharmacokinetics (leakage rate; blood perfusion; uptake capacity/retention) with DCE MRI in 20 healthy males, demonstrated that only secretory CVOs had noticeable stronger hemodynamics and higher permeability than normal-appearing brain matter.
Purpose
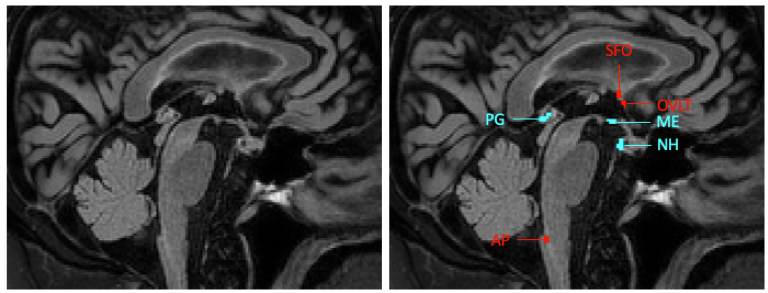
Circumventricular organs (CVOs) are small structures located around the third and fourth ventricles of the brain1(Figure 1). CVOs do not have a blood-brain barrier (BBB) and vessels branch into an extensive network of fenestrated capillaries with loosely connected astrocytic endfeet, so that substances from the blood can freely pass. CVOs are involved in maintaining homeostasis between the blood, cerebrospinal fluid and brain parenchyma2.Secretory CVOs (neurohypophysis (NH); median eminence (ME); pineal gland (PG)) are important for hormone and peptide secretion. Sensory CVOs (subfornical organ (SFO); organum vasculosum of the lamina terminalis (OVLT); area postrema (AP)) can sample molecules from the blood and pass signals on to the major neuronal effector centers3. CVOs are involved in regulation of arterial pressure and secretion of pro-inflammatory cytokines4, 5, and could be an entrance point for pathogens2. CVOs can thus be linked to neurodegenerative pathology, such as inflammation, and neurotoxic protein accumulation. A better understanding of CVO processes might help detecting abnormalities at early stages of neurodegeneration.
The first step toward a better understanding is defining an imaging technique suitable to investigate CVOs. This feasibility study focused on implementing dynamic contrast-enhanced (DCE) MRI to assess CVO hemodynamics and permeability. Due to BBB absence, contrast agent concentration in the CVO brain tissue should rapidly increase after administration. We hypothesized that contrast uptake will be higher in CVOs compared to the normal-appearing white and gray matter.
Methods
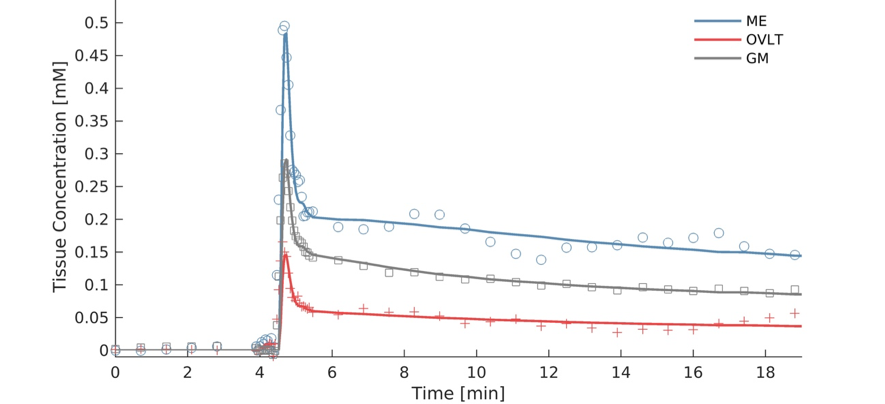
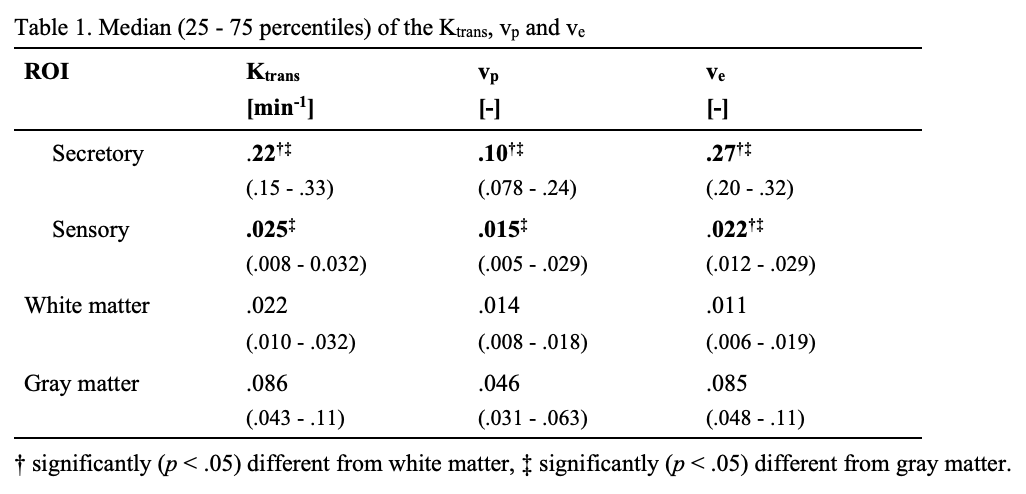
61 healthy males who did not show evidence of pathological aging were selected for a Maastricht Aging Study (MAAS)6 follow-up. We used imaging data of 20 male participants from this larger study. The anatomical scans consisted of T1-weighted fast gradient echo, T2-weighted FLAIR, turbo spin echo and gradient echo sequences acquired on a 3T MRI system (Achieva TX, Philips, Best, the Netherlands). The last sequence was a dual-time resolution DCE MRI, during which a short dynamic scan interval of 3.2 s was used during steep signal changes in initial contrast circulations, and a longer scan interval of 30.5 s was used for the leakage phase7. During the short interval, a bolus injection (0.1 mmol/kg gadobutrol, Gadavist®, Bayer AG, Leverkusen, Germany) was injected intravenously. T1-mapping was performed prior to contrast administration.Voxels belonging to each CVO were manually selected and saved as regions of interest (ROI) (Figure 1). Measurements were conducted in each CVO separately, secretory CVOs combined, sensory CVOs combined, white matter and gray matter. Pharmacokinetic modeling was conducted by applying the extended Tofts model8 on the mean tissue concentration curves (Figure 2) using a vascular input function obtained from the sagittal sinus superior, which resulted in three pharmacokinetic parameters: Ktrans: contrast leakage rate as permeability measurement; vp [-]: blood volume fraction perfusion measurement; and ve [-]: extracellular, extravascular space volume fraction as contrast uptake capacity/retention measurement9. For each fit, a visual check was performed and the normalized root-mean-square error (NRMSE)10 was calculated. To ensure the extended Tofts model was an accurate representation, only fits considered ‘good’ (NRMSE < 1.0) were included.
Results
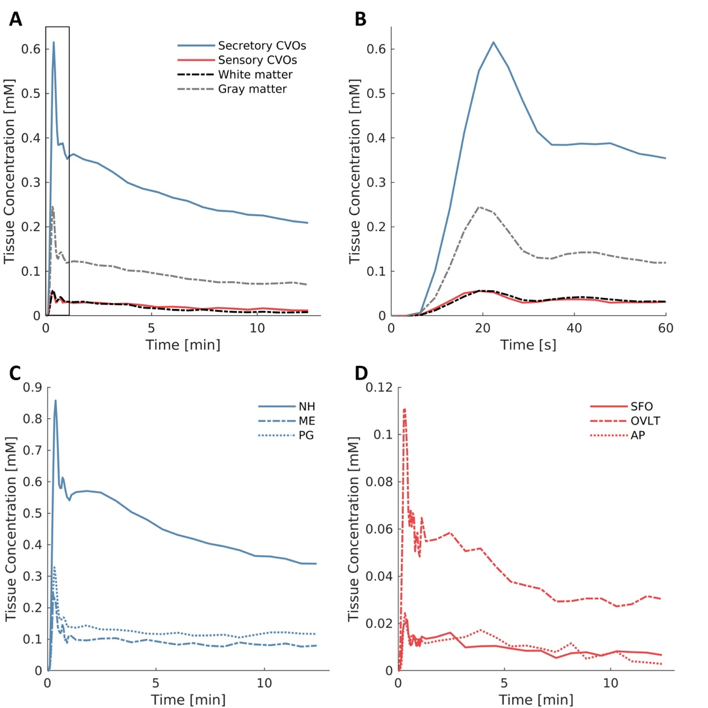
We were able to assess contrast enhancement using DCE MRI in the small CVOs (Figure 2). Secretory CVOs showed much stronger contrast enhancement than sensory.The secretory CVOs combined had significantly higher Ktrans, vp and ve values than the white and gray matter (all p < .001, Table 1). Post-hoc analyses for each secretory CVO separately demonstrated that the NH, ME and PG all had significantly higher values than the white matter (all p < .001). The NH had significantly higher values than the gray matter for Ktrans, vp and ve (all p < .001), and the PG had significantly higher values than the gray matter only for the vp and ve (all p ≤ .021).
The sensory CVOs combined did not differ significantly from the white matter for any of the parameters. Moreover, the sensory CVOs combined actually had significantly lower Ktrans, vp and ve values than the gray matter (all p ≤ .001, Table 1).
Discussion
We have introduced a novel method to assess hemodynamic and permeability properties of CVOs, implementing DCE MRI and pharmacokinetic modeling. Only secretory CVOs had higher permeability, stronger blood perfusion and contrast uptake capacity, and longer retention compared to normal-appearing brain matter. Blood flow in the sensory CVOs is slower relative to the rest of the brain, for the blood plasma to have better access to the receptors2, and less contrast agent may reach the sensory CVOs. Moreover, sensory organs may suffer from partial volume effects due to their very small size which may further explain the weak contrast enhancement.The strong contrast enhancement of the secretory CVOs can be attributed to a combination of hyperpermeability, vascular lumen and contrast uptake capacity. CVOs may provide access to pathogens and form a starting point for an inflammatory response2, 5. Therefore, assessing pharmacokinetic properties of CVOs and determining what characteristics potentially cause strong contrast enhancement, might eventually help blocking entrance of pathogens and possibly prevent neurodegeneration.
Conclusion
CVOs can be physiologically characterized in vivo by means of DCE MRI. Only secretory CVOs have noticeable higher permeability and uptake capacity than gray and white matter for the gadolinium contrast agent.Acknowledgements
This work was supported by the Nederlandse Organisatie voor Wetenschappelijk Onderzoek (NWO) [grant number 406-15-031].References
1. Benarroch EE. Circumventricular organs Receptive and homeostatic functions and clinical implications. Neurology. 2011;77(12):1198-204.
2. Sisó S, Jeffrey M, González L. Sensory circumventricular organs in health and disease. Acta neuropathologica. 2010;120(6):689-705.
3. Horsburgh A, Massoud TF. The circumventricular organs of the brain: conspicuity on clinical 3T MRI and a review of functional anatomy. Surgical and Radiologic Anatomy. 2013;35(4):343-9.
4. Li N-C, Lee A, Whitmer RA, Kivipelto M, Lawler E, Kazis LE, et al. Use of angiotensin receptor blockers and risk of dementia in a predominantly male population: prospective cohort analysis. Bmj. 2010;340:b5465.
5. Steinman L. Elaborate interactions between the immune and nervous systems. Nature immunology. 2004;5(6):575.
6. Jolles J, Houx P, Van Boxtel M, Ponds R. Maastricht aging study: Determinants of cognitive aging: Neuropsych Publishers Maastricht; 1995.
7. van de Haar HJ, Burgmans S, Jansen JF, van Osch MJ, van Buchem MA, Muller M, et al. Blood-brain barrier leakage in patients with early Alzheimer disease. Radiology. 2016;281(2):527-35.
8. Tofts PS, Brix G, Buckley DL, Evelhoch JL, Henderson E, Knopp MV, et al. Estimating kinetic parameters from dynamic contrast‐enhanced T1‐weighted MRI of a diffusable tracer: standardized quantities and symbols. Journal of Magnetic Resonance Imaging: An Official Journal of the International Society for Magnetic Resonance in Medicine. 1999;10(3):223-32.
9. Barnes SR, Ng TS, Santa-Maria N, Montagne A, Zlokovic BV, Jacobs RE. ROCKETSHIP: a flexible and modular software tool for the planning, processing and analysis of dynamic MRI studies. BMC medical imaging. 2015;15(1):19.
10. Barnston AG. Correspondence among the correlation, RMSE, and Heidke forecast verification measures; refinement of the Heidke score. Weather and Forecasting. 1992;7(4):699-709.
11. Morita S, Miyata S. Different vascular permeability between the sensory and secretory circumventricular organs of adult mouse brain. Cell and tissue research. 2012;349(2):589-603.
12. Johnson AK, Gross P. Sensory circumventricular organs and brain homeostatic pathways. The FASEB Journal. 1993;7(8):678-86.
Figures