0007
Whole tumor pharmacokinetic model analysis with 3D isotropic high resolution using 3D-UTE-GRASP sequence at 7T
Jin Zhang1, Karl Kiser1, Chongda Zhang1, Ayesha Bharadwaj Das1, and Sungheon Gene Kim1
1New York University School of Medicine, New York, NY, United States
1New York University School of Medicine, New York, NY, United States
Synopsis
Quantitative pharmacokinetic model parameter maps from dynamic contrast enhanced (DCE)-MRI can provide useful physiologically relevant information about tumor microenvironment, but often in low spatial resolution due to challenges in acquiring high resolution 3D data with high temporal resolution. The purpose of this study is to investigate the feasibility of generating the whole tumor high resolution pharmacokinetic model parameter maps with the 3D-UTE-GRASP1 sequence for both T1 mapping and dynamic scan.
Introduction
T1-weighted DCE-MRI has been widely used to assess tissue microenvironment of cancer in various studies typically with relatively low spatial and/or temporal resolution. We recently developed a 3D-UTE-GRASP (Golden angle Radial Sparse Parallel) sequence1 for DCE-MRI study, which acquires 3D isotropic high resolution data with the flexibility of off-line image reconstruction for a temporal resolution even close to 1 s/frame. The same sequence can also be used to measure the T1 map at the same 3D isotropic resolution. In this study, we investigate the feasibility of using 3D-UTE-GRASP sequence for whole tumor quantification of pharmacokinetic parameter maps by combining 3D isotropic high resolution T1 map and dynamic contrast enhanced imaging data.Methods
Six to eight-week-old C57BL6 mice (n = 5) with GL261 mouse glioma models were included in this study. MRI experiments were performed on a Bruker 7T micro-MRI system, with a 1H four-channel phased array receive-only MRI coil. DCE-MRI acquisition was performed using 3D-UTE-GRASP pulse sequence (TR = 4 ms and TE = 0.028 ms) to achieve an isotropic spatial resolution and to minimize the T2* effect. Image matrix = 128x128x128, field of view = 20x20x20 mm and the spatial resolution was 0.156x0.156x0.156 mm. The 3D UTE sequence was continuously run to acquire 154,080 spokes (51,360 spokes each flip angle segment 8o - 25o - 8o) for 10 minutes and 13 seconds. The joint compressed sensing and parallel imaging reconstruction was implemented based on the 3D-UTE-GRASP algorithm1 with temporal frame resolution T = 5 s/frame. A bolus of Gd-DTPA in saline at the dose of 0.2 mmol/kg was injected through a tail vein catheter, starting 60 seconds after the start of data acquisition. Before contrast injection, 3D isotropic high resolution T1 map was obtained using the same 3D-UTE-GRASP sequence2 with variable flip angles (8o - 2o - 12o, 12,776 spokes for each flip angle, with total acquisition time was 153 s). Arterial input function (AIF) was obtained following the Principal Component Analysis (PCA) method used in our previous study3 with the measured T1 map described above. Pharmacokinetic model analysis was carried out for the whole brain with Generalized Kinetic Model (GKM)4. To compare with traditional lower resolution DCE-MRI study with a slice thickness much higher than the in-plane resolution, six axial slices (0.156 mm slice thickness) in tumor center was averaged to emulate same in plane resolution but with thicker slice thickness about 1 mm (0.156 mm x 6 =0.94 mm). The mice were treated in strict accordance with the National Institutes of Health Guide for the Care and Use of Laboratory Animals, and this study was approved by the Institutional Animal Care and Use Committee.Results
Figure 1 shows the 3D rendering of the mouse brain and whole head high resolution Ktrans, ve, and vp maps, which demonstrate the feasibility of obtaining 3D isotropic high resolution pharmacokinetic parameter maps using the method proposed. Figure 2 shows the comparison between the two methods (6-slice .vs. average), with 6-slice method showed more apparent structure details than the averaged one slice. Figure 3 shows the boxplots for comparison between the two methods, with mean ± std and [25, 50, 75]% quartiles summarized in Table 1. It can be observed that the median values and inter quartile ranges of all the parameters are quite close, which demonstrate that the average method is capable of reflecting the tumor microenvironment parameters as good as the 3D isotropic high resolution method. However, the 3D isotropic high resolution analysis gives more detailed information and structures of tumor micro environment as can be seen in Figure 2. Similar observation was made with other mice in the study.Discussion and Conclusion
This study demonstrates the feasibility of using 3D-UTE-GRASP sequence for 3D isotropic high resolution pharmacokinetic model analysis. Compared to traditional DCE-MRI methods with thick slices, the proposed method can provide more detailed tumor micro structures and can be segmented in any direction for better matching with histology. Future study will include assessment of tumor treatment response using the proposed 3D high resolution imaging and quantitative pharmacokinetic analysis.Acknowledgements
NIH R01CA160620, NIH R01CA219964, P41EB017183, NIH/NCI 5P30CA016087References
- J. Zhang, L. Feng, R. Otazo and S. Kim, MRM, 2019 Jan;81(1):140-152.
- J. Zhang, K. Kiser and S. Kim, submitted to ISMRM 2020.
- J. Zhang and S. Kim, NMR in Biomedicine, 2019 Nov;32(11),e4135
- P.S.Tofts, JMRI 1997(7)91–101.
Figures
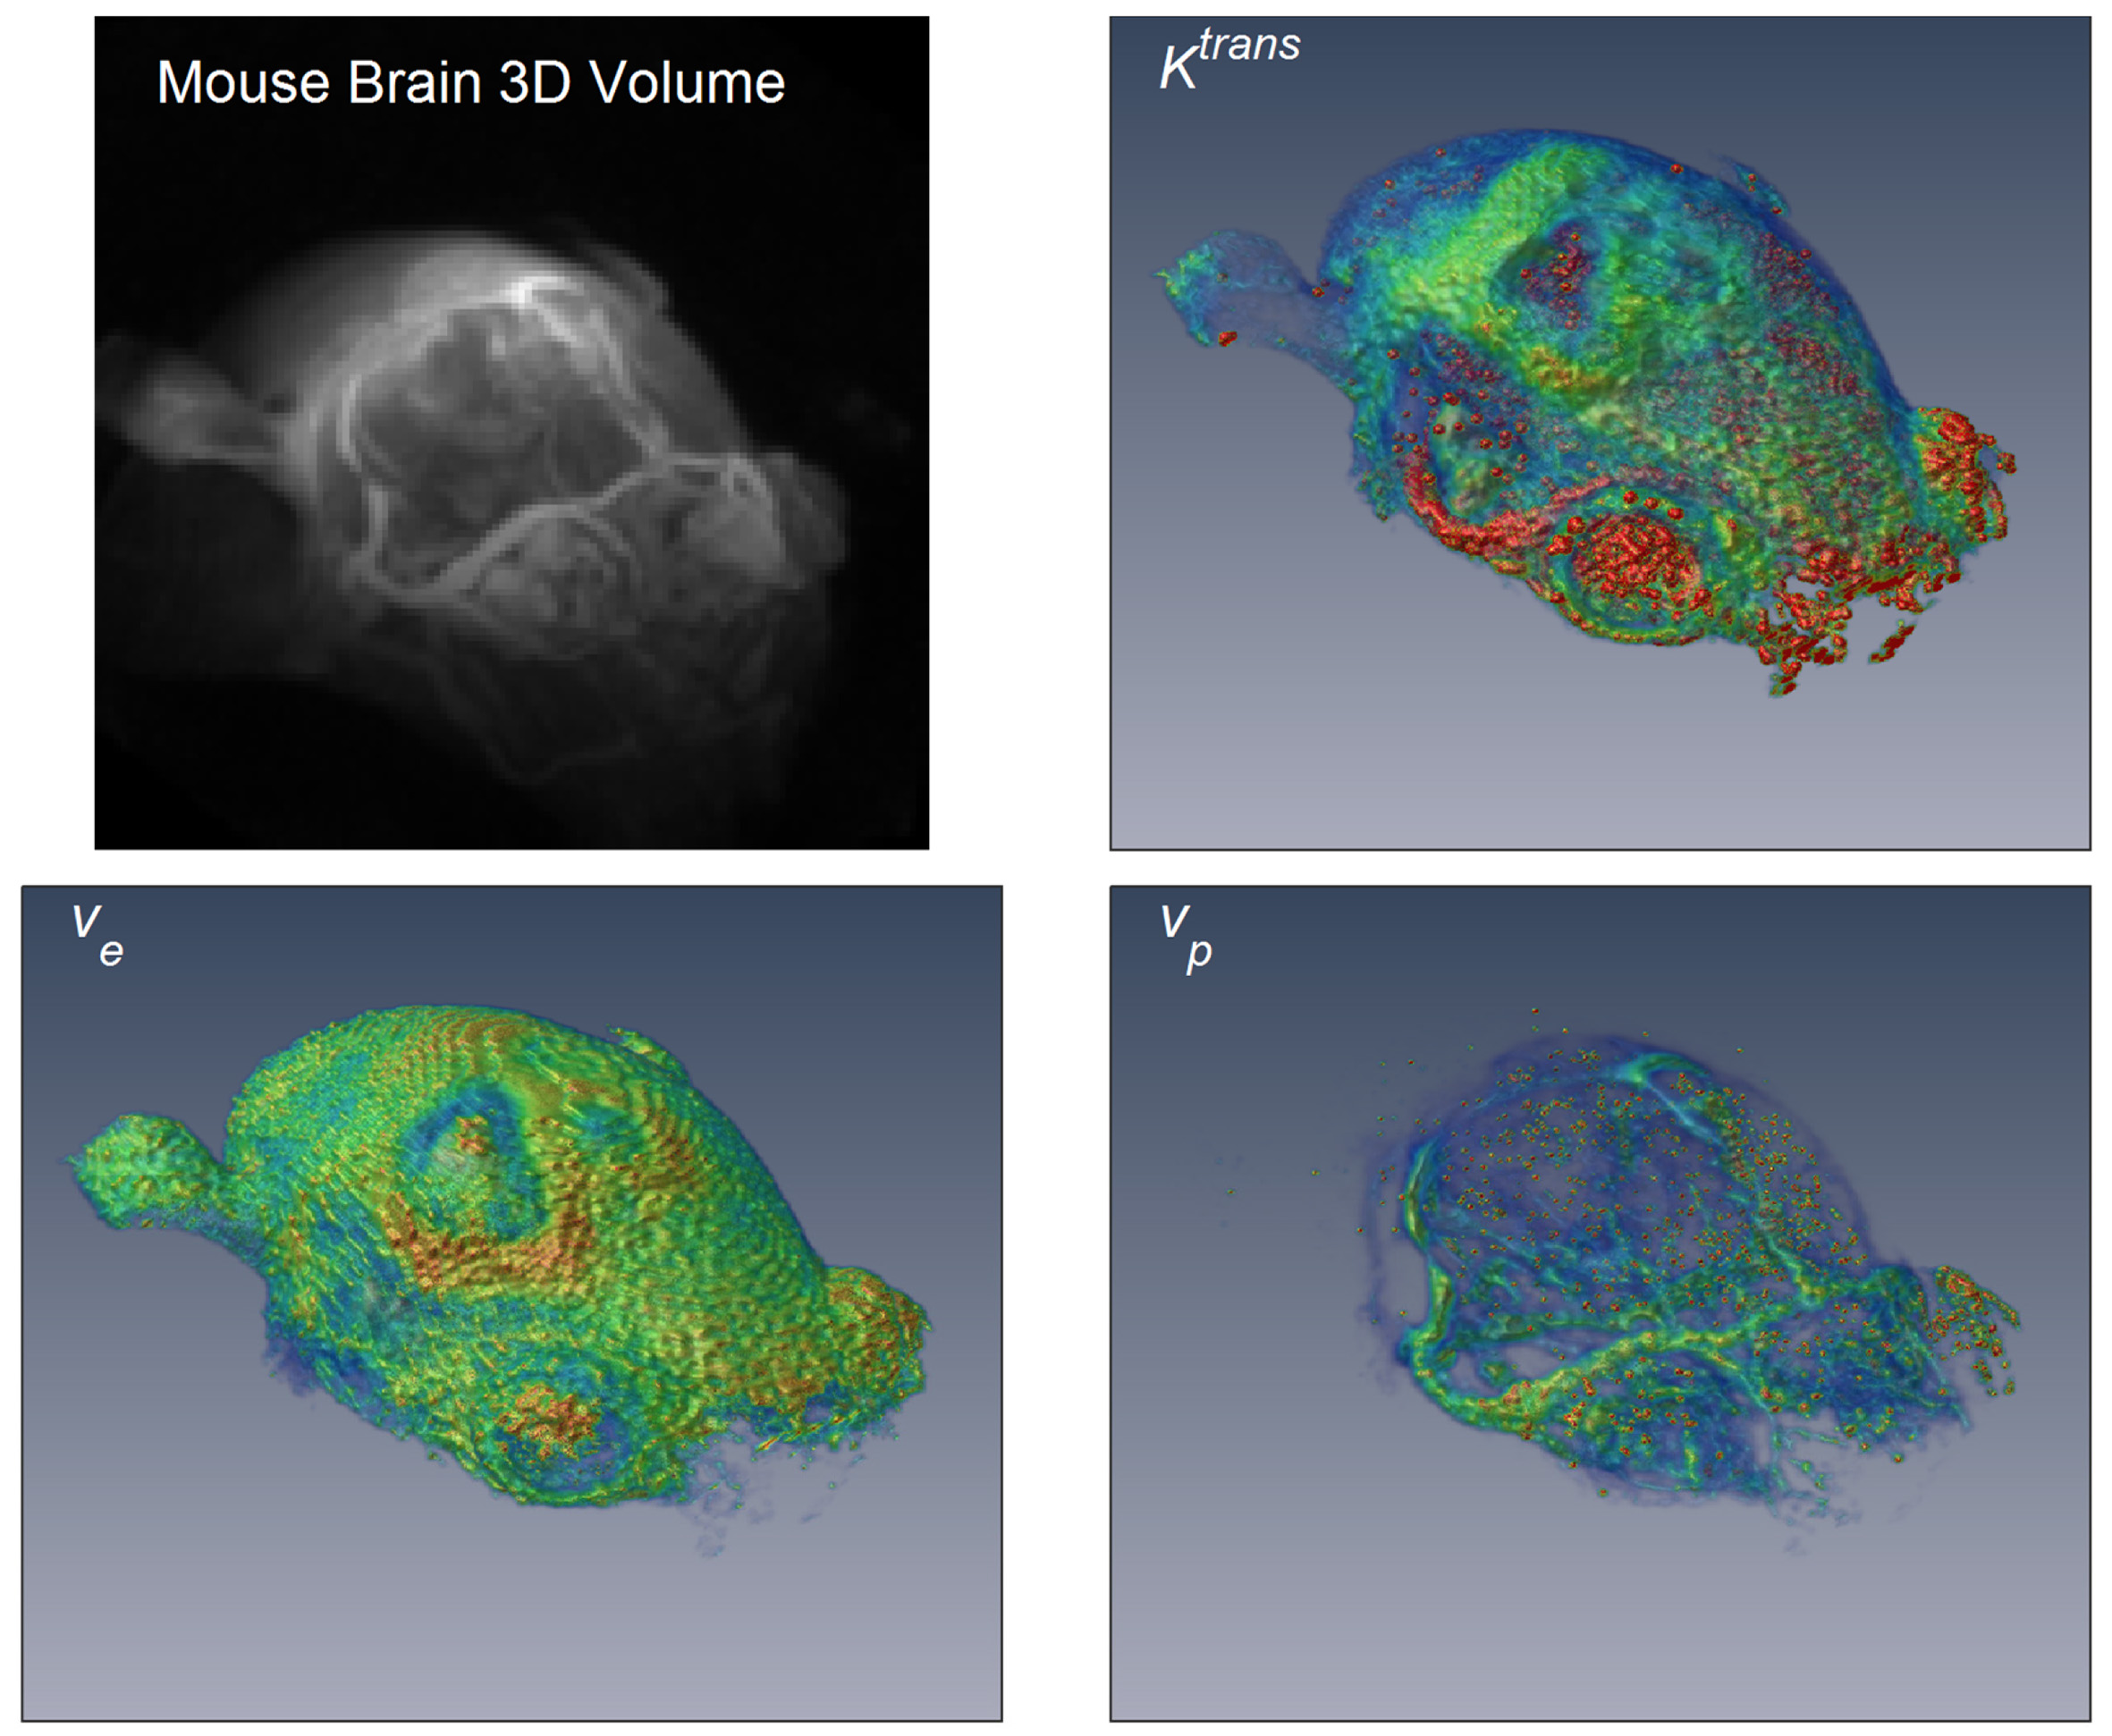
Figure 1. 3D rendering of DCE-MRI frame at enhancement
peak (15 s after contrast injection) and 3D isotropic high resolution rendering
of the estimated parameters Ktrans
(transfer constant), ve
(interstitial space volume fraction), and vp
(vascular space volume fraction).
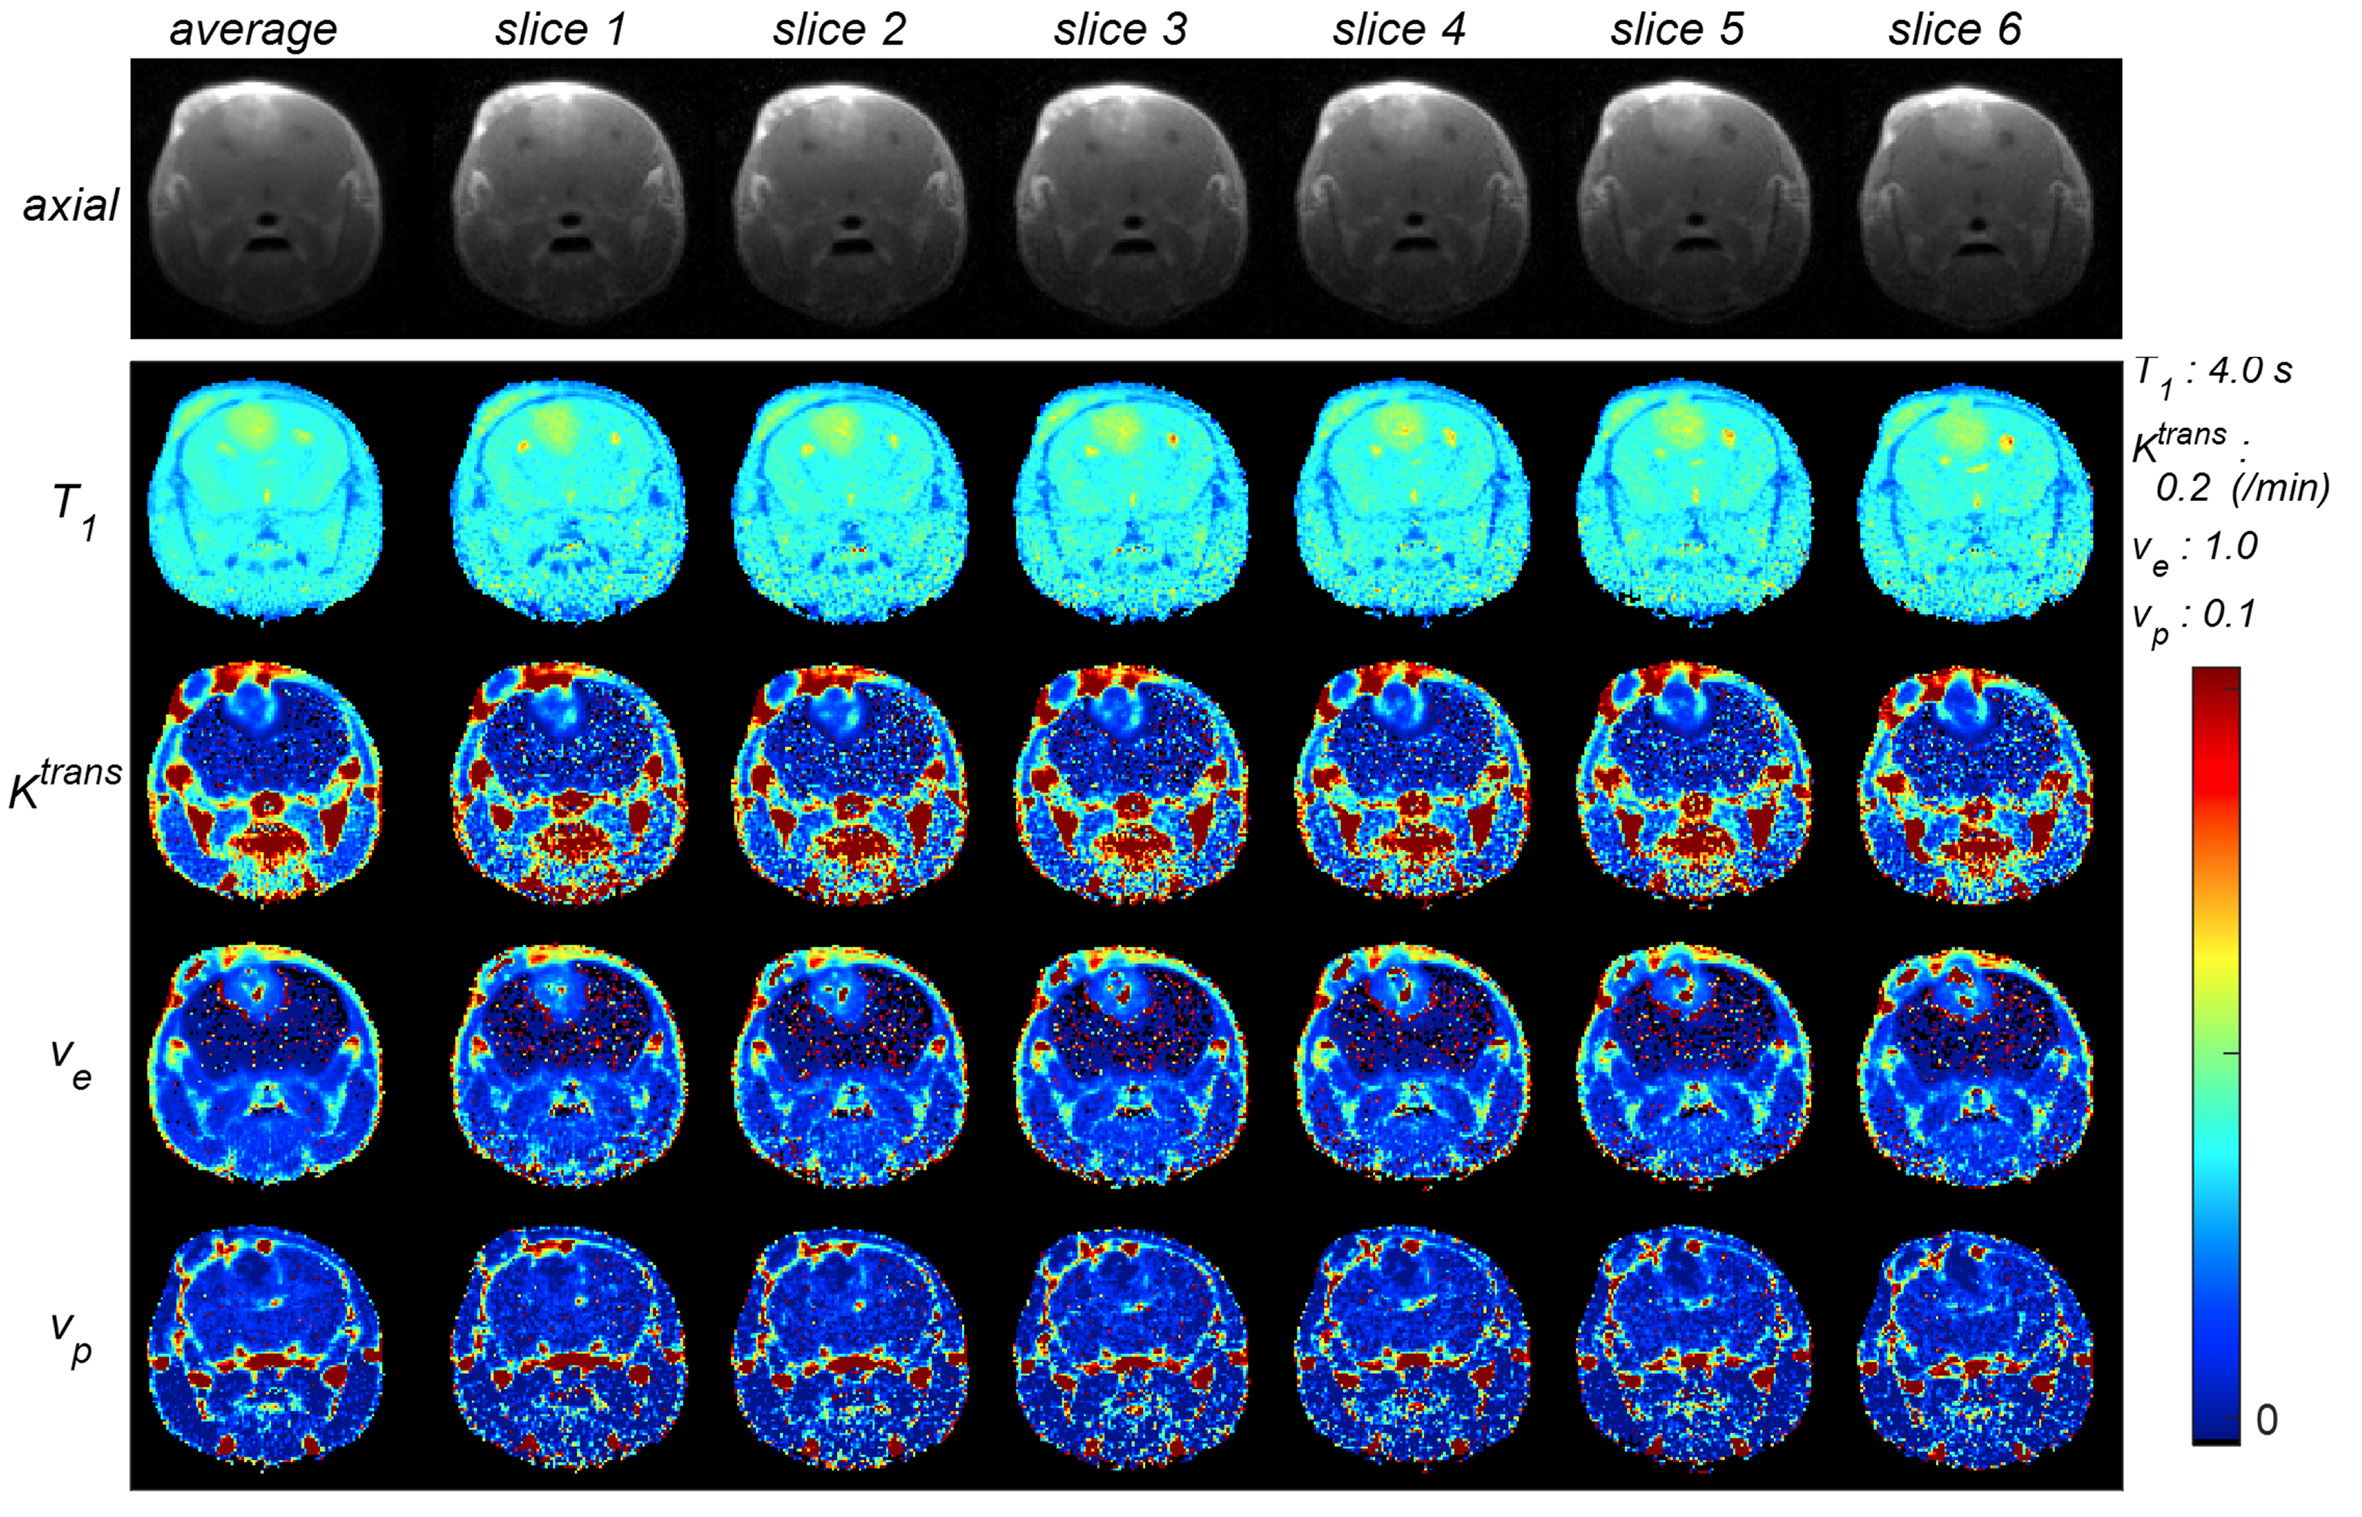
Comparison between high resolution parameter
maps (slice 1 ~ slice 6) to their average. The 1st row shows the axial image,
and T1, Ktrans, ve, and vp
maps are shown in the 2nd row to 5th row.
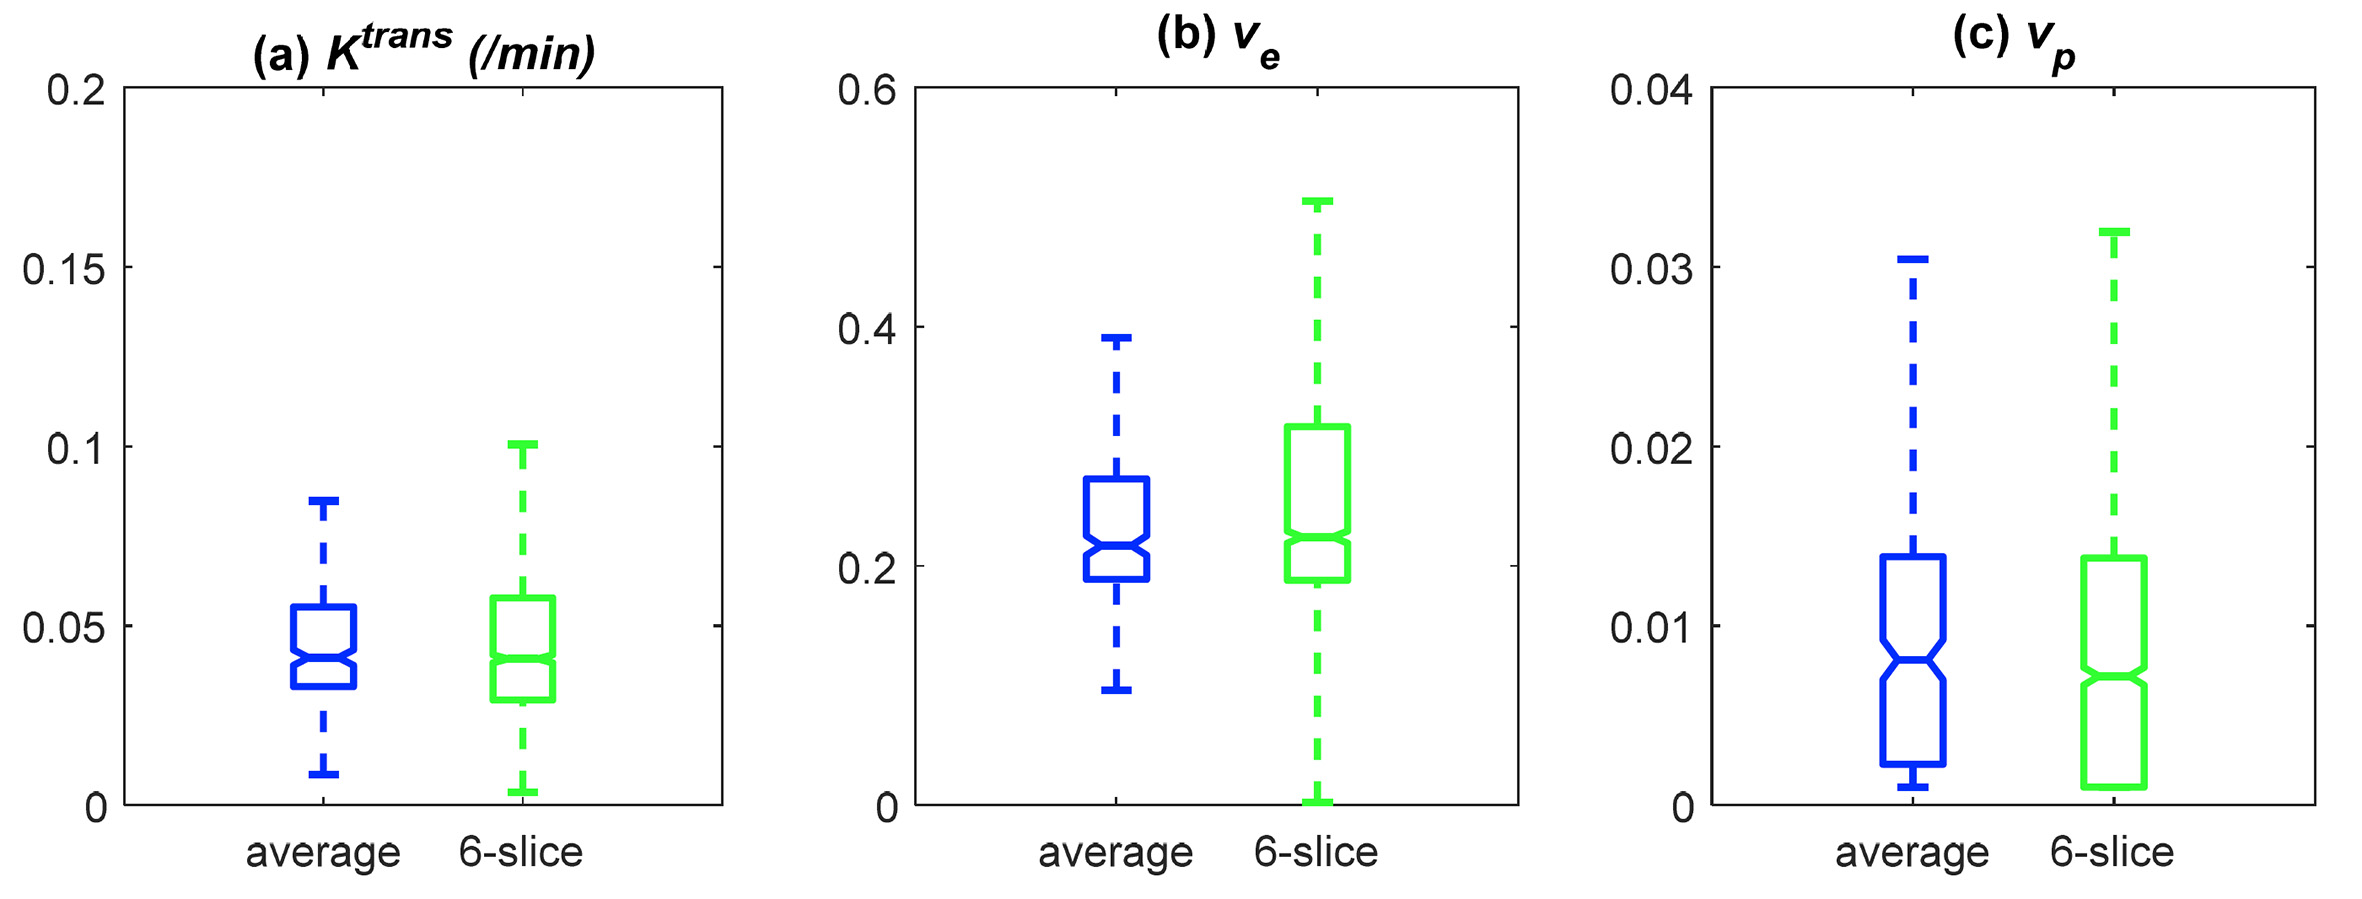
Figure 3. Boxplot comparison of Ktrans, ve,
vp estimated from the high resolution slices (pooled together) and
estimated from the average of the six slices.

Table 1. Comparison between the two methods: average
.vs. 6-slices