0004
Multi-pathway multi-echo acquisition and contrast translation to generate a variety of quantitative and qualitative image contrasts1Department of Radiology, Brigham and Women’s Hospital, Harvard Medical School, Boston, MA, United States, 2Department of Computer Science and Engineering, National Sun Yat-sen University, Kaohsiung, Taiwan
Synopsis
Ideally, neuro exams would include a variety of contrast types along with basic MRI parametric maps, with full-brain 3D coverage and good spatial resolution. However, tradeoffs exist between the number of contrasts, spatial coverage, spatial resolution, and scan time. We developed a 3D multi-pathway multi-echo (MPME) sequence that rapidly captures vast amounts of information about the object, and a ‘contrast translator’ to convert this information into desired contrasts. More specifically, a neural network converts 3D full-brain MPME data acquired in about 7 min into MPRAGE, FLAIR, T1W, T2W, T1 and T2 volumes, with the goal of abbreviating neuro exams.
Introduction
The goal of this project is to develop an abbreviated comprehensive multi-contrast brain MRI exam. At our institution, approximately 40% of all MRI exams are brain exams and time slots are either 30- or 40-min long. The relatively long scan times stem from the need to acquire several different tissue contrasts and/or different plane orientations; quantitative imaging acquisitions (1-7) are not typically included, due to time constraints.Ideally, a neuro exam would include traditionally-employed contrasts along with quantitative parametric maps, with 3D full-brain coverage and good spatial resolution. However, for a limited scan time, tradeoffs limit the number of contrasts that can be obtained as well as the coverage and resolution that can be achieved. We developed a new 3D multi-pathway multi-echo (MPME) pulse sequence that rapidly captures vast amounts of information about the imaged object but not necessarily with image contrasts that radiologists could readily read (7). A neural network (NN) was trained as a ‘contrast translator’, to convert the MPME information into some of the most common contrasts in neuro imaging (MPRAGE, T2-FLAIR, T1W, T2W) along with quantitative parameter maps (T1, T2, B0). As a result, a near-complete exam can be generated based on one 7-min MPME scan followed by NN-based contrast translation (1.2 mm isotropic resolution, full-brain coverage).
Methods
Following informed consent, eight healthy subjects (1/7 female/male, 32±9 y-o) were scanned on a 3T system (Siemens Trio). A full-brain 3D MPME scan sampled four signal pathways (−2nd, −1st, 0th, and 1st) in two separate readout groups, see Fig. 1a. The main parameters were: TR=20ms, α=15°, 1.2 mm isotropic resolution, with a product 12-channel head matrix. A PROPELLER-like scheme (8) was implemented in the ky-kz plane for increased motion robustness (9), see Fig. 1b. Scan time was 6ʹ41ʺ for seven of the eight volunteers and 7ʹ58ʺ for the other volunteer; the longer scan time was needed for increased coverage due to larger head size. MPME data were reconstructed using the BART toolbox (10) and the NCIGT fast-imaging library (11). B0 maps were computed from MPME data in a conventional manner (Fig. 2a).Several conventional scans were also performed, for training and validation purposes: IR-SE to generate 2D T1 maps (TE/TR=88/6000ms, TI=50, 300, 800, 2400ms, 12ʹ20ʺ); SE to generate 2D T2 maps (TR=1000ms, TE=25, 50, 90, 120ms, 10ʹ08ʺ); 3D MPRAGE (TE/TR/TI=3.76/1750/900ms, α=9°, 3ʹ42ʺ); and 2D FLAIR (TE/TR/TI=88/6000/2026.6ms, α=130°, 1ʹ38ʺ).
A localized feedforward neural network (NN) was implemented using Keras V.2.2.0 (Tensorflow 1.5.0 backend) in Python 3.6, and trained on an Nvidia Titan Xp GPU (Nvidia Coporation, Santa Clara, CA, USA). The input to the NN consisted of the eight MPME contrasts (4 pathways × 2 echo times, see Fig. 2a) along with the calculated field map, over a patch of 3×3 voxels in the x-y plane. There were 7 output channels: T1, T2, MPRAGE, FLAIR as well as T1-, T2- and PD-weighted contrasts, see Fig. 2b. The mean absolute error loss function was used to train the neural network, using the ‘Adam’ optimizer (12).
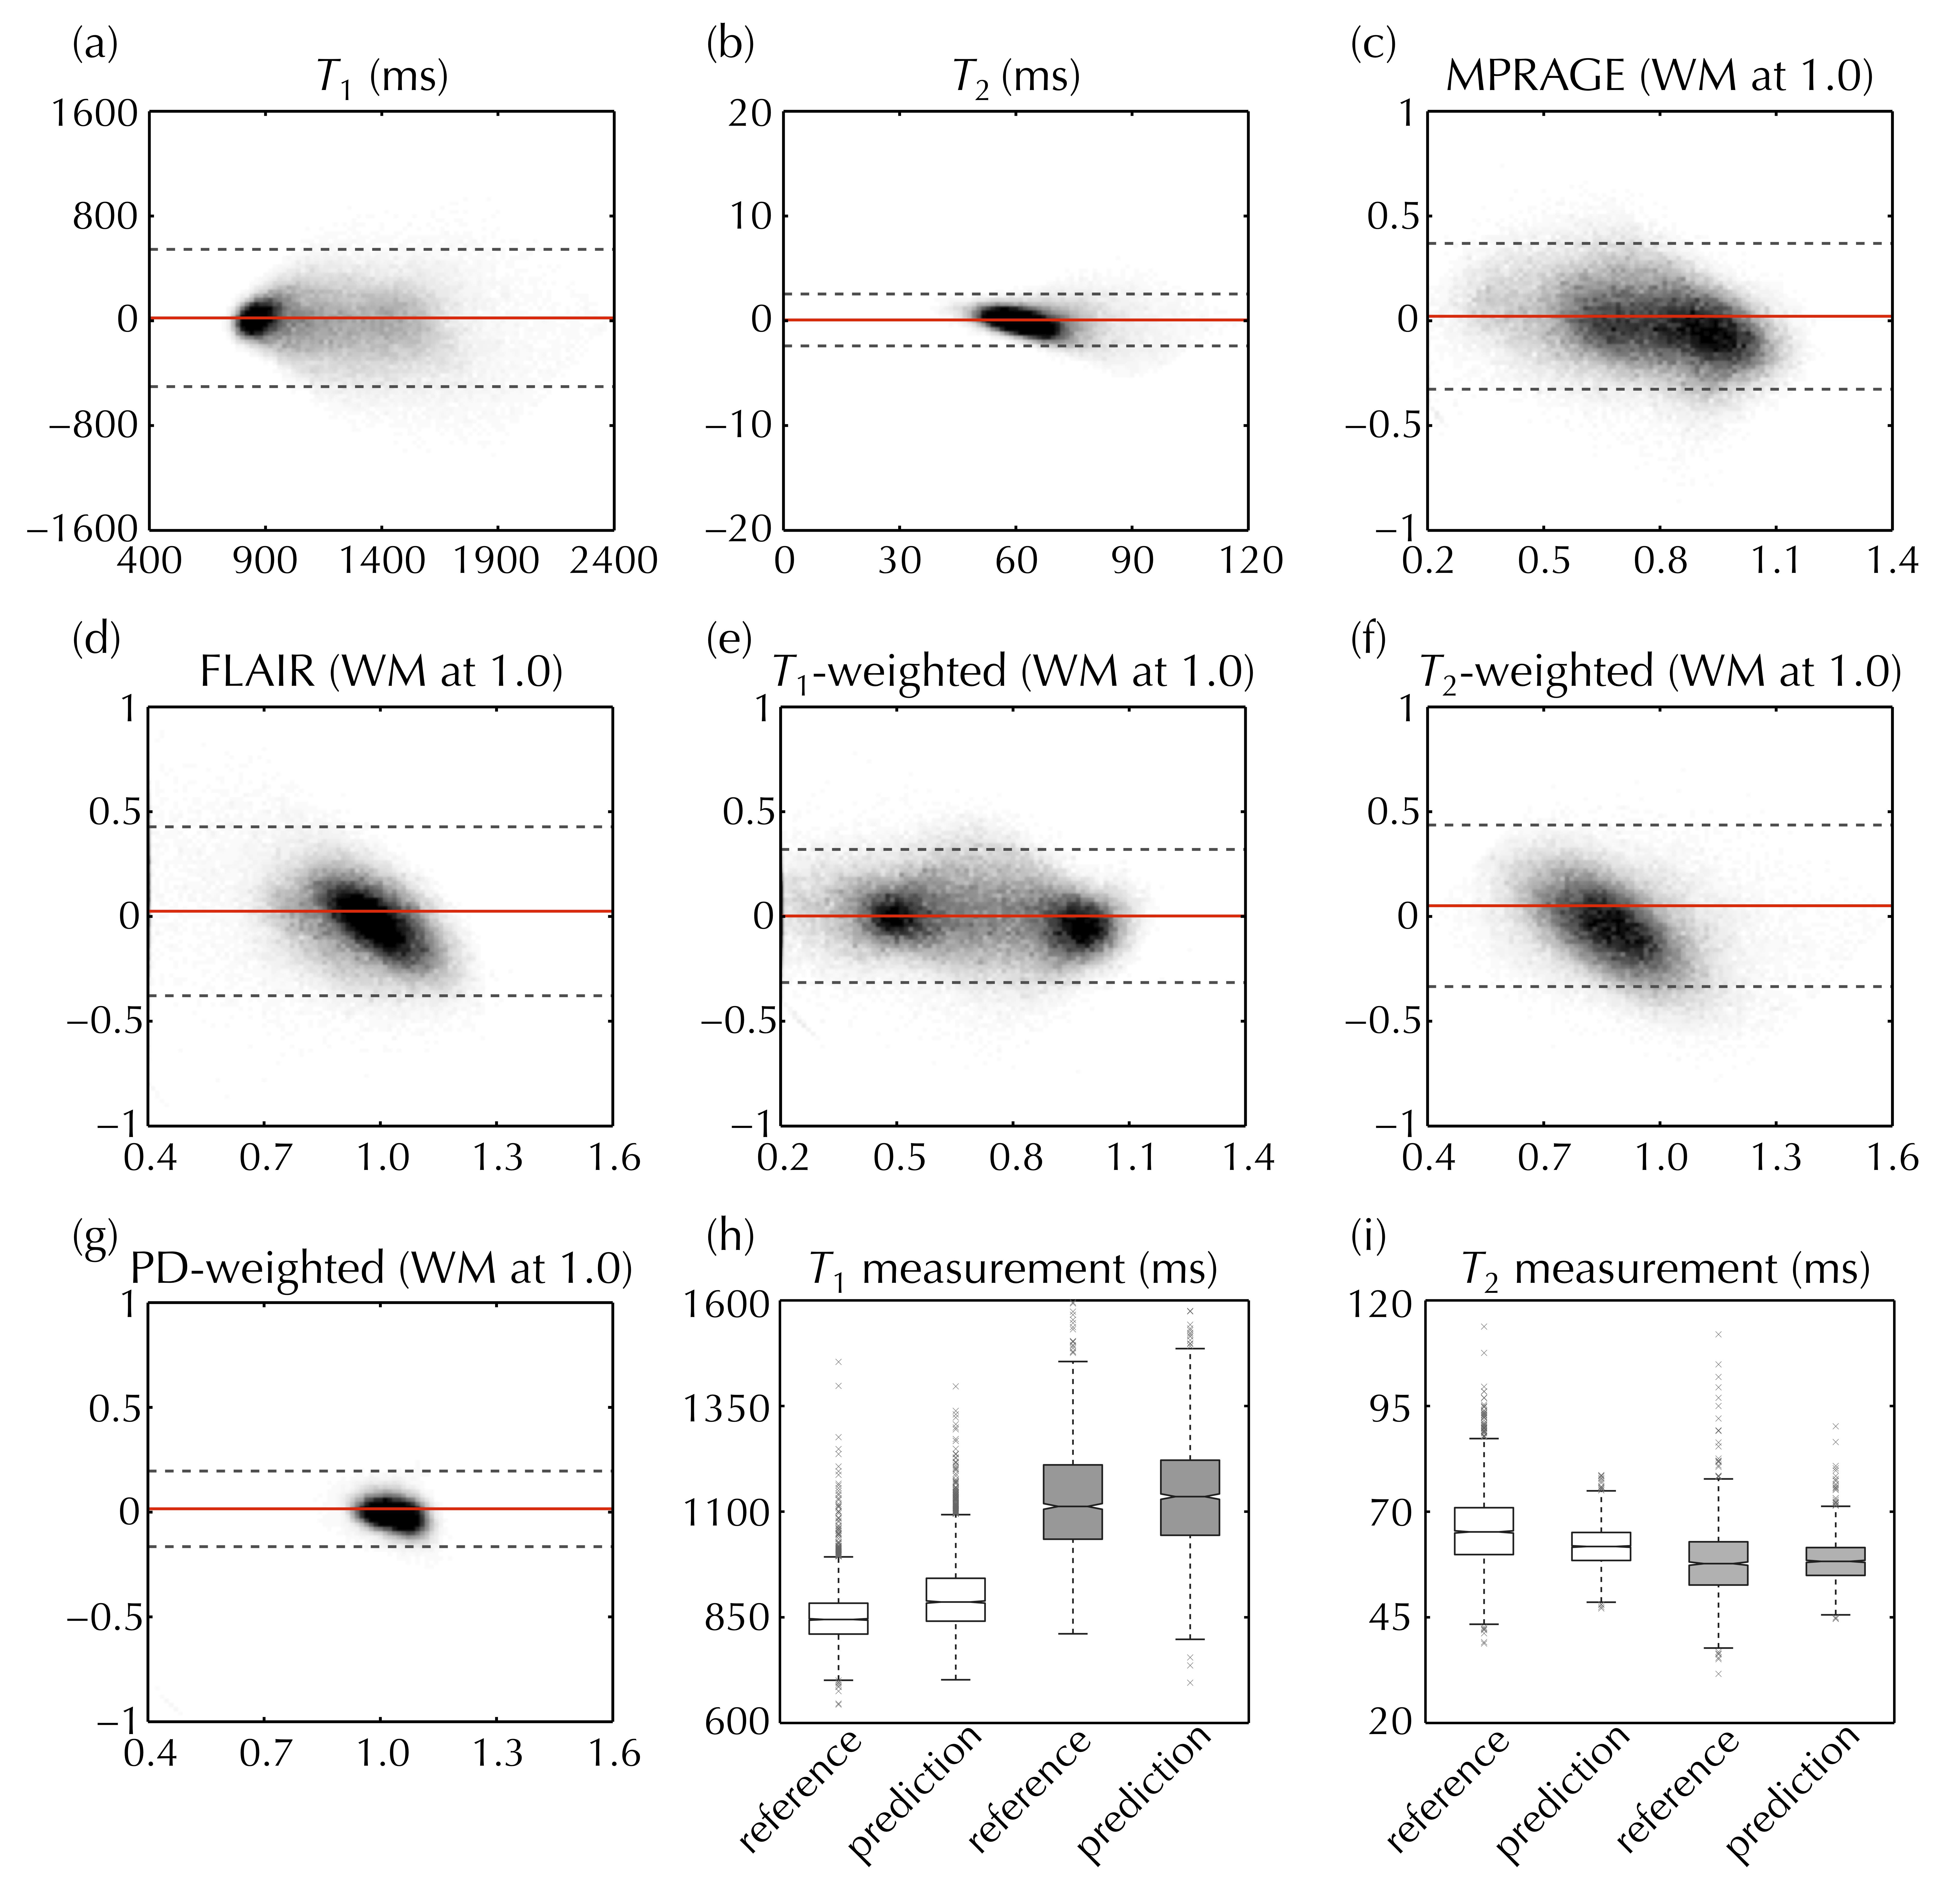
A ‘leave-one-out’ scheme was employed for training/validation: e.g., when using data from Subject #1 for validation purposes, the corresponding NN, called NN1, was trained using data from Subjects #2-8. Even though the number of subjects was relatively small, a large number of signal-containing voxels were available for NN training and validation purposes, about 98,400 voxels. Qualitative contrasts (e.g., MPRAGE and FLAIR) were scaled so that white matter (WM) had a signal of roughly 1.0. Validation was performed at the voxel level using an analysis similar to Bland-Altman plot, and at the ROI level for WM and thalamus tissues.
Results
Figure 3 shows the full 3D NN-generated predictions that emulate T1, T2, FLAIR, T1-, and PD-weighted maps/contrasts, which would typically have to be acquired in separate 2D scans. In Fig. 4, reference (left) and predicted (right) images were compared side-by-side for one representative subject. Figure 5a-g compares reference and predicted values for all voxels from all subjects in Bland-Altman plots. The mean absolute error for T1 and T2 was 216 and 11 ms, and for MPRAGE/FLAIR/T1-weighted/T2-weighted/PD-weighted contrasts they were 0.14/0.15/0.13/0.16/0.05, respectively (where 1.0 corresponds to WM signal level). Figure 5h-i shows the ROI-based validation, where predicted T1 and T2 values were found to be consistent with reference values in WM and thalamus tissues.Discussion and Conclusion
Because all contrasts were translated from a same MPME acquisition, they were essentially perfectly registered to each other, which might facilitate multi-parametric analyses on a pixel-by-pixel basis. A number of additional qualitative and quantitative contrasts not included here might also be of interest; however, in practice the NN could only emulate contrasts that were available for learning purposes and time constraints limited how many training contrasts could be gathered during volunteer exams. As such, the contrasts generated here may not be an exhaustive list of possible output contrasts but merely what we managed to achieve in the present study. In conclusion, an abbreviated brain MRI exam is being developed based on our MPME sequence and machine-learning contrast translation, to hopefully help toward increasing the overall value of MRI.Acknowledgements
Financial support from NIH grants P41EB015898, R21EB019500 and R03EB025546 is acknowledged.References
1. Deoni SC, Rutt BK, Peters TM. Rapid combined T1 and T2 mapping using gradient recalled acquisition in the steady state. Magn Reson Med 2003;49(3):515-526.
2. Warntjes JB, Dahlqvist O, Lundberg P. Novel method for rapid, simultaneous T1, T2*, and proton density quantification. Magn Reson Med 2007;57(3):528-537.
3. Helms G, Dathe H, Dechent P. Quantitative FLASH MRI at 3T using a rational approximation of the Ernst equation. Magn Reson Med 2008;59(3):667-672.
4. Staroswiecki E, Granlund KL, Alley MT, Gold GE, Hargreaves BA. Simultaneous estimation of T(2) and apparent diffusion coefficient in human articular cartilage in vivo with a modified three-dimensional double echo steady state (DESS) sequence at 3 T. Magn Reson Med 2012;67(4):1086-1096.
5. Ma D, Gulani V, Seiberlich N, Liu K, Sunshine JL, Duerk JL, Griswold MA. Magnetic resonance fingerprinting. Nature 2013;495(7440):187-192.
6. Heule R, Ganter C, Bieri O. Triple echo steady-state (TESS) relaxometry. Magn Reson Med 2014;71(1):230-237.
7. Cheng CC, Preiswerk F, Hoge WS, Kuo TH, Madore B. Multipathway multi-echo (MPME) imaging: all main MR parameters mapped based on a single 3D scan. Magn Reson Med 2019;81(3):1699-1713.
8. Pipe JG. Motion correction with PROPELLER MRI: application to head motion and free-breathing cardiac imaging. Magn Reson Med 1999;42(5):963-969.
9. Zaitsev M, Maclaren J, Herbst M. Motion artifacts in MRI: A complex problem with many partial solutions. J Magn Reson Imaging 2015;42(4):887-901.
10. Uecker M. mrirecon/bart: version 0.4.03. 2018. doi:10.5281/zenodo.1215477.
11. Madore B, Hoge WS. NC-IGT Fast Imaging Library. https://ncigt.org/fast-imaging-library Last accessed on 09/11/2018.
12. Kingma DP, Ba J. Adam: A Method for Stochastic Optimization. 3rd International Conference for Learning Representations. San Diego: arXiv:1412.6980v9; 2014.
Figures