0003
MRI Cine-Tagging of Cardiac-Induced Motion for Noninvasive Staging of Liver Fibrosis
Thierry Lefebvre1,2,3, Léonie Petitclerc1,2,4, Mélanie Hébert1,2, Laurent Bilodeau1,2, Giada Sebastiani5, Damien Olivié1, Zu-Hua Gao6, Marie-Pierre Sylvestre2,7, Guy Cloutier1,8,9, Bich N Nguyen10, Guillaume Gilbert1,11, and An Tang1,2,8
1Radiology, Radio-Oncology and Nuclear Medicine, Université de Montréal, Montreal, QC, Canada, 2Centre de recherche du Centre hospitalier de l'Université de Montréal (CRCHUM), Montreal, QC, Canada, 3Medical Physics Unit, McGill University, Montréal, QC, Canada, 4C.J. Gorter Center for High Field MRI, Department of Radiology, Leiden University Medical Center (LUMC), Leiden, Netherlands, 5Department of Medicine, Division of Gastroenterology and Hepatology, McGill University Health Centre (MUHC), Montreal, QC, Canada, 6Department of Pathology, McGill University, Montreal, QC, Canada, 7Department of Social and Preventive Medicine, École de santé publique de l’Université de Montréal (ESPUM), Montreal, QC, Canada, 8Institute of Biomedical Engineering, Université de Montréal, Montreal, QC, Canada, 9Laboratory of Biorheology and Medical Ultrasonics (LBUM), Centre de recherche du Centre hospitalier de l’Université de Montréal (CRCHUM), Montreal, QC, Canada, 10Service of Pathology, Centre hospitalier de l'Université de Montréal (CHUM), Montreal, QC, Canada, 11MR Clinical Science, Philips Healthcare Canada, Montreal, QC, Canada
1Radiology, Radio-Oncology and Nuclear Medicine, Université de Montréal, Montreal, QC, Canada, 2Centre de recherche du Centre hospitalier de l'Université de Montréal (CRCHUM), Montreal, QC, Canada, 3Medical Physics Unit, McGill University, Montréal, QC, Canada, 4C.J. Gorter Center for High Field MRI, Department of Radiology, Leiden University Medical Center (LUMC), Leiden, Netherlands, 5Department of Medicine, Division of Gastroenterology and Hepatology, McGill University Health Centre (MUHC), Montreal, QC, Canada, 6Department of Pathology, McGill University, Montreal, QC, Canada, 7Department of Social and Preventive Medicine, École de santé publique de l’Université de Montréal (ESPUM), Montreal, QC, Canada, 8Institute of Biomedical Engineering, Université de Montréal, Montreal, QC, Canada, 9Laboratory of Biorheology and Medical Ultrasonics (LBUM), Centre de recherche du Centre hospitalier de l’Université de Montréal (CRCHUM), Montreal, QC, Canada, 10Service of Pathology, Centre hospitalier de l'Université de Montréal (CHUM), Montreal, QC, Canada, 11MR Clinical Science, Philips Healthcare Canada, Montreal, QC, Canada
Synopsis
MR elastography techniques for staging liver fibrosis assess the right liver and require additional hardware. MRI cine-tagging evaluates the strain of liver tissue and shows promise for staging liver fibrosis without additional hardware. It can be performed routinely during MRI examinations. Strain showed high correlation with fibrosis stages (ρ = -0.68, P < 0.0001). AUC was 0.81 to distinguish fibrosis stages F0 vs. ≥F1, 0.84 for ≤F1 vs. ≥F2, 0.86 for ≤F2 vs. ≥F3, and 0.87 for ≤F3 vs. F4. It could be used to assess the left liver lobe as a complement to MR elastography assessing the right lobe.
Abbreviations
SPAMM = Spatial modulation of magnetizationHARP = Harmonic phase
ROC = Receiver operating characteristics
AUC = Area under the ROC curve
Background
Liver fibrosis, which is characterized by collagen deposition in the extracellular matrix, is a hallmark feature of chronic liver disease in response to injury.1 Elastography techniques currently provide the high diagnostic accuracy for noninvasive staging of liver fibrosis.2 However, commercially available methods require external hardware to generate shear waves and predominantly assess the right liver lobe.3 An alternative approach relies on intrinsic cardiac motion as a source of tissue deformation – or strain – in the left liver lobe as a biomarker of liver fibrosis. Previous studies investigated liver strain as a surrogate biomarker of liver fibrosis using small sample sizes4,5,6 or in cohorts of healthy volunteers and cirrhotic patients.4,5,7Purpose
The purpose of this study was to evaluate the diagnostic performance of magnetic resonance imaging (MRI) cine-tagging of cardiac-induced motion for staging liver fibrosis, using liver biopsy as the reference standard in a cohort of patients with chronic liver disease.Methods
This institutional review board-approved cross-sectional study included adult patients with chronic liver disease – hepatitis B virus, hepatitis C virus, nonalcoholic fatty liver disease, nonalcoholic steatohepatitis, or autoimmune hepatitis – undergoing liver biopsy as part of their standard of care. Participants were recruited at the hepatology clinics of the two participating institutions between September 2014 and September 2018. MRI examinations were performed on a 3.0 T clinical system (Achieva TX, Philips Healthcare, Best, Netherlands). A 2D multi-slice gradient-echo sequence with tagging was acquired with peripheral pulse-wave triggering. A spatial modulation of magnetization (SPAMM) preparation was used to generate a grid corresponding to a sinusoidal magnetization pattern in the image. The sequence parameters were: TR = 4.9ms, TE = 2.8ms, number of phases per cardiac cycle = 12-15, flip angle = 10°, field of view = 420 x 420mm2, in-plane resolution = 1.3mm x 1.3mm, slice thickness = 8mm, 2 coronal slices with a 16mm gap, tag spacing = 8mm, tag orientation = 0 and 90°, receiver bandwidth = 430Hz/pixel, SENSE acceleration factor = 2, number of averages = 1, acquisition time of approximately 16s per slice (according to patient’s heartbeat frequency). Images were acquired within two successive breath holds at end expiration. Post-processing was performed with the harmonic phase (HARP) software (HARP v.2.1 for MATLAB, Johns Hopkins University, Baltimore, MD; http://iacl.ece.jhu.edu/index.php/Resources#HARP).8 The sinusoidal magnetization pattern in the images produces harmonic peaks in the Fourier domain that carry information about magnitude and phase. Since the phase is constant for a given point in a volume through time, movements of each point can be tracked using the corresponding HARP images. The strain tensor for every point in the image can be evaluated.9 Values of strain on two coronal slices were evaluated in a region-of-interest (ROI) of 2200 mm2 on each slice in the liver automatically selected close to the heart apex and then averaged. The pathologist was blinded to MRI cine-tagging results. The image analyst was blinded to the biopsy results. Liver strain was investigated as a surrogate biomarker of liver fibrosis. Spearman's correlation, Kruskal-Wallis test, Mann-Whitney U test, and receiver operating characteristic (ROC) analyses were performed. Bootstrapping was used to estimate the 95% confidence intervals of area under ROC curves (AUC). Thresholds resulting in a sensitivity approaching 90% were identified and the corresponding specificity, accuracy, positive predictive value, and negative predictive value were reported.Results
Seventy-six subjects were included. Liver strain decreased with higher histological fibrosis stage and was significantly correlated with histological fibrosis stage (ρ = -0.68, P < 0.0001) (Figure 1). Strain values were significantly different across all fibrosis stages (P < 0.0001) and between pairs of fibrosis stages ≤F3 vs. F4 (P < 0.05). Figure 2 summarizes the performance of liver strain for staging liver fibrosis. Figure 3 shows a box and whisker plot of liver strain vs. fibrosis stages. Figure 4 shows ROC curves of liver strain vs. dichotomized fibrosis stages.Conclusion
Liver strain measured with MRI cine-tagging of cardiac-induced motion shows promise as a noninvasive technique for staging liver fibrosis without additional elastography hardware. It could be used to assess the left liver lobe as a complement to clinically available MR elastography techniques assessing the right lobe. Larger studies in cohorts with specific chronic liver disease will be required to validate this technique for the staging of liver fibrosis.Acknowledgements
A.T. Funding for this project was supported by grants from the Canadian Institutes of Health Research (CIHR)-Institute of Nutrition, Metabolism and Diabetes (INMD) (CIHR-INMD #273738 and #301520), from the Fonds de recherche du Québec en Santé (FRQS) and Fondation de l'association des radiologistes du Québec (FARQ) Clinical Research Scholarship – Junior 1 and 2 Salary Award (FRQS-FARQ #26993 and #34939), and from the Centre de recherche du Centre hospitalier de l’Université de Montréal (CRCHUM) to An Tang. G.S. Junior 1 and 2 Salary Award from FRQS (FRQS #27127 and #267806) and research salary from the Department of Medicine of McGill University to Giada Sebastiani. M.P.S. Junior 1 Salary Award (FRQS #34875) to Marie-Pierre Sylvestre.References
- Friedman SL. Mechanisms of hepatic fibrogenesis. Gastroenterology. 2008;134(6):1655-69.
- Lefebvre T, Wartelle-Bladou C, Wong P, Sebastiani G, Giard JM, Castel H, Murphy-Lavallée J, Olivié D, Ilinca A, Sylvestre MP, Gilbert G, Gao ZH, Nguyen BN, Cloutier G, Tang A. Prospective comparison of transient, point shear wave, and magnetic resonance elastography for staging liver fibrosis. Eur Radiol. 2019 Dec;29(12):6477-6488.
- Tang A, Cloutier G, Szeverenyi NM, Sirlin CB. Ultrasound Elastography and MR Elastography for Assessing Liver Fibrosis: Part 1, Principles and Techniques. AJR Am J Roentgenol. 2015 Jul;205(1):22-32.
- Chung S, Breton E, Mannelli L, Axel L. Liver stiffness assessment by tagged MRI of cardiac-induced liver motion. Magnetic resonance in medicine. 2011;65(4):949-55.
- Mannelli L, Wilson GJ, Dubinsky TJ, et al. Assessment of the liver strain among cirrhotic and normal livers using tagged MRI. Journal of magnetic resonance imaging : JMRI. 2012;36(6):1490-5.
- Harouni AA, Gharib AM, Osman NF, Morse C, Heller T, Abd-Elmoniem KZ. Assessment of liver fibrosis using fast strain-encoded MRI driven by inherent cardiac motion. Magnetic resonance in medicine. 2014.
- Chung S, Kim KE, Park MS, Bhagavatula S, Babb J, Axel L. Liver stiffness assessment with tagged MRI of cardiac-induced liver motion in cirrhosis patients. Journal of magnetic resonance imaging : JMRI. 2014;39(5):1301-7.
- Osman NF, Kerwin WS, McVeigh ER, Prince JL. Cardiac motion tracking using CINE harmonic phase (HARP) magnetic resonance imaging. Magnetic resonance in medicine. 1999;42(6):1048-60.
- Liu X, Prince JL. Shortest path refinement for motion estimation from tagged MR images. IEEE Trans Med Imaging. 2010;29(8):1560-72.
Figures
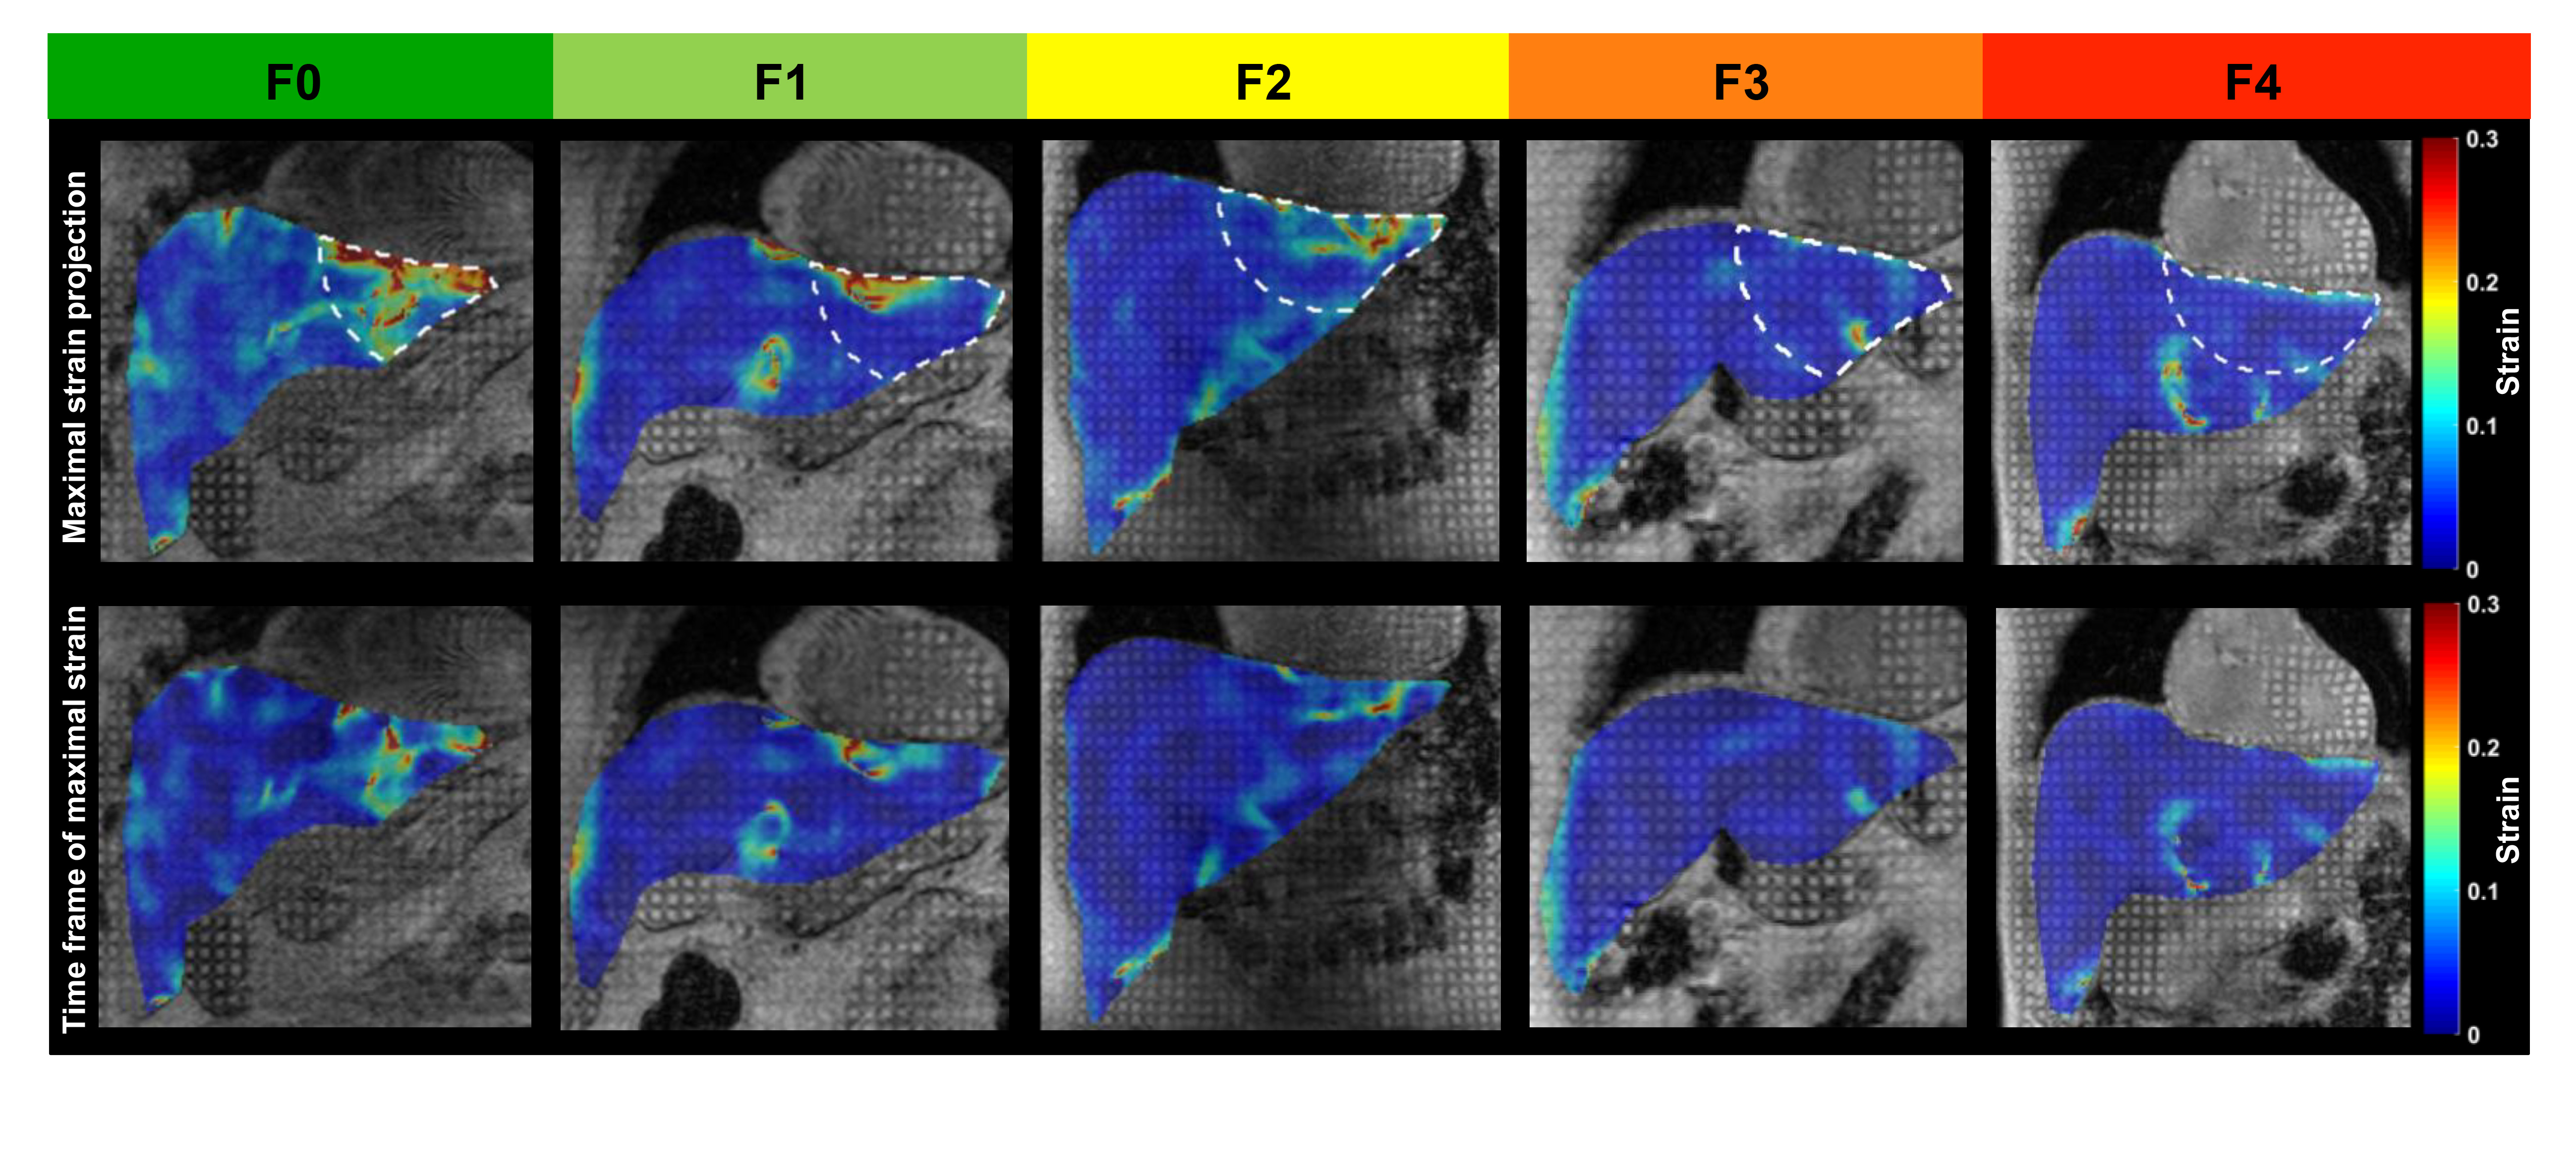
Figure 1. MRI images with
magnetization grid (grayscale) and overlaid strain map (color) in
representative patients with histology-proven liver fibrosis.
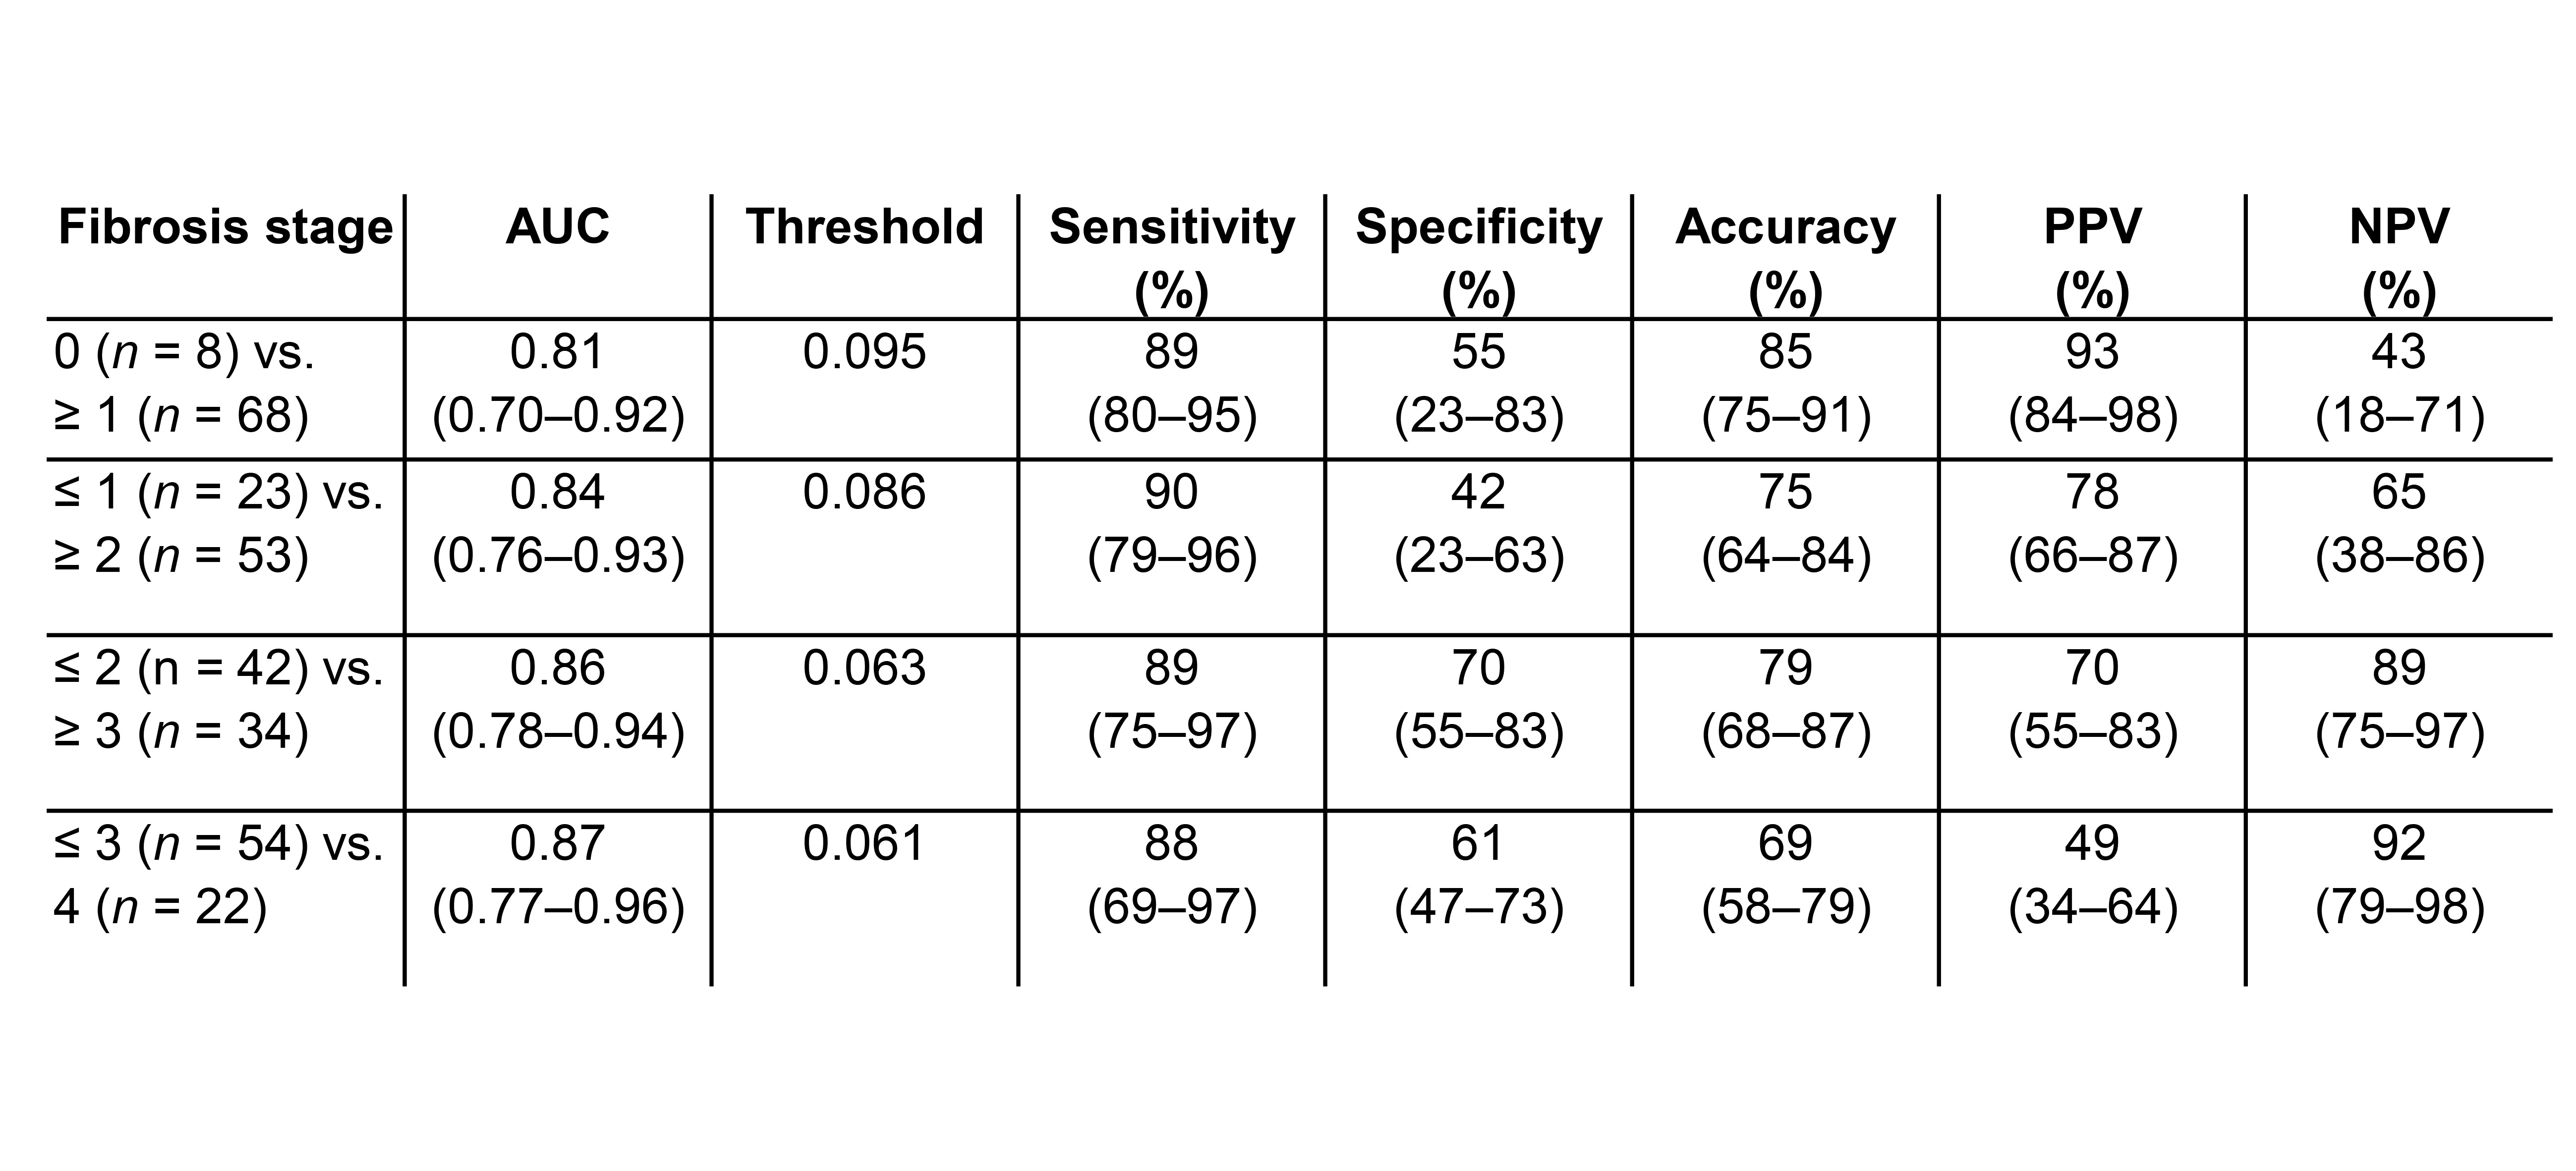
Figure 2. Diagnostic performance of
liver strain measured by MRI cine-tagging of
cardiac-induced motion for staging liver fibrosis.

Figure 3. Box and whisker plot of liver
strain measured by MRI cine-tagging of cardiac-induced motion vs.
histology-proven fibrosis stages.
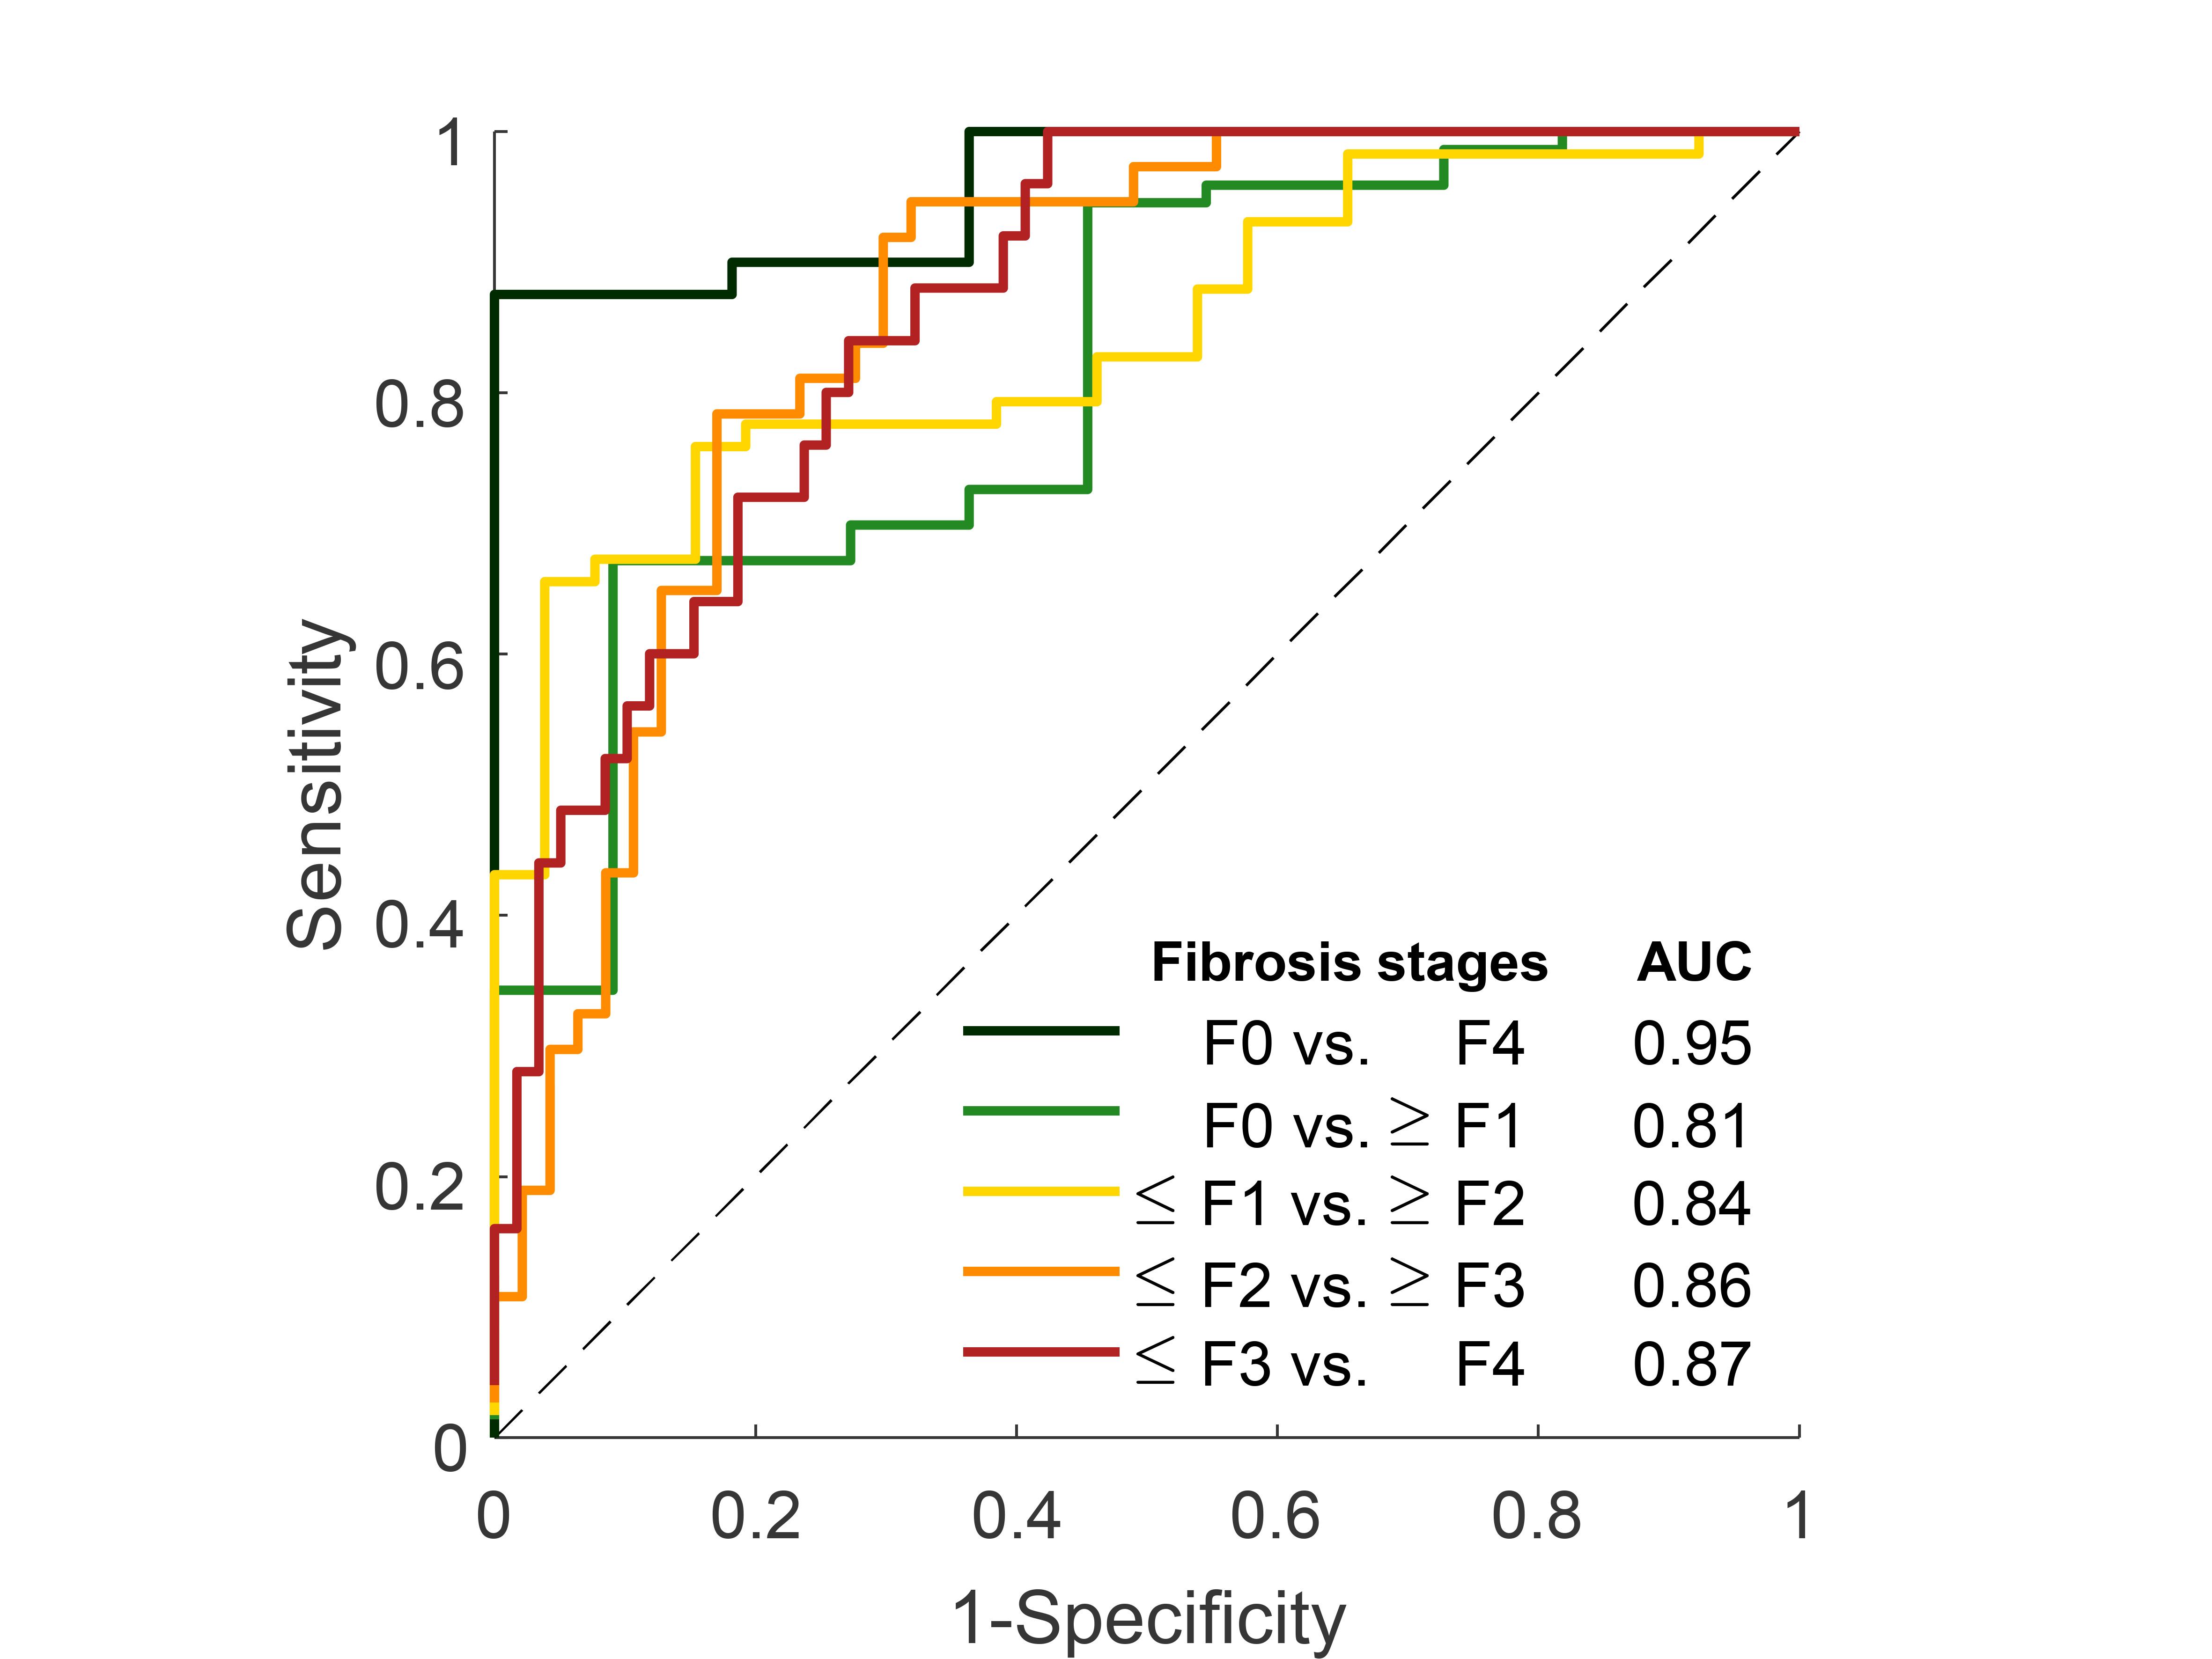
Figure 4. Receiver
operating characteristics (ROC) curves of liver strain for distinguishing
dichotomized stages of liver stages.