0002
Parametric Hemodynamic 4D flow MRI maps for the Characterization of Chronic Thoracic Descending Aortic Dissection1Department of Radiology, Feinberg School of Medicine, Northwestern University, Chicago, IL, United States, 2Department of Radiology and Nuclear Medicine, Radboud University Medical Centre, Nijmegen, Netherlands, 3Division of Cardiac Surgery, Feinberg School of Medicine, Northwestern University, Chicago, IL, United States, 4Department of Radiology, University of Colorado, Denver, CO, United States, 5Division of Vascular Surgery, Feinberg School of Medicine, Northwestern University, Chicago, IL, United States, 66. Department of Radiology, Mayo Clinic, Rochester, MN, United States
Synopsis
Systematic evaluation of complex flow in descending aortic dissection (DAD) is needed to better understand which patients are predisposed to complications. Our goal was to utilize quantitative maps from 4D flow MRI for monitoring true and false lumen (TL, FL) flow characteristics. 4D flow was acquired in 20 DAD patients (6 medically managed, 14 with surgical repair), and 21 age-matched controls. 4D flow-derived quantitative maps demonstrated global and regional hemodynamic differences between DAD patients and controls. DAD patients with and without repair showed significantly altered TL and FL aortic hemodynamics, indicating this technique’s potential to characterize flow dynamics in DAD.
INTRODUCTION
Aortic dissection is a life-threatening vascular disease that occurs when blood flows through entry tears in the intima of the native aorta, or true lumen (TL), generating a false lumen (FL). Descending aortic dissection (DAD) can be isolated (Stanford type-B) or associated with ascending aortic dissection (Stanford type-A). One of the main questions in chronic DAD is which patients should have thoracic endovascular aortic repair to prevent complications (1,2). We hypothesized that comprehensive evaluation of aortic hemodynamics will help to better understand the disease and classify patients. 4D flow MRI is uniquely poised to evaluate complex flow patterns in DAD. This technique has detected flow alterations in aortic dissection related to aortic dilatation (e.g., helical flow, FL velocity), found increased TL flow with FL thrombus, and been used to identify small dissection flap fenestrations (3-7). Previous studies are promising but were limited by either utilization of qualitative assessment or localized quantification of hemodynamics and thus systematic parameter mapping of flow in the TL and FL is needed. We have developed 4D flow MRI-derived parametric maps of aortic dissection hemodynamics (forward flow, reverse flow, flow stasis, and kinetic energy). Our goal was to analyze these parametric maps across different subtypes of chronic descending aorta dissection and compare to controls.METHODS
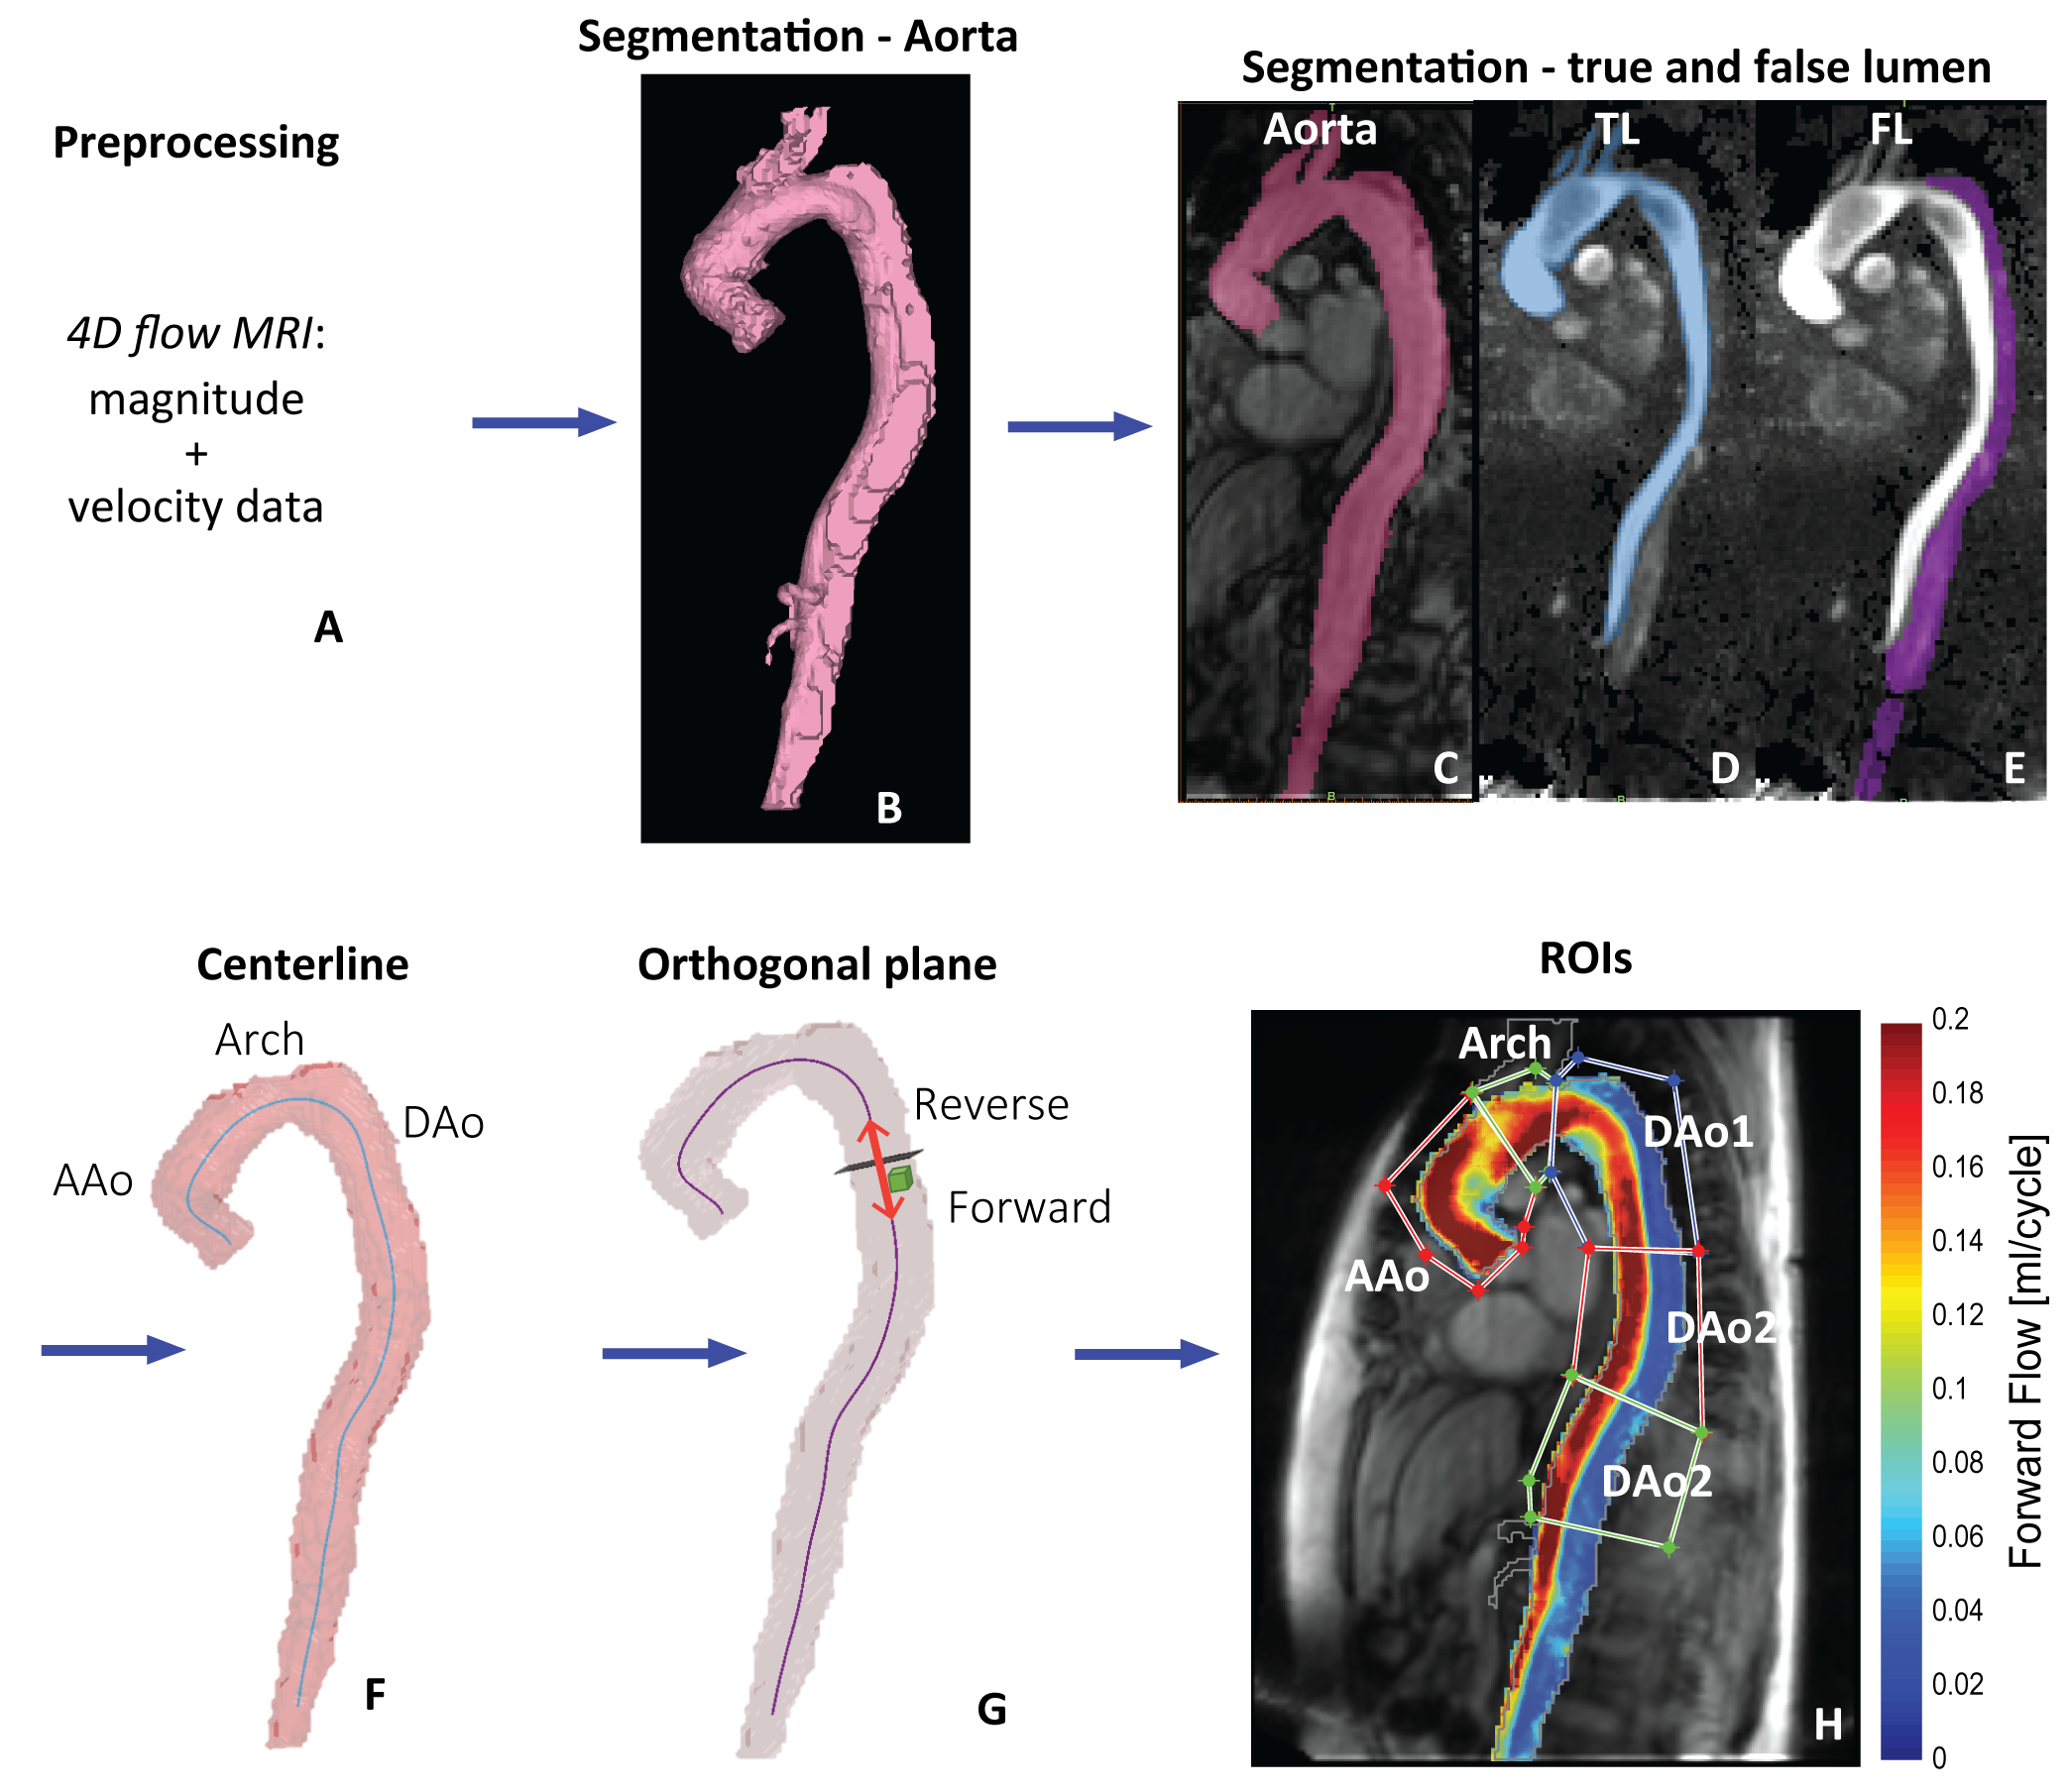
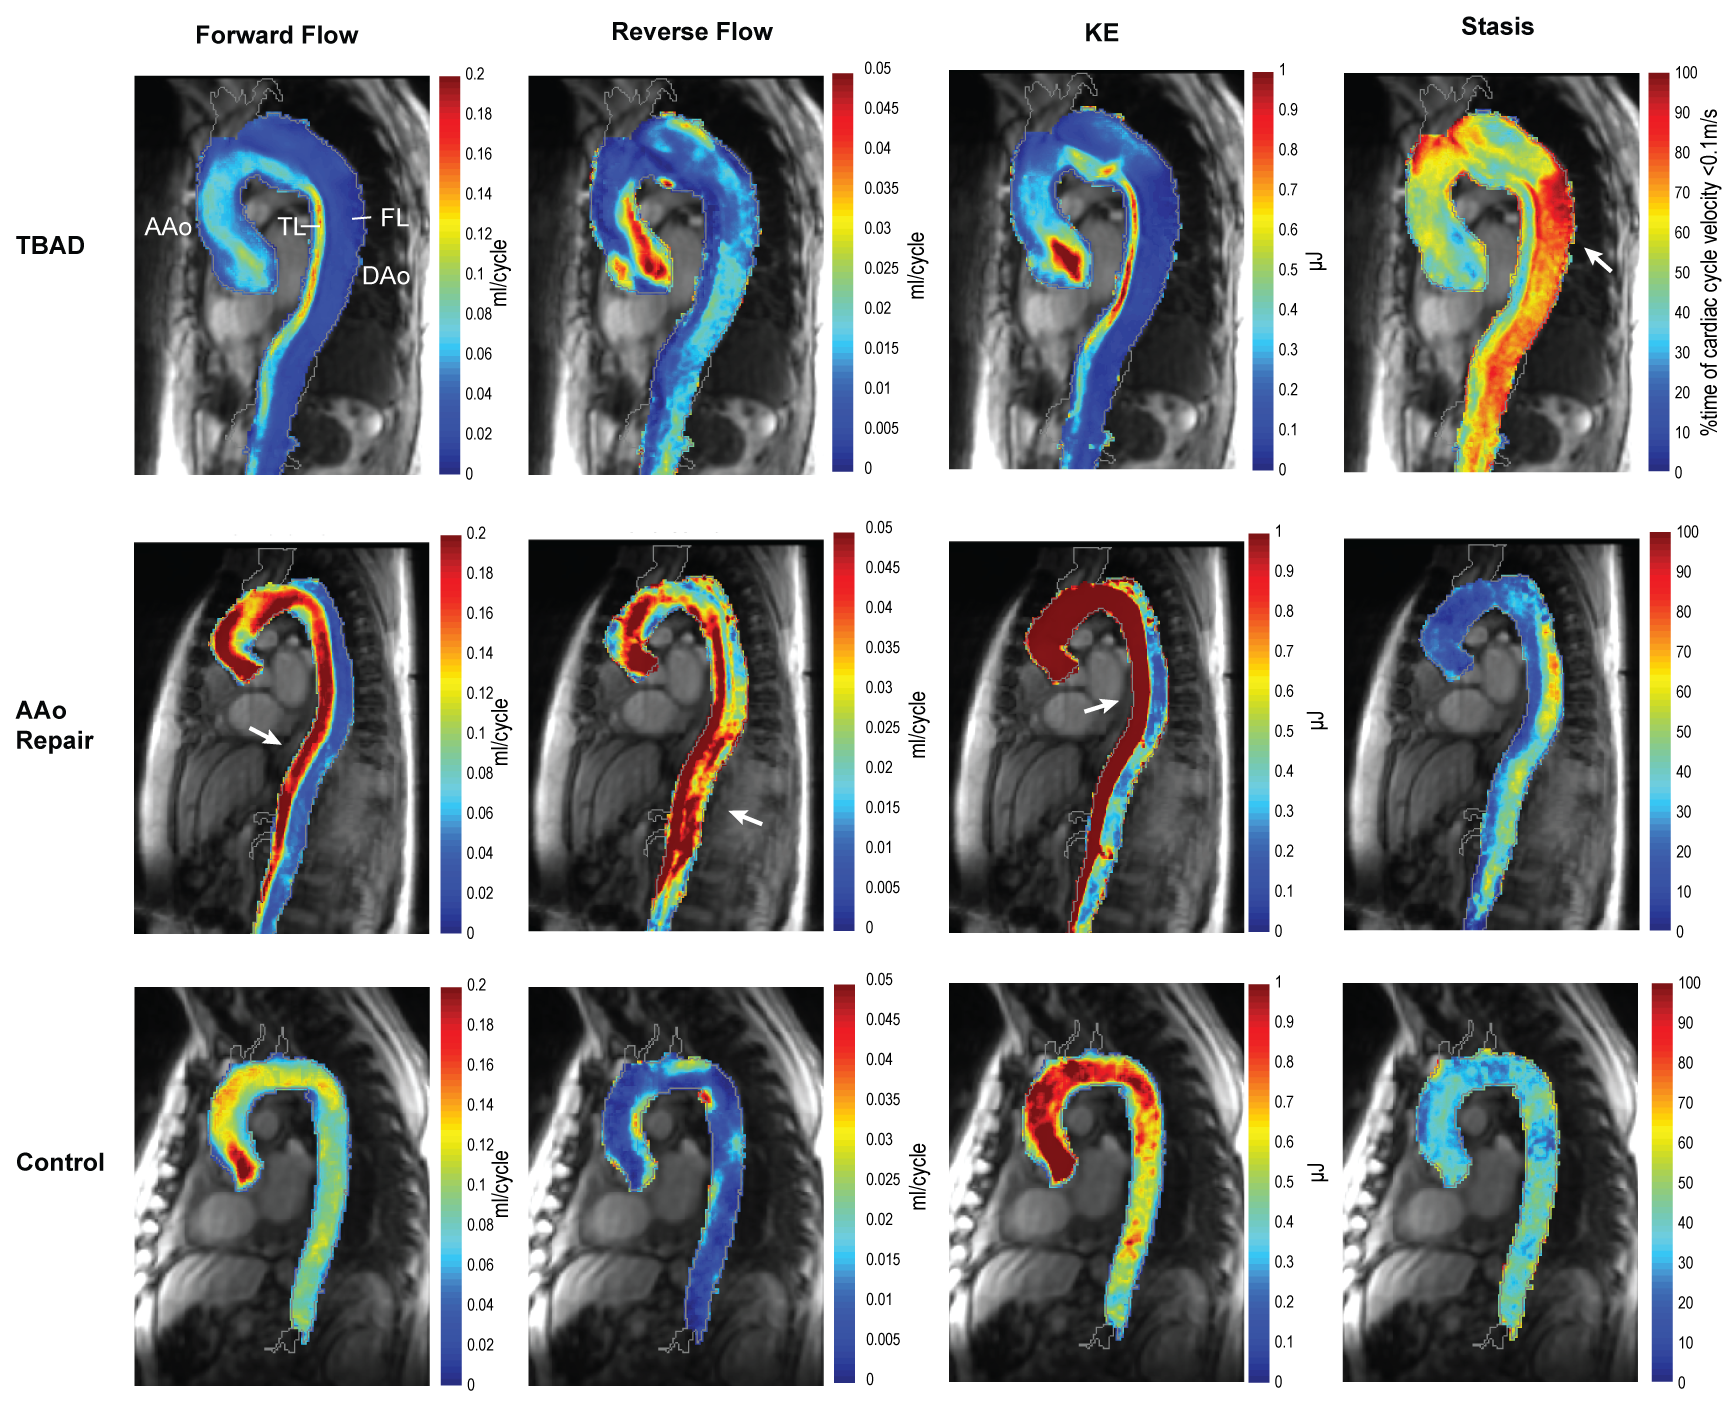
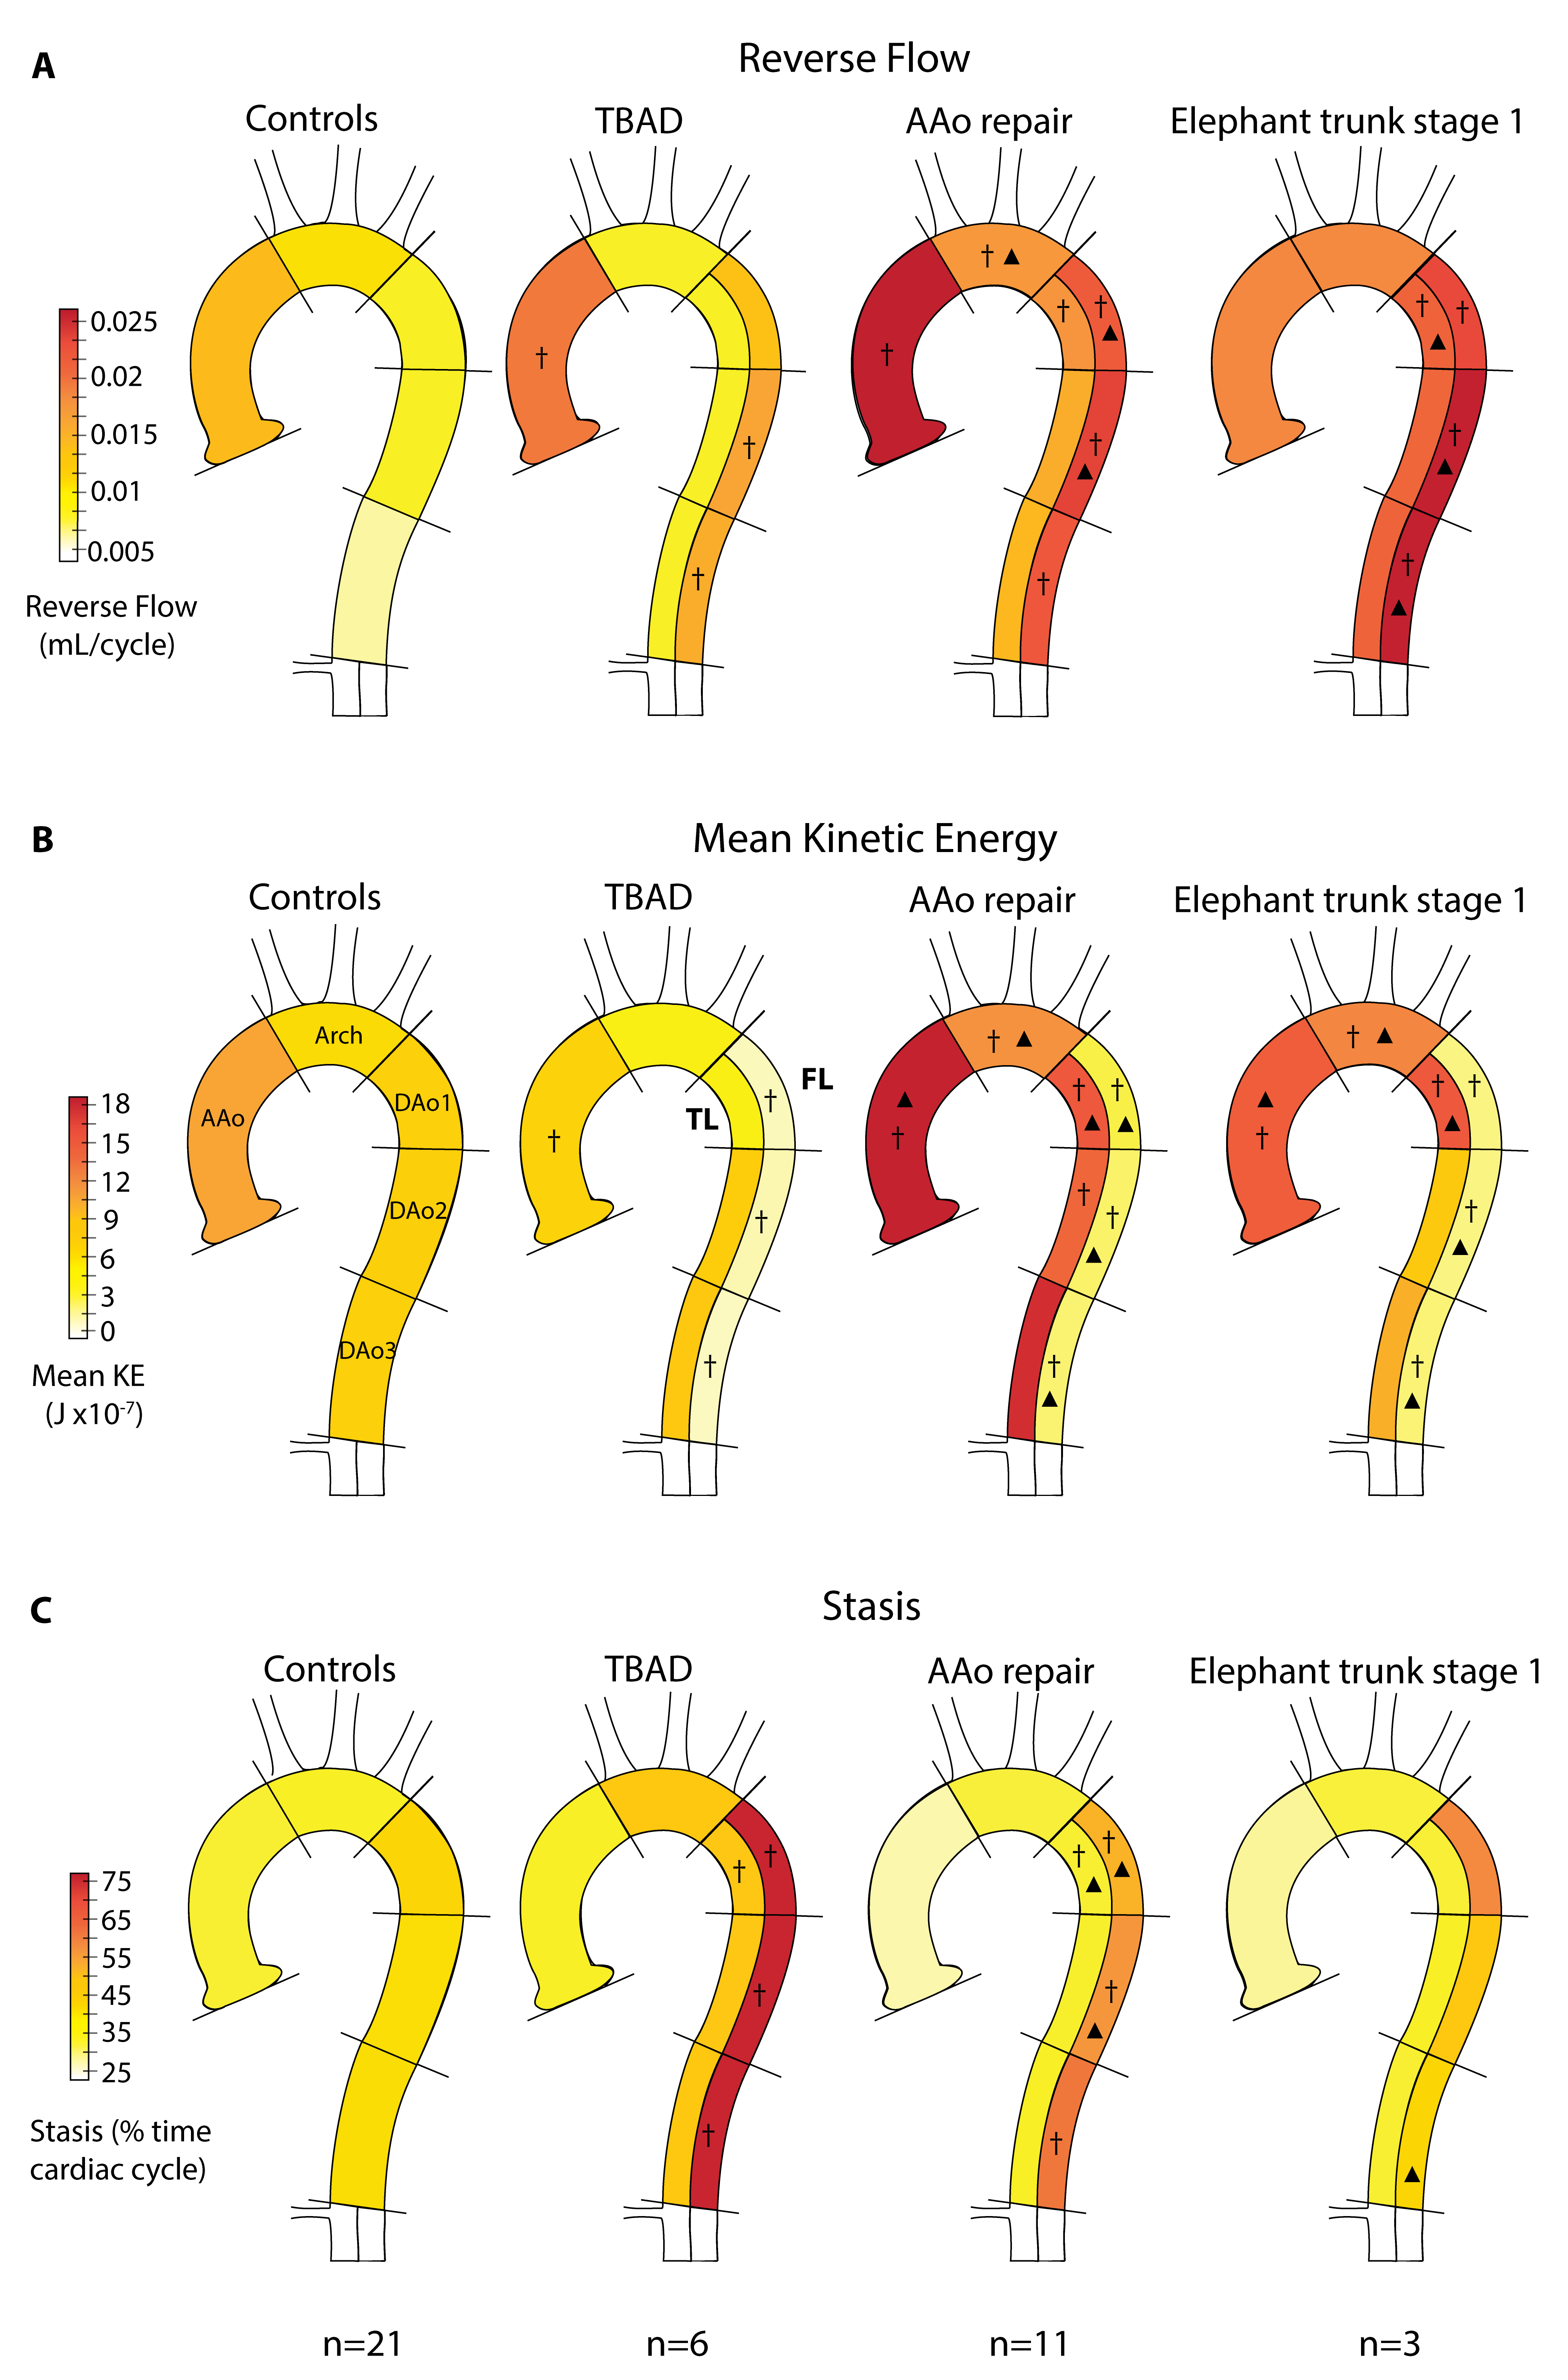
Free-breathing 4D flow MRI was acquired in 20 DAD patients (age=60±11 years; 12 male), including 6 medically managed type B (TBAD) and 14 repaired type-A (rTAAD) with ascending aortic (AAo) graft or elephant trunk (ET1) repair, and 21 age-matched controls (age=59±10 years; 13 male). Scan parameters were spatial resolution=2.7-5.0 x 2.0-3.1 x 2.2-5.0 mm3, temporal resolution=36.8-40.0 ms, and venc=150-270 cm/s (1.5T, 3T, Avanto, Aera, Skyra: Siemens Healthcare, Erlangen, Germany). The 4D flow data was preprocessed including calculation of time-averaged magnitude images and a time-averaged 3D phase contrast angiogram (PC-MRA). These data were used to segment the aorta (controls) and TL and FL (patients) (Figure 1a-e). Maps of aortic hemodynamics were derived based on home-built analysis tools similar to recently reported workflow (8,9). Briefly, 4D flow data were regridded to 1 mm3 voxels. A 3D aortic centerline was calculated to determine the direction of forward and reverse flow. Voxel-wise net forward flow (FF) and reverse flow (RF) were calculated as the sum over the cardiac cycle (Figure 1f-h). In addition, velocity magnitude was determined for each voxel at each cardiac time-frame, v(t), and voxel-wise flow stasis was calculated as the percentage of cardiac time-frames with v(t)<0.10 m/s. Also, voxel-wise kinetic energy (KE) was determined by KE=0.5*ρ*dV*v(t)2 with ρ=blood density (1060 kg/m3) and dV=unit voxel volume (1 mm3) (10) and summed over the cardiac cycle. 3D voxel-wise data for each parameter was collapsed into an average intensity projection and evaluated in 5 ROIs (Figure 1h).RESULTS
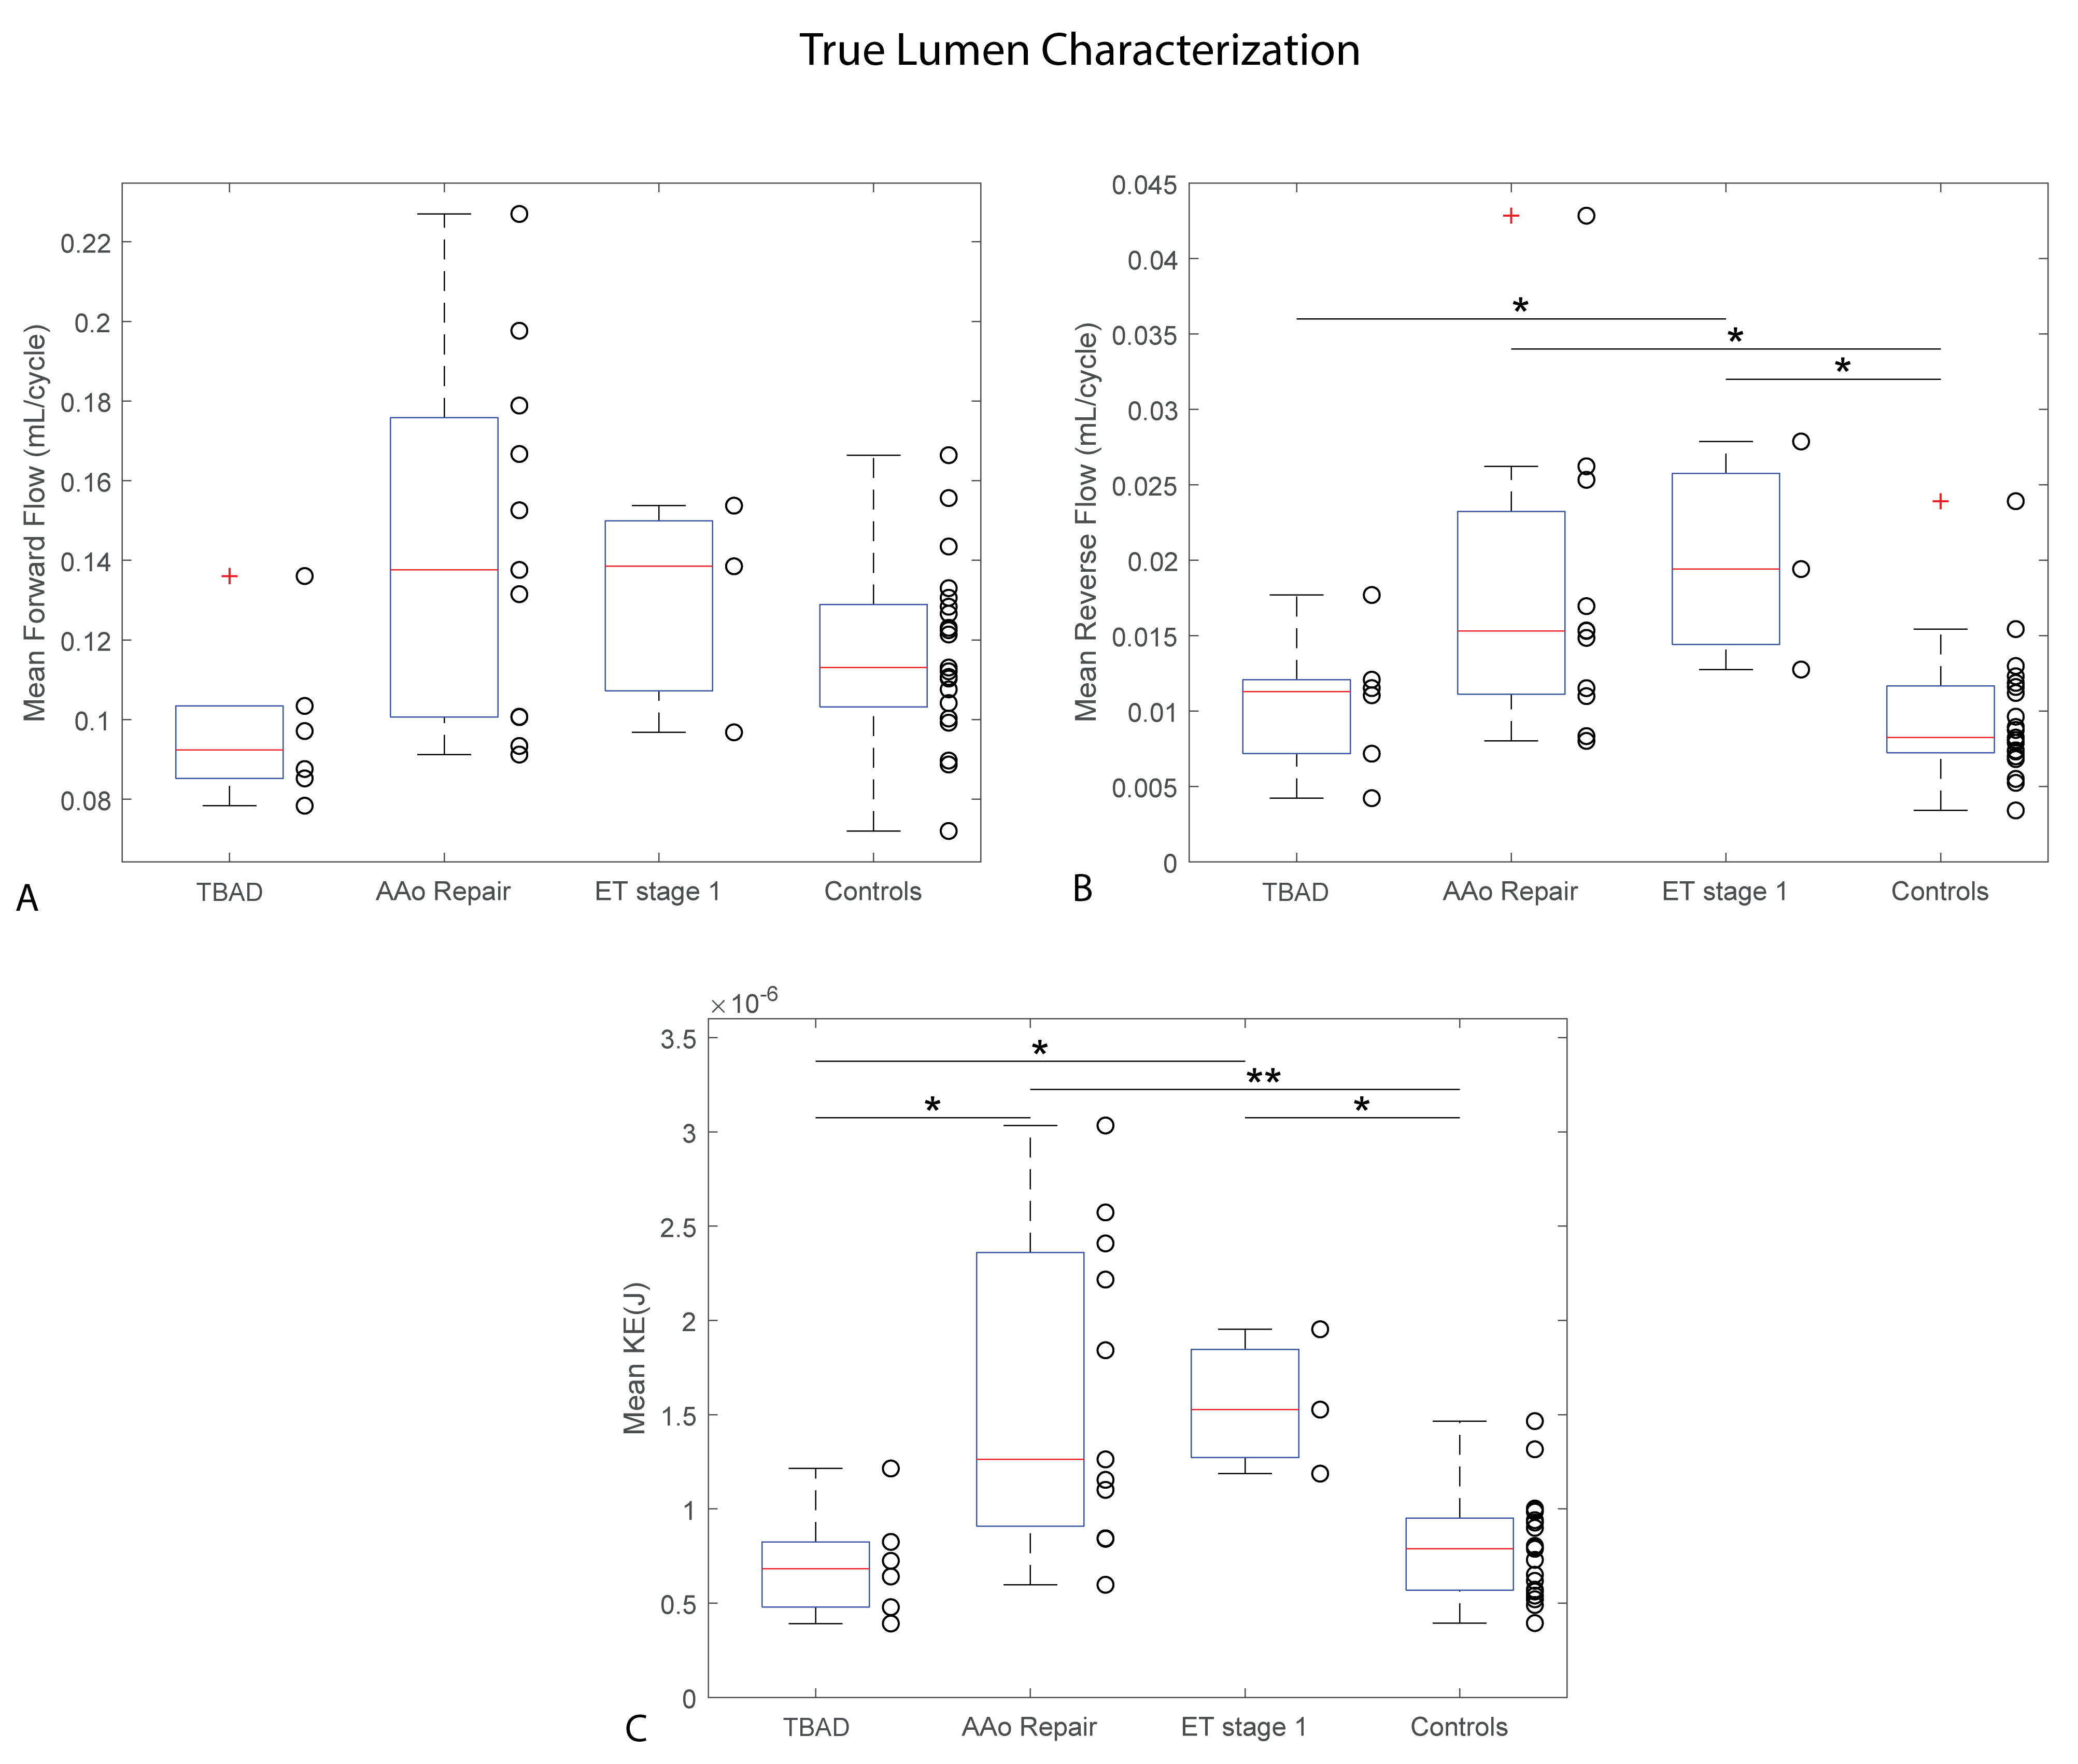
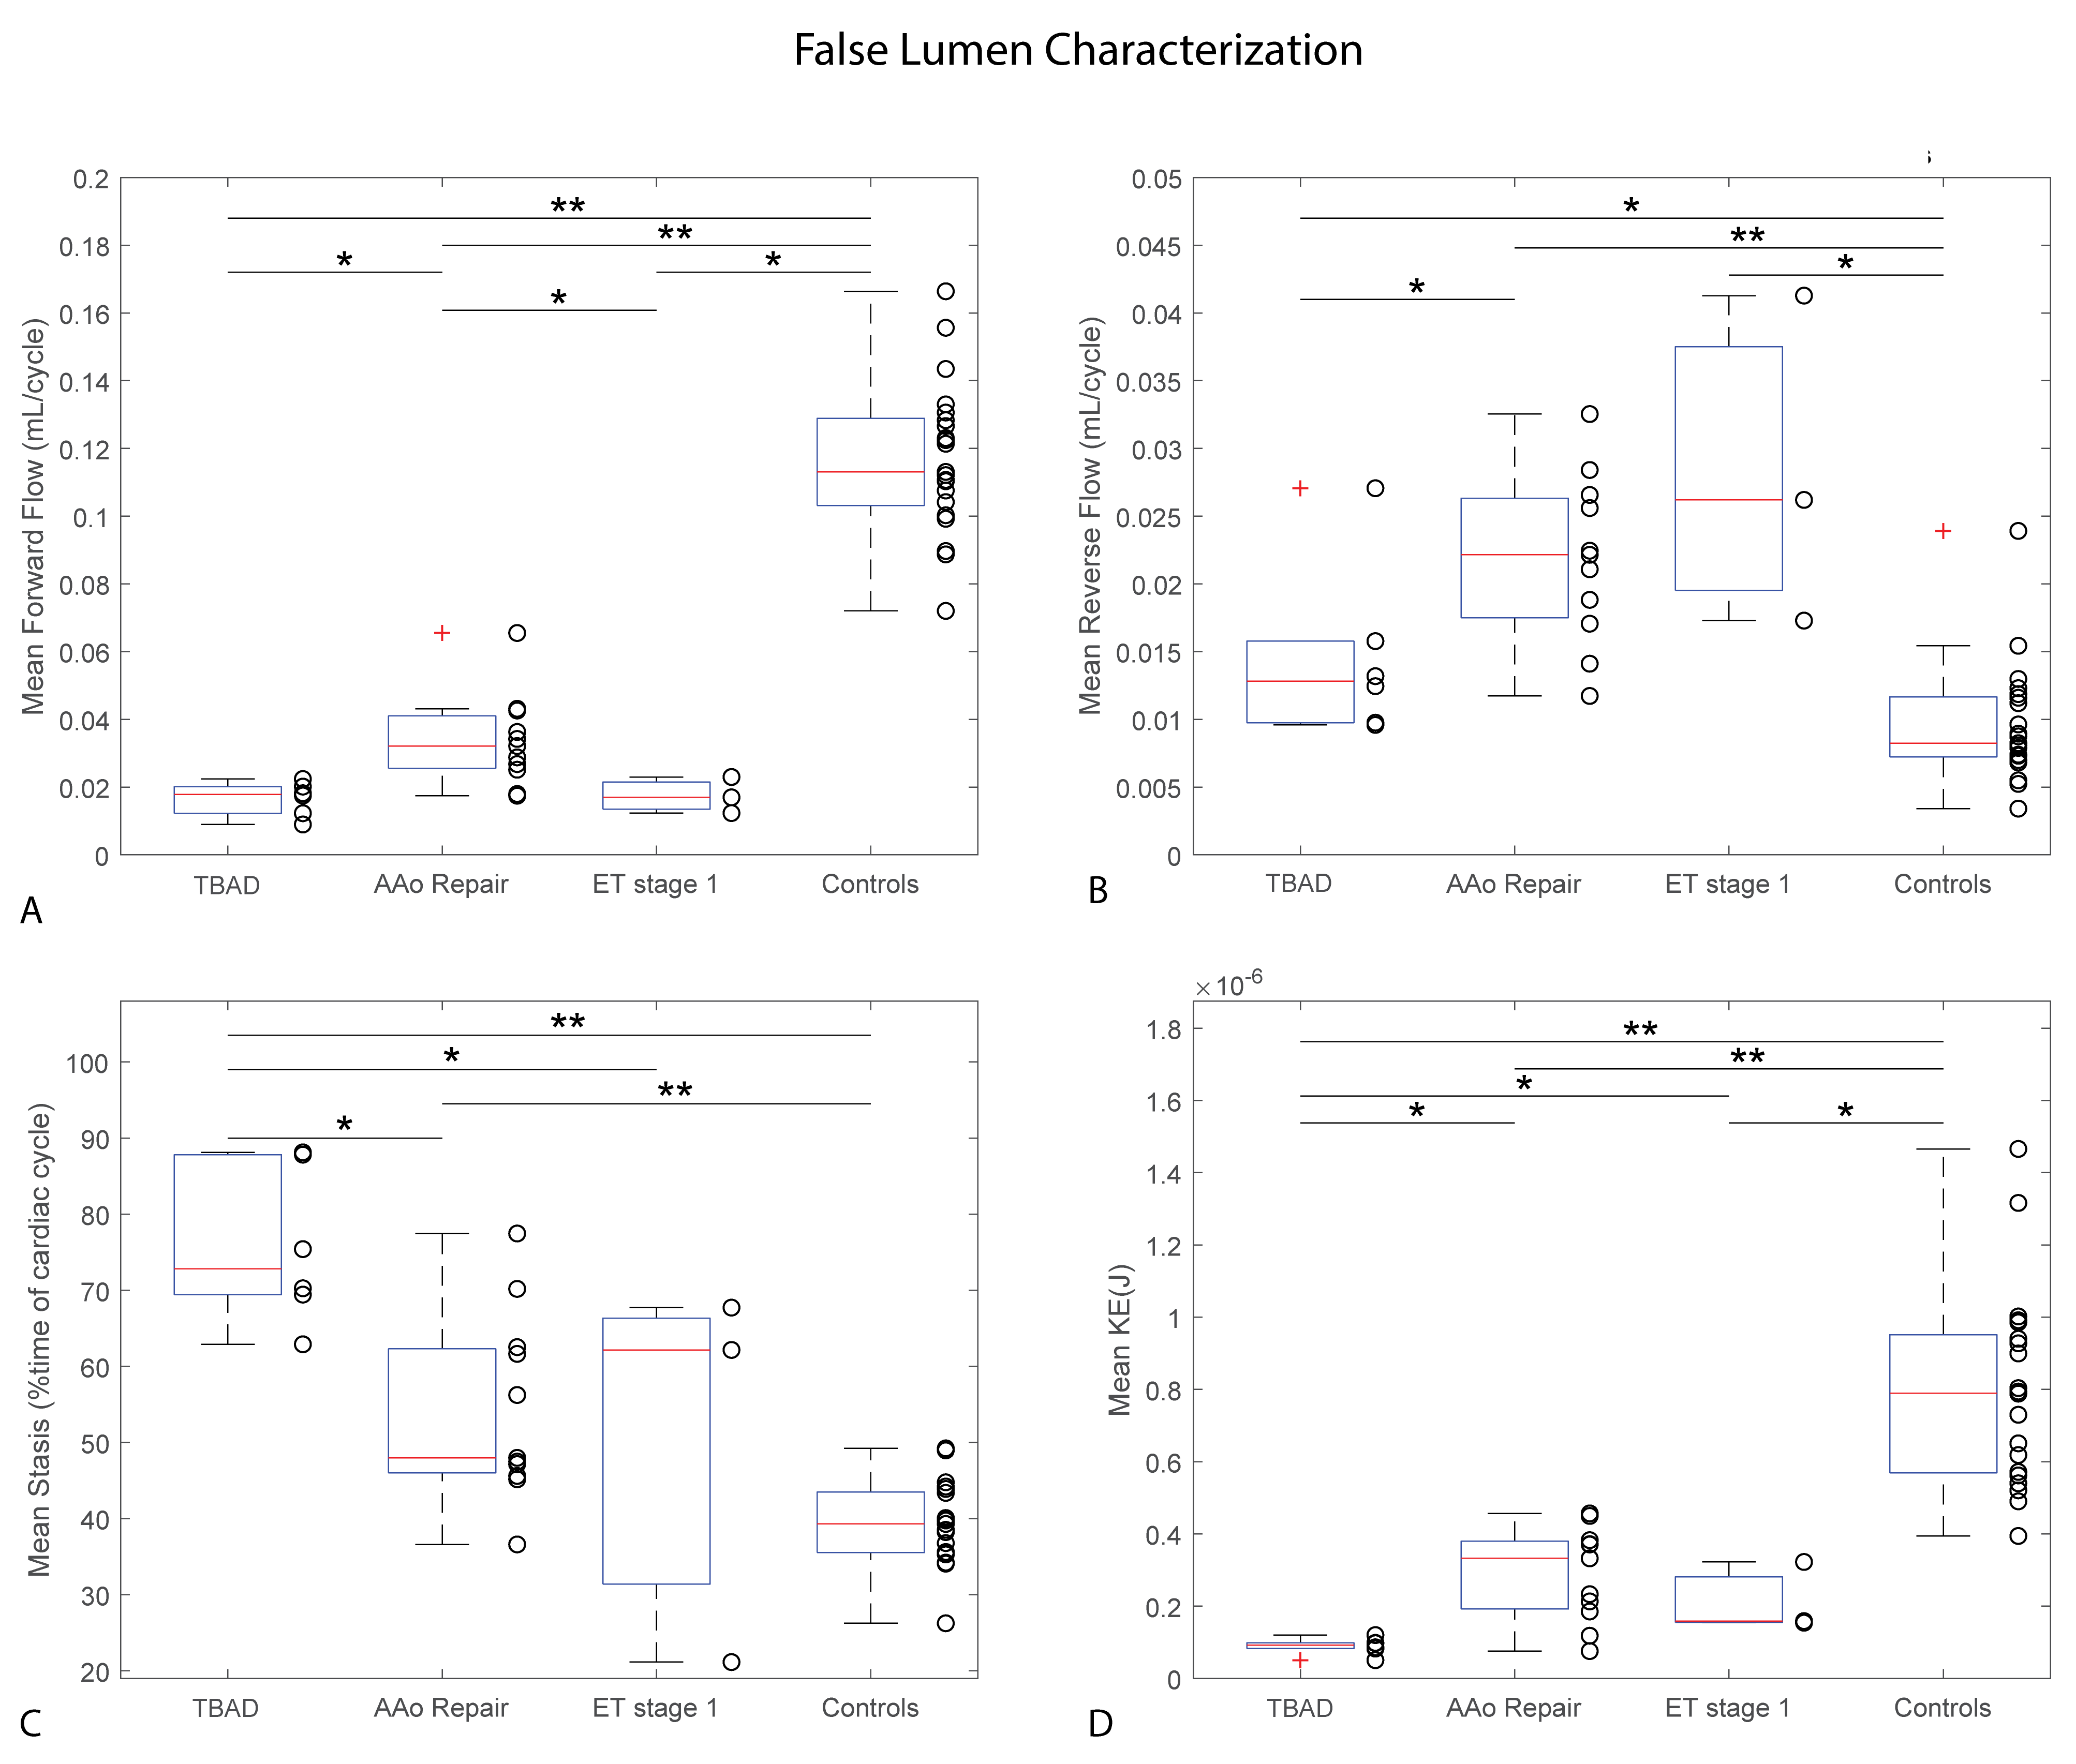
Patient characteristics were TBAD (n=6, age=62±8 [54-76] years, 33% male), rTAAD with AAo repair (n=11, age=60±13 [35-86] years, 64% male, time since last surgery=34±51 [4-156] months), and rTAAD with ET1 (n=3, 55±1 [54-56], 100% male, 7±6 [0.1-13] months). Results for example subjects are shown in Figure 2. Elevated voxel-wise forward flow (TL), reverse flow (TL, FL) and kinetic energy (TL) are shown in the patient with AAo repair, compared to the patient with TBAD and the control. Additionally, elevated levels of voxel-wise stasis are shown in the patient with TBAD, compared to the patient with AAo repair and the control. Overall, patients with rTAAD presented with elevated TL reverse flow (AAo repair: p=.004, ET1: p=.018) and increased TL kinetic energy (AAo repair: p=.0002, ET1: p=.011) compared to controls. In addition, TL kinetic energy was increased vs. patients with TBAD (AAo repair: p=.021, ET1: p=.048). (Figure 3, Figure 5). rTAAD was associated with higher FL kinetic energy and lower FL stasis compared to patients with TBAD (AAo repair: p=.002, ET1: p=.024 and AAo repair: p=.003, ET1: p=.048, respectively) (Figure 4, Figure 5).CONCLUSIONS
This study demonstrates the utility of hemodynamic mapping from 4D flow MRI as a quantitative technique for the characterization of chronic DAD showing differences between rTAAD and TBAD in descending aorta TL and FL flow patterns. These results indicate the potential for parametric mapping of underlying hemodynamics in the TL and FL (directional flow, flow stasis, kinetic energy) to play an important role in the understanding of aortic dissection. Future studies are warranted to determine key metrics related to outcome, help to plan invasive procedures and monitor asymptomatic patients over time.Acknowledgements
No acknowledgement found.References
Please see the full paper at: Jarvis K, Pruijssen JT, Son AY, et al. Parametric Hemodynamic 4D Flow MRI Maps for the Characterization of Chronic Thoracic Descending Aortic Dissection. J Magn Reson Imaging 2019.
1. Tran TP, Khoynezhad A. Current management of type B aortic dissection. Vascular health and risk management 2009;5(1):53-63.
2. Baliga RR, Nienaber CA, Bossone E, Oh JK, Isselbacher EM, Sechtem U, Fattori R, Raman SV, Eagle KA. The role of imaging in aortic dissection and related syndromes. JACC Cardiovasc Imaging 2014;7(4):406-424.
3. Clough RE, Waltham M, Giese D, Taylor PR, Schaeffter T. A new imaging method for assessment of aortic dissection using four-dimensional phase contrast magnetic resonance imaging. Journal of vascular surgery 2012;55(4):914-923.
4. Francois CJ, Markl M, Schiebler ML, Niespodzany E, Landgraf BR, Schlensak C, Frydrychowicz A. Four-dimensional, flow-sensitive magnetic resonance imaging of blood flow patterns in thoracic aortic dissections. J Thorac Cardiovasc Surg 2013;145(5):1359-1366.
5. Sherrah AG, Callaghan FM, Puranik R, Jeremy RW, Bannon PG, Vallely MP, Grieve SM. Multi-Velocity Encoding Four-Dimensional Flow Magnetic Resonance Imaging in the Assessment of Chronic Aortic Dissection. Aorta (Stamford, Conn) 2017;5(3):80-90.
6. Liu D, Fan Z, Li Y, Zhang N, Sun Z, An J, Stalder AF, Greiser A, Liu J. Quantitative Study of Abdominal Blood Flow Patterns in Patients with Aortic Dissection by 4-Dimensional Flow MRI. Scientific reports 2018;8(1):9111.
7. Allen BD, Aouad PJ, Burris NS, Rahsepar AA, Jarvis KB, François CJ, Barker AJ, Malaisrie SC, Carr JC, Collins JD, Markl M. Detection and Hemodynamic Evaluation of Flap Fenestrations in Type B Aortic Dissection with 4D Flow MRI: Comparison with Conventional MRI and CT Angiography. Radiology: Cardiothoracic Imaging 2019;1(1):e180009.
8. Shen X, Schnell S, Barker AJ, Suwa K, Tashakkor L, Jarvis K, Carr JC, Collins JD, Prabhakaran S, Markl M. Voxel-by-voxel 4D flow MRI-based assessment of regional reverse flow in the aorta. J Magn Reson Imaging 2018;47(5):1276-1286.
9. Vali A, Aristova M, Vakil P, Abdalla R, Prabhakaran S, Markl M, Ansari SA, Schnell S. Semi-automated analysis of 4D flow MRI to assess the hemodynamic impact of intracranial atherosclerotic disease. Magn Reson Med 2019;28(10):27747.
10. Cibis M, Bustamante M, Eriksson J, Carlhall CJ, Ebbers T. Creating hemodynamic atlases of cardiac 4D flow MRI. J Magn Reson Imaging 2017;46(5):1389-1399.
Figures