0001
Standardized Evaluation of Cerebral Arteriovenous Malformations using Flow Distribution Network Graphs and Dual-venc 4D Flow MRI1Radiology, Northwestern University, Chicago, IL, United States, 2Department of Neurosurgery, Northwestern University, Chicago, IL, United States, 3Department of Neurology, Northwestern University, Chicago, IL, United States, 4Ann & Robert H. Lurie Children’s Hospital of Chicago, Chicago, IL, United States, 5McCormick School of Engineering, Biomedical Engineering, Northwestern University, Chicago, IL, United States
Synopsis
Dual-venc 4D flow MRI with PEAK-GRAPPA acceleration provides time-resolved 3D cerebral hemodynamics and could be applied to cerebral arteriovenous malformations (AVM) with an appropriate standardized protocol. We optimize dual-venc 4D flow imaging for AVM in vitro and in vivo, and apply a Flow Distribution Network Graph paradigm for storing and analyzing complex neurovascular 4D flow data. In vitro and in vivo, 4 voxels across a typical vessel (achievable in vivo with 0.8mm isotropic resolution) will yield flow conservation < 15% and high reproducibility. Venous-arterial ratios of peak velocity and pulsatility index are proposed as potential network-based biomarkers characterizing AVM hemodynamics.
Introduction
Cerebral arteriovenous malformations (AVMs) are pathological connections between arteries and veins. Dual-venc 4D flow MRI, an extended 4D flow MRI method with improved velocity dynamic range, provides time-resolved 3D cerebral hemodynamics [2]; however, a standardized protocol appropriate for AVM quantification is lacking [3]. The goal of this work is to optimize dual-venc 4D flow parameters for AVM in vitro and in vivo, and to introduce and apply the Flow Distribution Network Graph (FDNG) paradigm for storing and analyzing complex neurovascular 4D flow data.Methods
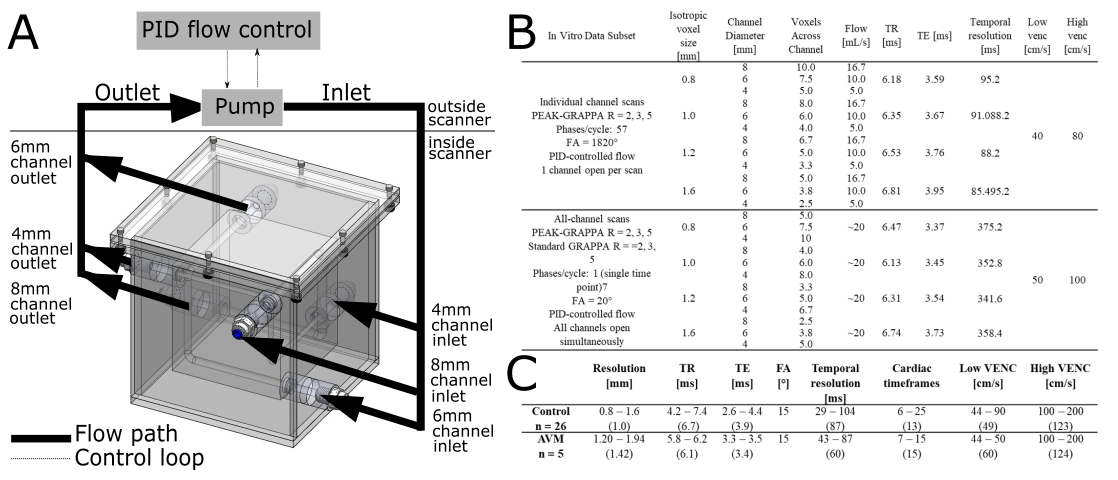
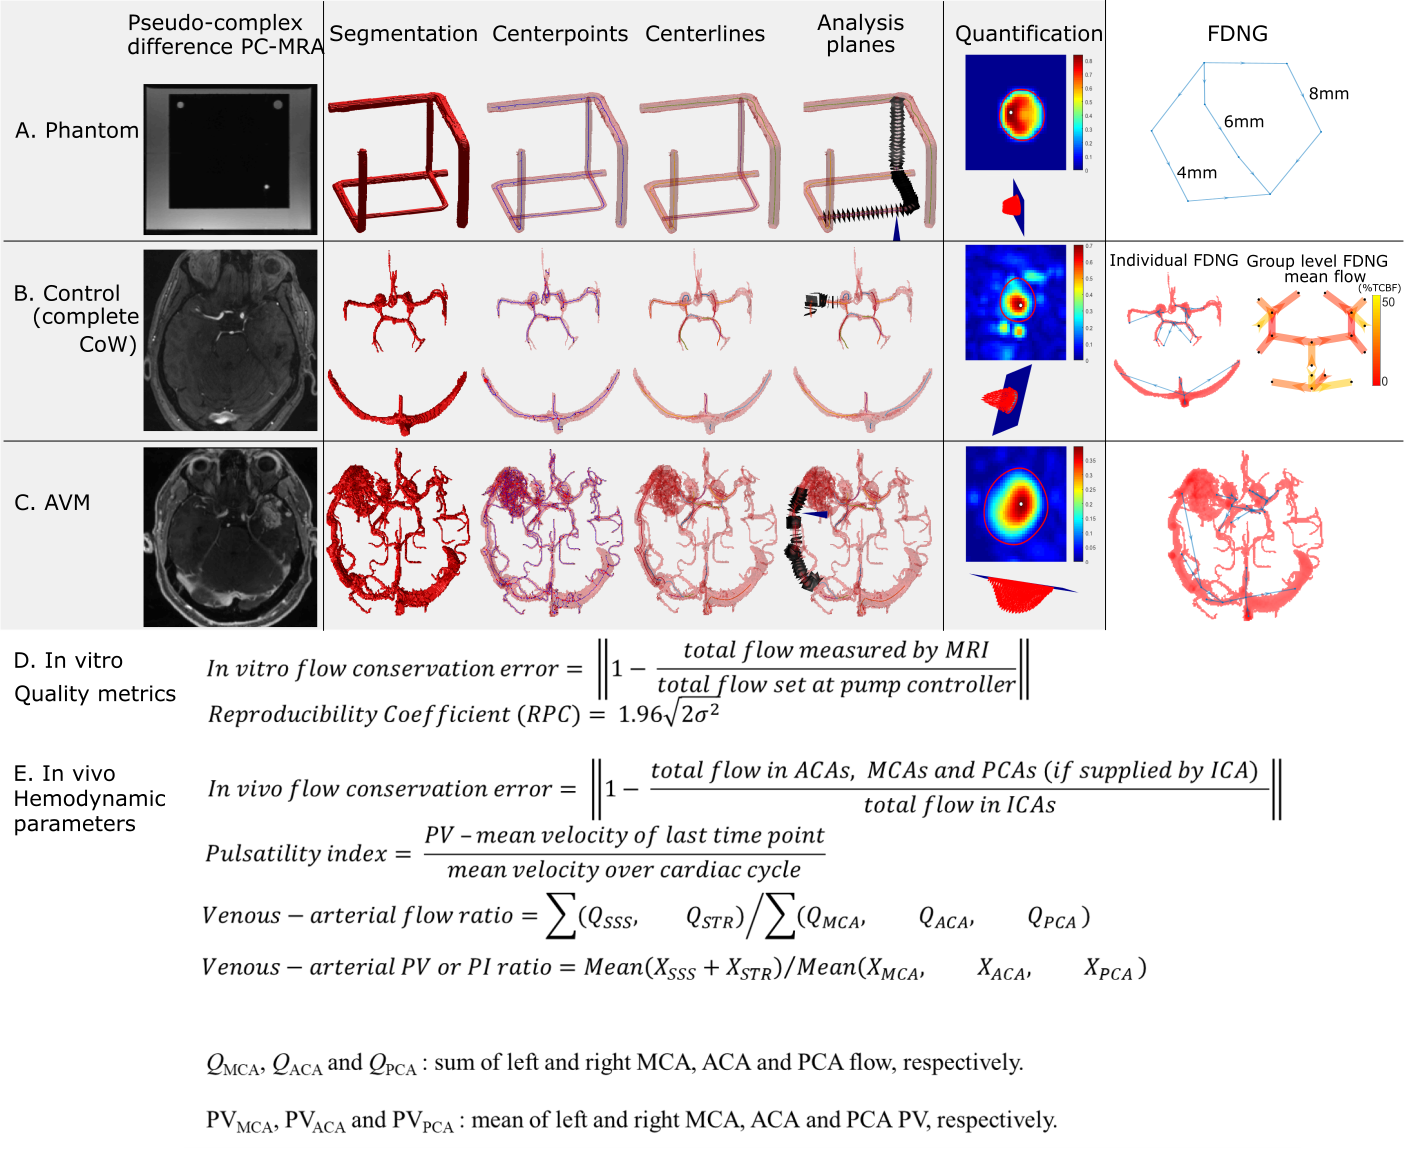
The relationship between spatial resolution, acceleration, and flow quantification accuracy was systematically assessed in a specialized MR-compatible phantom containing three flow channels. The phantom was integrated into a feedback-controlled steady flow circuit (Figure 1A). In vitro experiments were done with a single channel open (to assess flow quantification accuracy), all channels open in parallel (to assess flow conservation) and a reproducibility study of the 6mm channel. Acceleration factor and spatial resolution were systematically varied for each setup. Image quality and hemodynamics were assessed in a retrospective cohort study of 26 healthy subjects (age 41±17 years) and five AVM patients (age 27-68 years). All images were acquired at 3T (Figure 1B-C) and postprocessed as in Figure 2A-C [4].Quantification accuracy was assessed in vitro by direct comparison to measured flow (Figure 2D). In vivo, hemodynamics were assessed according to parameters derived from the FDNG (Figure 2E). For AVM patient data nidal (feeding or draining the AVM nidus) hemodynamics are distinguished from extranidal (vessels not connected to the nidus). For flow, peak velocity (PV) and pulsatility index (PI) [4], a venous-arterial ratio characterized differences between venous and arterial flow, caused by blood passing through either the small vessels of the brain or through an AVM.
In vitro measurements were compared to ground truth with Student t-test. In vivo groups were compared with Wilcoxon rank-sum test and Kruskal-Wallis test.
Results
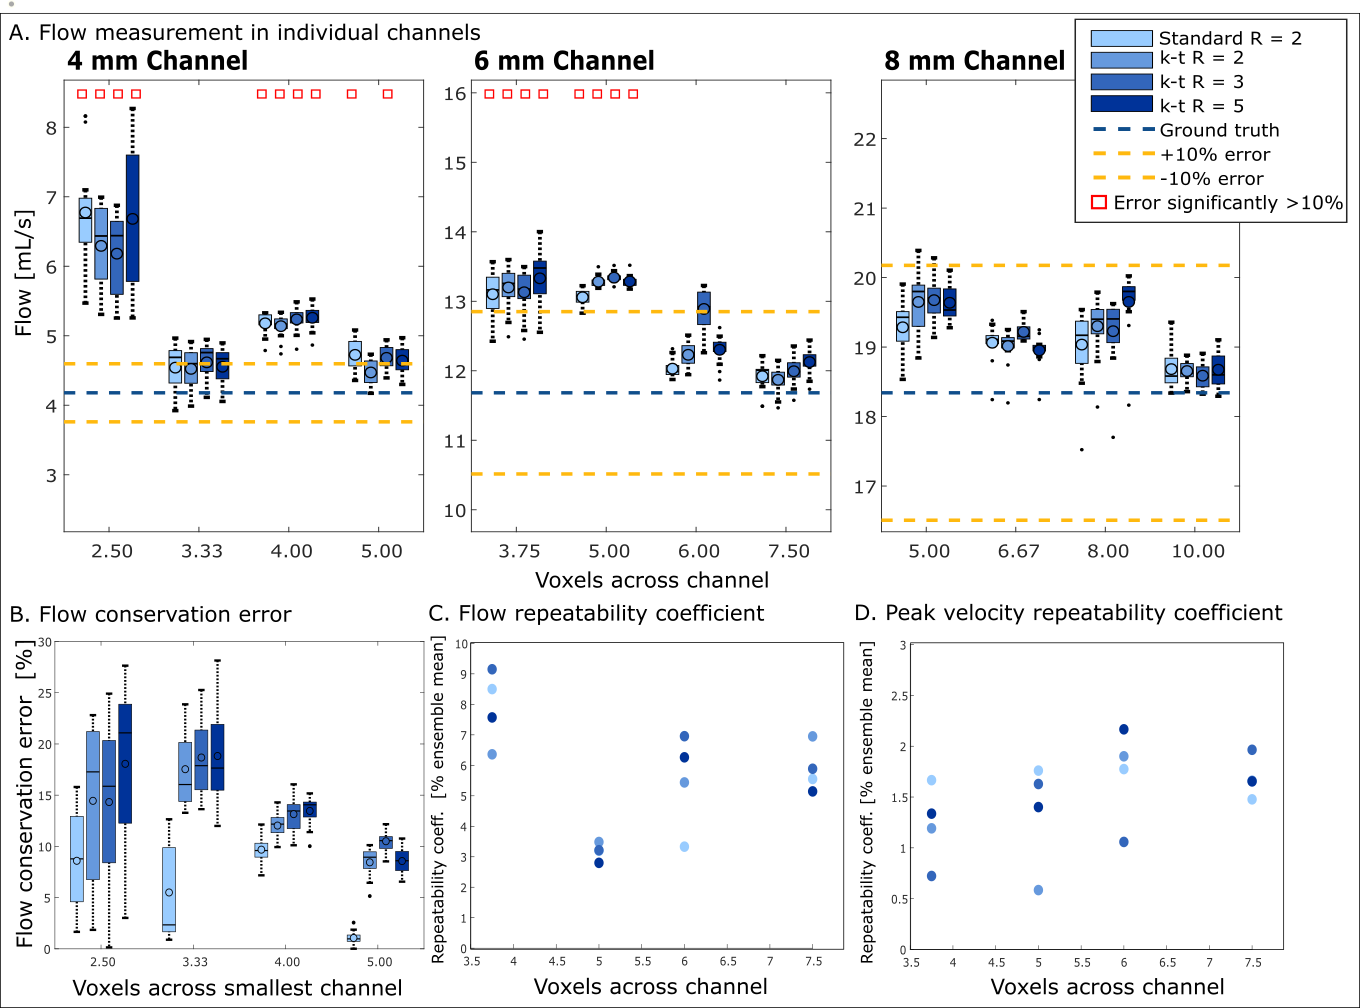
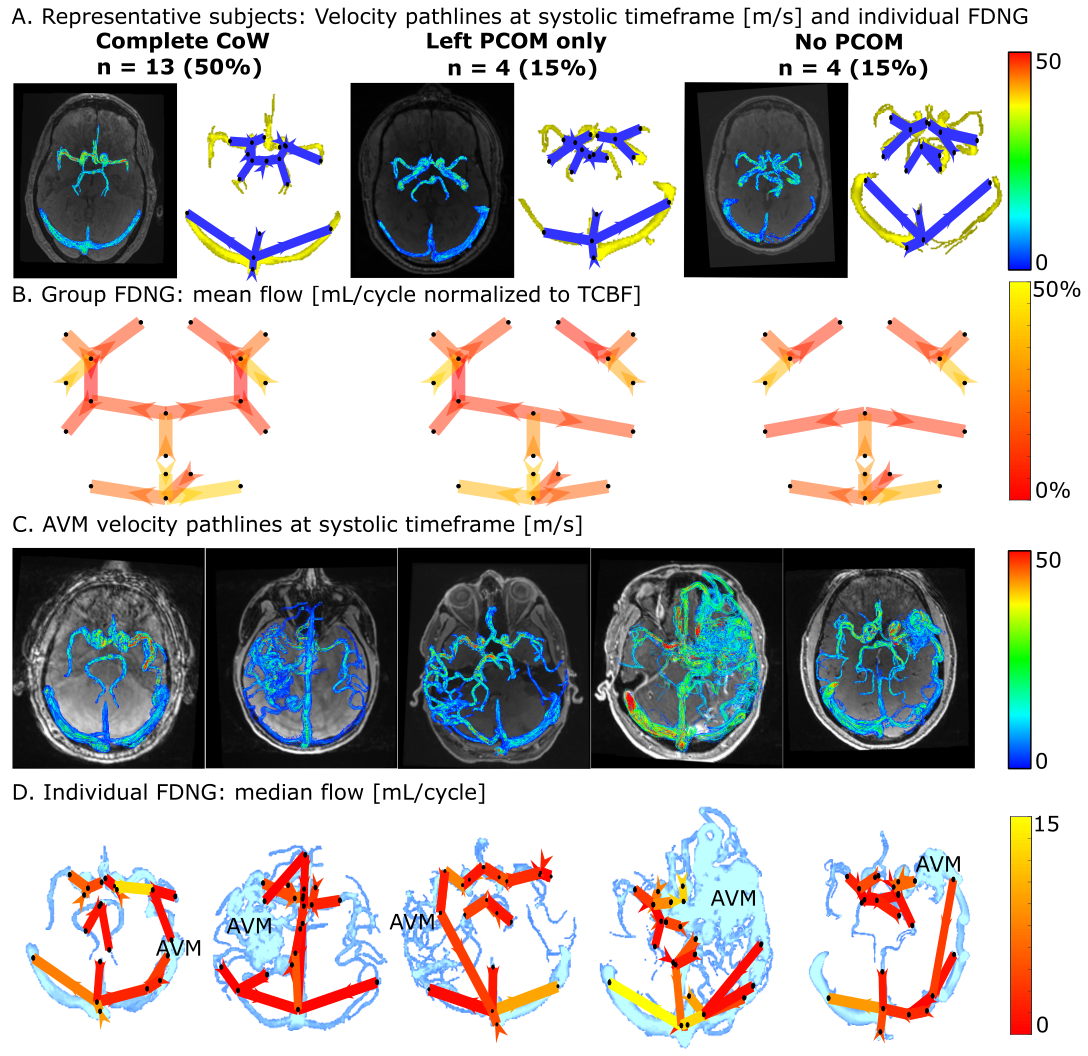
In vitro, flow was overestimated by an average 7.1±1.4% for all in vitro conditions (Figure 3A). Error in flow measurement was significantly correlated with number of voxels across the channel (P=3.11×10⁻²⁸) but not acceleration factor. Flow conservation error decreased 2.5% with unit increase in voxels across channel (P=0.0002) and increased (relative to GRAPPA R=2) with PEAK-GRAPPA R=2 (P=0.02), R=3 (P= 0.07), and R=5 (P=4.24×10⁻⁵). At R=5, flow conservation error was within 15% for 4 or 5 voxels across vessel. For both flow and PV, there was no significant association of reproducibility coefficient with acceleration factor or number of voxels across the channel.In vivo, individual FDNGs were constructed for all controls (Figure 4A) and AVM patients (Figure 4C-D). In controls, average flow conservation error was 20±14%, but 12% in subjects with a median 4 or more voxels across the vessel vs 25% in those with less than 4 (P=0.027). Three healthy variants predominated in the control cohort: those with the full Circle of Willis, left PCOM only, and no PCOM. Based on group FDNGs, increased left transverse sinus (LTS) flow (P=0.045) and significantly decreased right transverse sinus (RTS) flow (P=0.027) were observed in the left-PCOM group compared to both-PCOM, with right sinus predominance unlike both-PCOM and no-PCOM groups (Figure 4B).
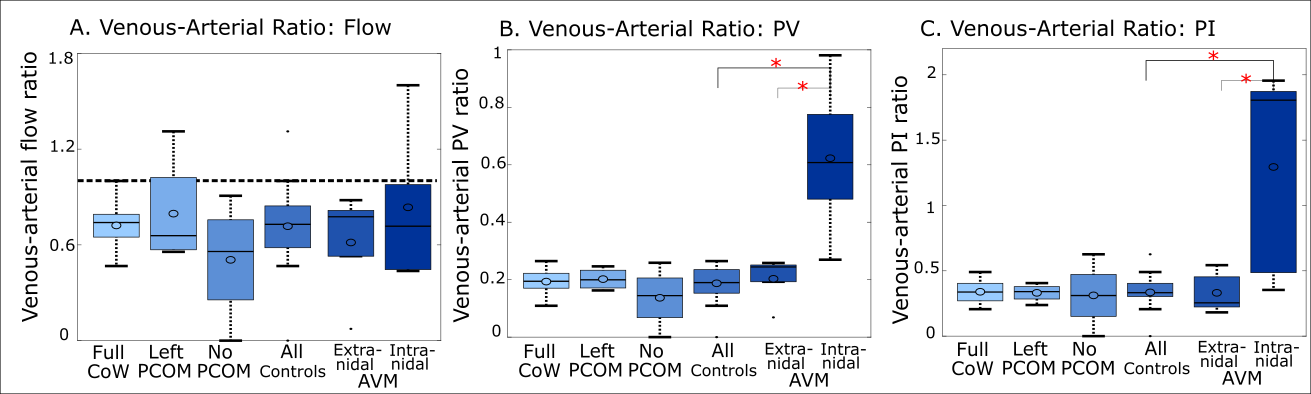
As expected, no significant difference was observed between controls and intranidal or extranidal AVM circulation in venous-arterial flow ratio, another flow conservation measure. For the venous-arterial PV and PI ratios (Figure 5B-C), a significant difference was found between AVM nidal and extranidal circulation (P=0.008 and 0.05 respectively), and between AVM nidal and healthy control circulation (P=0.005 and 0.003 respectively), but not between controls and the extranidal circulation of AVM patients (P=0.32 and 0.65 respectively). For venous-arterial PV and PI ratios, a significant difference was found between AVM nidal and extranidal circulation (P=0.008 and 0.05 respectively), and between AVM nidal and healthy control circulation (P=0.005 and 0.003 respectively).
Conclusions
Based on in vitro results, at least 5 voxels across a vessel should be used for flow quantification within 10-15%. However, 4 voxels across a typical vessel (achievable in vivo with 0.8mm isotropic resolution) will yield flow conservation < 15% and high reproducibility of flow and PV. Dual-venc 4D flow MRI and standardized FDNG analysis may be feasible for efficient and standardized evaluation of the brain vessels in clinical applications. Venous-arterial PI ratio, which is the inverse of the damping factor proposed by Gosling [5], intuitively characterizes a lack of damping by the AVM nidus relative to normal vasculature. Venous-arterial ratios of PV and PI are proposed for further investigation as network-based biomarkers characterizing AVM nidal hemodynamics.Acknowledgements
The authors gratefully acknowledge support from the following grants:
NIH F30 HL140910 (Aristova)
AHA 16SDG30420005 (Schnell)
NIH R01 HL117888 (Markl)
AHA 18POST33990451 (Vali)
NIH T32 GM815229 (Northwestern)
NIH R21NS106696 (Schnell)
References
- Schnell S, Ansari SA, Wu C, et al. Accelerated dual-venc 4D flow MRI for neurovascular applications. J Magn Reson Imaging 2017;46(1):102-114.
- Wu C, Ansari SA, Honarmand AR, et al. Evaluation of 4D Vascular Flow and Tissue Perfusion in Cerebral Arteriovenous Malformations: Influence of Spetzler-Martin Grade, Clinical Presentation, and AVM Risk Factors. Am J Neuroradiol 2015;36(6):1142-1149.
- Vali A, Aristova M, Vakil P, et al. Semi‐automated analysis of 4D flow MRI to assess the hemodynamic impact of intracranial atherosclerotic disease. Magn Reson Med 2019 doi: https://doi-org.ezproxy.galter.northwestern.edu/10.1002/mrm.27747.
- Shakur SF, Amin‐Hanjani S, Mostafa H, Aletich VA, Charbel FT, Alaraj A. Relationship of pulsatility and resistance indices to cerebral arteriovenous malformation angioarchitectural features and hemorrhage. J Clin Neurosci 2016; 33: 119– 123.
- Gosling RG, King DH. Arterial Assessment by Doppler-shift Ultrasound. Proc R Soc Med 1974;67(6 Pt 1):447-449.
Figures