Temperature Measurement
1Department of Human and Information Science, School of Into Science and Technology, Tokai University, Hiratsuka, Japan
Synopsis
Noninvasive thermometry is one of the unique features of MRI compared with the other imaging modalities. In this lecture, the basic principles, as well as the latest techniques of MR thermometry such as acquisition acceleration, motion and field change compensation, fat and bone thermometry are explained.
TARGET AUDIENCE
-Researchers who wish to understand the principle, methodology, and techniques of MR thermometry
-Clinicians who want to know how to use such techniques properly.
OBJECTIVES
-Understand what noninvasive temperature measurement is required for
-Describe basic concepts of MR thermometry including temperature dependence of MR parameters
-Understand how temperature measurement and mapping can be made
-Understand which technique(s) is suitable or unsuitable for various applications
INTRODUCTION
Noninvasive thermometry is the key to secure the effect and safety of thermal therapies. Among several modalities, MRI has been the only practical tool for clinical use. In conjunction with the emerging technologies of HIFU, MR thermometry is becoming one of the most promising ways for treatment guidance. Besides, absolute temperature measurement is another attractive technology for investigating heat transfer mechanisms in physiological state.TEMPERATURE DEPENDENCE OF MR PARAMETERS
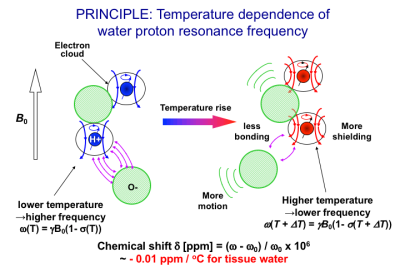
Most of proton MR parameters are temperature dependent. These include the proton resonance frequency (PRF) or chemical shift of water(1) discussed in detail here; T1 (2-5), T2 (3,6,7), M0 (8,9) and D (10,11). Among these parameters, the PRF shift is determined independently from the other parameters which are determined by signal intensities. The PRF of the hydroxyl groups depends linearly on temperature as it is associated with hydrogen bonds between the protons in hydroxyl groups and other more electronegative atoms (12). A schematic diagram of this shielding effect for the protons in the hydroxyl group under temperature change in relation to chemical shift is depicted in Fig. 1(13). At low temperature, the electronic motion is limited by the electrostatic force associated with the hydrogen bond, which weakens the shielding effect of the electron cloud, resulting in a higher resonance frequency. Since the proton exchange between the broken and unbroken bonds is rapid compared to the time-scale of the observation, the apparent MR frequency is an average that reflects all possible configurations of the proton system (1). When the system is warmed, motion intensifies, resulting in the distortion, extension, and/or breaking of the hydrogen bonds between molecules. Thus, at higher temperatures the electronic shielding is less constrained by bonding than at lower temperatures, so the shielding effect is strengthened and the resonance frequency decreases. The change of the frequency in pure water is -0.0108 ppm/oC over the temperature range 0–50oC, and -0.00091 ppm/oC over a temperature range of 50–100oC,(1) reflecting a slight change in temperature coefficient above 50oC. The coefficient in tissues with high water content is around -0.01 ppm/ oC (14).PRF SHIFT THERMOMETRY FOR TISSUES WITH HIGH WATER CONTENTS
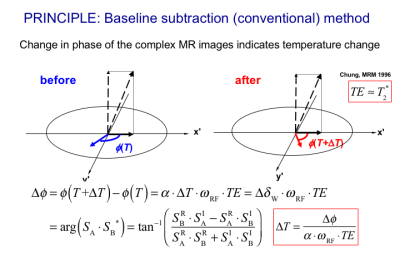
The most widely accepted temperature imaging technique using PRF shift is to use a phase change in gradient echo signals as shown in Fig. 2 (15,16). The phase mapping method requires appropriate provisions to compensate for magnetic field changes (17), tissue susceptibility changes (18), and physiological motion (19-21) because it depends on a relative change in phase determined by voxel-by-voxel subtraction. It should also be noted that a difference in the temperature-induced susceptibility change between fat and aqueous tissues leads to significant temperature error (22). Moreover, any non-water signal component, such as fat, needs to be suppressed in order to avoid erroneous phase calculation (23,24). Since several articles thoroughly cover the history and principles of MR thermometry techniques (13,16,25), new perspectives (26) will be highlighted here.FRAME RATE REQUIREMENT AND ACCELERATION
Although a frame rate required for thermometry varies widely according to the target organs, malignancy and treatment protocol, a rate of 2 images/s will be sufficient for most applications(26). Conventional data acquisition schemes such as SPGR, EPI, or spiral imaging fulfill this frame rate requirement. The maximum phase-difference-to-noise ratio is obtained when TE is equal to T2*. Parallel imaging can be combined with those scanning schemes as far as the optimal acoustic window of a HIFU device is not blocked by the coil configuration. Sparse sampling or compressed sensing may also be applied to accelerate signal acquisition (27,28).MOTION AND FIELD CHANGE COMPENSATION
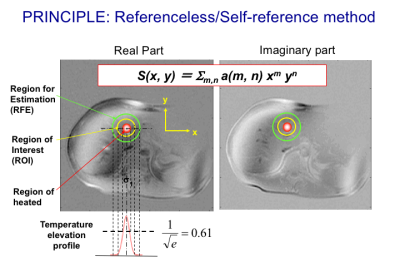
As baseline subtraction used in the conventional PRF shift methods is highly sensitive to motion between scans through spatial misregistration and bulk main field changes, a navigator-echo-based technique in conjunction with multiple baseline images was proposed (19) (29). Since the multiple baseline technique is not sufficient for non-rigid motions, an alternative technique named referenceless techniques, also called self-reference or reference-free techniques (20,30,31), which determines the pretreatment phase in a heated region based on the phase or complex signal distribution surrounding the target region using a polynomial fitting as depicted in Fig. 3. The polynomial coefficients are estimated basically by minimizing the L2-norm of the estimation error (20,30,31). In order to eliminate the need for prior knowledge about the focal spot location, a technique using the L1-norm was also developed (32). A hybrid method combining the referenceless and multi-baseline techniques was also proposed for better performance with smaller baseline library or lower polynomial orders (33).FAT THERMOMETRY
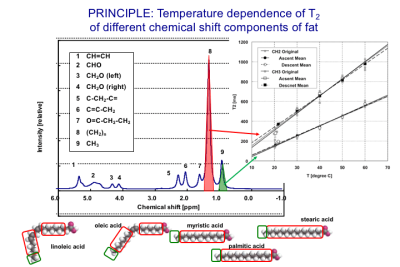
Temperature of non-aqueous tissues like fat cannot be measured with PRF shift because of the absence of hydrogen bonding (13). Therefore, for voxels with high fat content, the temperature of fat itself should be measured. A three-point Dixon method to independently map the temperature distributions using PRF for aqueous tissue and T1 for adipose tissue (34) has been proposed. It should be noted that the T1 and T2 of the different chemical shift components of fat have different temperature coefficients (35) as demonstrated in Fig. 4. The feasibility of using T2 for fat thermometry was also demonstrated by a few groups. (36).BONE THERMOMETRY
The other progress in thermometry is cortical bone thermometry for monitoring HIFU treatment of bone metastasis (37,38). Using 3D radial acquisition with ultrashort echo time (UTE) and variable flip-angle T1 mapping, the T1-based thermometry has become feasible(39).SUMMARY
Noninvasive temperature imaging is one of the unique features of MRI compared with the other medical imaging modalities. The above-mentioned techniques are being translated into clinical practice. Techniques of absolute temperature imaging and temperature difference imaging with ±0.1oC precision are required to seize physiological or metabolic change of tissues including the brain.Acknowledgements
No acknowledgement found.References
1. Hindman JC. J Chem Phys 1966; 44:4582.
2.Lewa CzJ, Baczkowski A. Bull Cancer 1977;64:37.
3. Bottomley PA, Foster TH, Argersinger RE, Pfeifer LM. Med Phys 1984;11:425.
4. Parker DL. IEEE Trans Biomed Eng 1984;BME-31:161.
5. Dickinson RJ, Hall AS, Hind AJ, Young IR. J Compt Assist Tomogr 1986;10:468.
6. Nelson TR, Tung SM. Magn Reson Imag 1987;5:189.
7. Kuroda K, Tsutsumi S, Saito A. Trans IEICE 1990;J73-A(8):1431.
8. Kamimura Y. Nagoya University, PhD Thesis 1985.
9. Chen J, Daniel B, Pauly KB. J Magn Reson Imaging 2006;23(3):430-434.
10. Hall AS, Prior MV, Hand JW, Young IR, Dickinson RJ. J Compt Assist Tomogr 1990;14:430.
11. Le Bihan D, Delannoy J, Levin RL. Radiology 1989;171:853.
12. Muller N, Reiter R. J Chem Phys 1965;42(9):3265-3269.
13. Kuroda K. Int J Hyperthermia 2005;21(6):547-560.
14. Kuroda K. In: Bottomley P, Griffiths J, editors. Handbook of Magnetic Resonance Spectroscopy In Vivo: MRS Theory, Practice and Applications (eMagRes Books). Hoboken, NJ, USA: John Wiley & Sons, Inc.; 2016.
15. Ishihara Y, Calderon A, Watanabe H, Okamoto K, Suzuki Y, Kuroda K, Suzuki Y. Magn Reson Med 1995;34:814-823.
16. Rieke V, Butts Pauly KB. J Magn Reson Imaging 2008;27(2):376-390.
17. Poorter JDe, Wagter Cde, Deene De, Thomsen C, Stahlberg F, Achten E. Magn Reson Med 1995;33:74-81.
18. Poorter J. Magn Reson Med 1995;34:359-367.
19. Vigen KK, Daniel BL, Pauly JM, Pauly KB. Magn Reson Med 2003;50:1003-1010.
20. Rieke V, Vigen KK, Sommer G, Daniel BL, Pauly JM , Pauly KB. Magn Reson Med 2004;51:1223-1231.
21. de Senneville BD, Ries M, Maclair G, Moonen C. IEEE transactions on medical imaging 2011;30(11):1987-1995.
22. Sprinkhuizen SM, Konings MK, van der Bom MJ, Viergever MA, Bakker CJ, Bartels LW. Magn Reson Med 2010;64(5):360-372.
23. Kuroda K, Oshio K, Chung AH, Hynynen K, Jolesz FA. Magn Reson Med 1997;38:845 - 851.
24. de Zwart JA, Vimeux FC, Delalande C, Canioni P, Moonen CT. Magn Reson Med 1999;42:53-59.
25. McDannold N. Int J Hyperthermia 2005;21(6):533-546.
26. Kuroda K. J Magn Reson Imag 2018;47(2):316-331.
27. Zhao F, Noll DC, Nielsen JF, Fessler JA. IEEE Trans Med Imag 2012;31(9):1713-1723.
28. Todd N, Adluru G, Payne A, DiBella EV, Parker D. Magn Reson Med 2009;62(2):406-419.
29. Deckers R, Merckel LG, Denis de Senneville B, Schubert G, Kohler M, Knuttel FM, Mali WP, Moonen CT, van den Bosch MA, Bartels LW. Phys Med Biol 2015;60(14):5527-5542.
30. Kuroda K, Kokuryo D, Kumamoto E, Suzuki K, Matsuoka Y, Keserci B. Magn Reson Med 2006;56(4):835-843.
31. Salomir R, Viallon M, Kickhefel A, Roland J, Morel DR, Petrusca L, Auboiroux V, Goget T, Terraz S, Becker CD, Gross P. IEEE transactions on medical imaging 2012;31(2):287-301.
32. Grissom WA, Lustig M, Holbrook AB, Rieke V, Pauly JM, Pauly KB. Magn Reson Med 2010;64(4):1068-1077.
33. Grissom WA, Rieke V, Holbrook AB, Medan Y, Lustig M, Santos J, McConnell MV, Pauly KB. Med Phys 2010;37(9):5014-5026.
34. Todd N, Diakite M, Payne A, Parker DL. Magn Reson Med 2013;69(1):62-70.
35. Kuroda K, Iwabuchi T, Obara M, Honda M, Saito K, Imai Y. Magn Reson Med Sci 2011;10(3):177-183.
36. Baron P, Ries M, Deckers R, de Greef M, Tanttu J, Kohler M, Viergever MA, Moonen CT, Bartels LW. Magn Reson Med 2014;72(4):1057-1064.
37. Hynynen K. J Magn Reson Imaging 2011;34(3):482-493.
38. Kim YS. Int J Hyperthermia 2015;31(3):225-232.
39. Han M, Rieke V, Scott SJ, Ozhinsky E, Salgaonkar VA, Jones PD, Larson PE, Diederich CJ, Krug R. Magn Reson Med 2015;74(6):1548-1555.
Figures


