Synthetic Myelin Imaging
Marcel Warntjes1
1University of Linkoping, Linkoping, Sweden
Synopsis
Synthetic MR imaging is a method that creates conventional T1W, T2W and FLAIR images by measuring the T1 and T2 relaxation times. The method can only resolve slow relaxation components, but by using a model for myelin including magnetization exchange, it can infer the presence of myelin. The advantage of the method is the short scan time, where typically full head coverage is obtained in 6 minutes. A new sequence is developed where even a 1 mm isotropic resolution can be obtained in that scan time. An overview is provided of the measurements, modeling and clinical application of myelin detection using synthetic MRI.
Abstract
A well established method for detecting myelin is measuring the multi-exponential T2 relaxation, where short relaxation components are attributed to the myelin water and the longer relaxation components to cellular water. It has been observed that the changes in amplitude of these components are correlated with a shift in relaxation time of the longer component. The same is true for T1 relaxation. Synthetic MR imaging is a method that creates conventional T1W, T2W and FLAIR images by measuring the T1 and T2 relaxation times. The method can only resolve the longer components, but by using the correlation shift-amplitude, it can also infer the presence of myelin. The advantage of the method is the short scan time, where typically full head coverage is obtained in 6 minutes with a resolution of 0.8 mm in plane in 30 slices. A new sequence is developed where even a 1 mm isotropic resolution can be obtained in the same scan time. An overview is provided of the measurements, modeling and clinical application of myelin detection using synthetic MRI.Acknowledgements
No acknowledgement found.References
No reference found.Figures
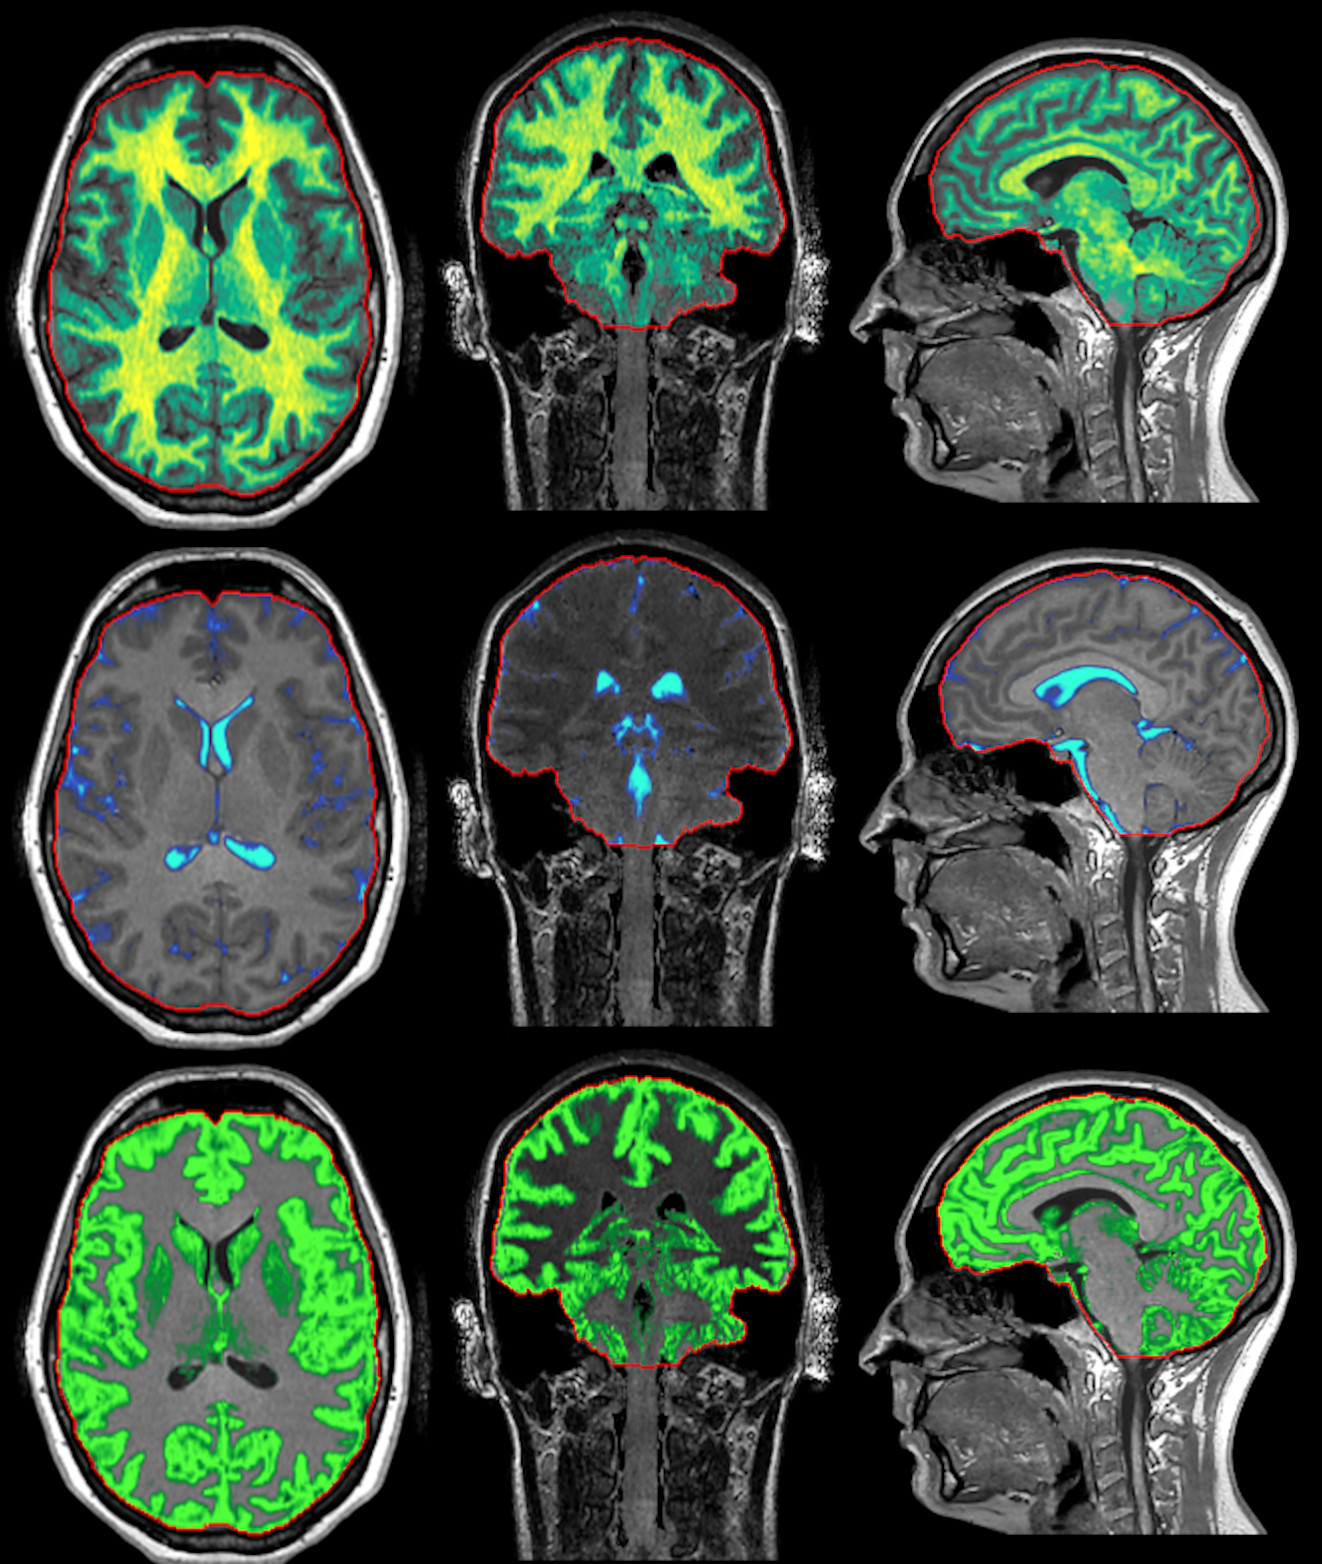
Example of 3D synthetic MRI. A 3D sequence is performed to measure T1 and T2 relaxation and proton density. Based on T1, T2 and PD, synthetic images can be generated, such as the T1W displayed in the background. Even though the short relaxation component of myelin is not directly observed in the acquisition data, its presence is inferred by the shifts in T1 and T2 relaxation and the correspondant decrease of PD. Myelin (top row) is shown as a color overlay where the color corresponds to partial volume of myelin of each acquisition voxel. The same model can also provide CSF and grey matter.