Magnetization Transfer Techniques
1CRMBM - Aix Marseille univ, CNRS UMR 7339, France
Synopsis
The potential of Magnetization Transfer techniques (MTR, qMT and ihMT) for myelin imaging is presented
Purpose and Target Audience
This presentation aims at providing an outline of the potential of magnetization transfer techniques for myelin imaging. In particular, this presentation will show how quantitative MT and ihMT, a new MT-based imaging technique, can overcome limitations of the basic MT contrast to provide more specific information related to myelin. The potential and scientific/technical challenges of these approaches for clinical applications are discussed. This presentation will target basic scientists and clinicians with in interest in quantitative and specific myelin imaging.Magnetization Transfer MRI: an indirect mean to assess myelin in vivo
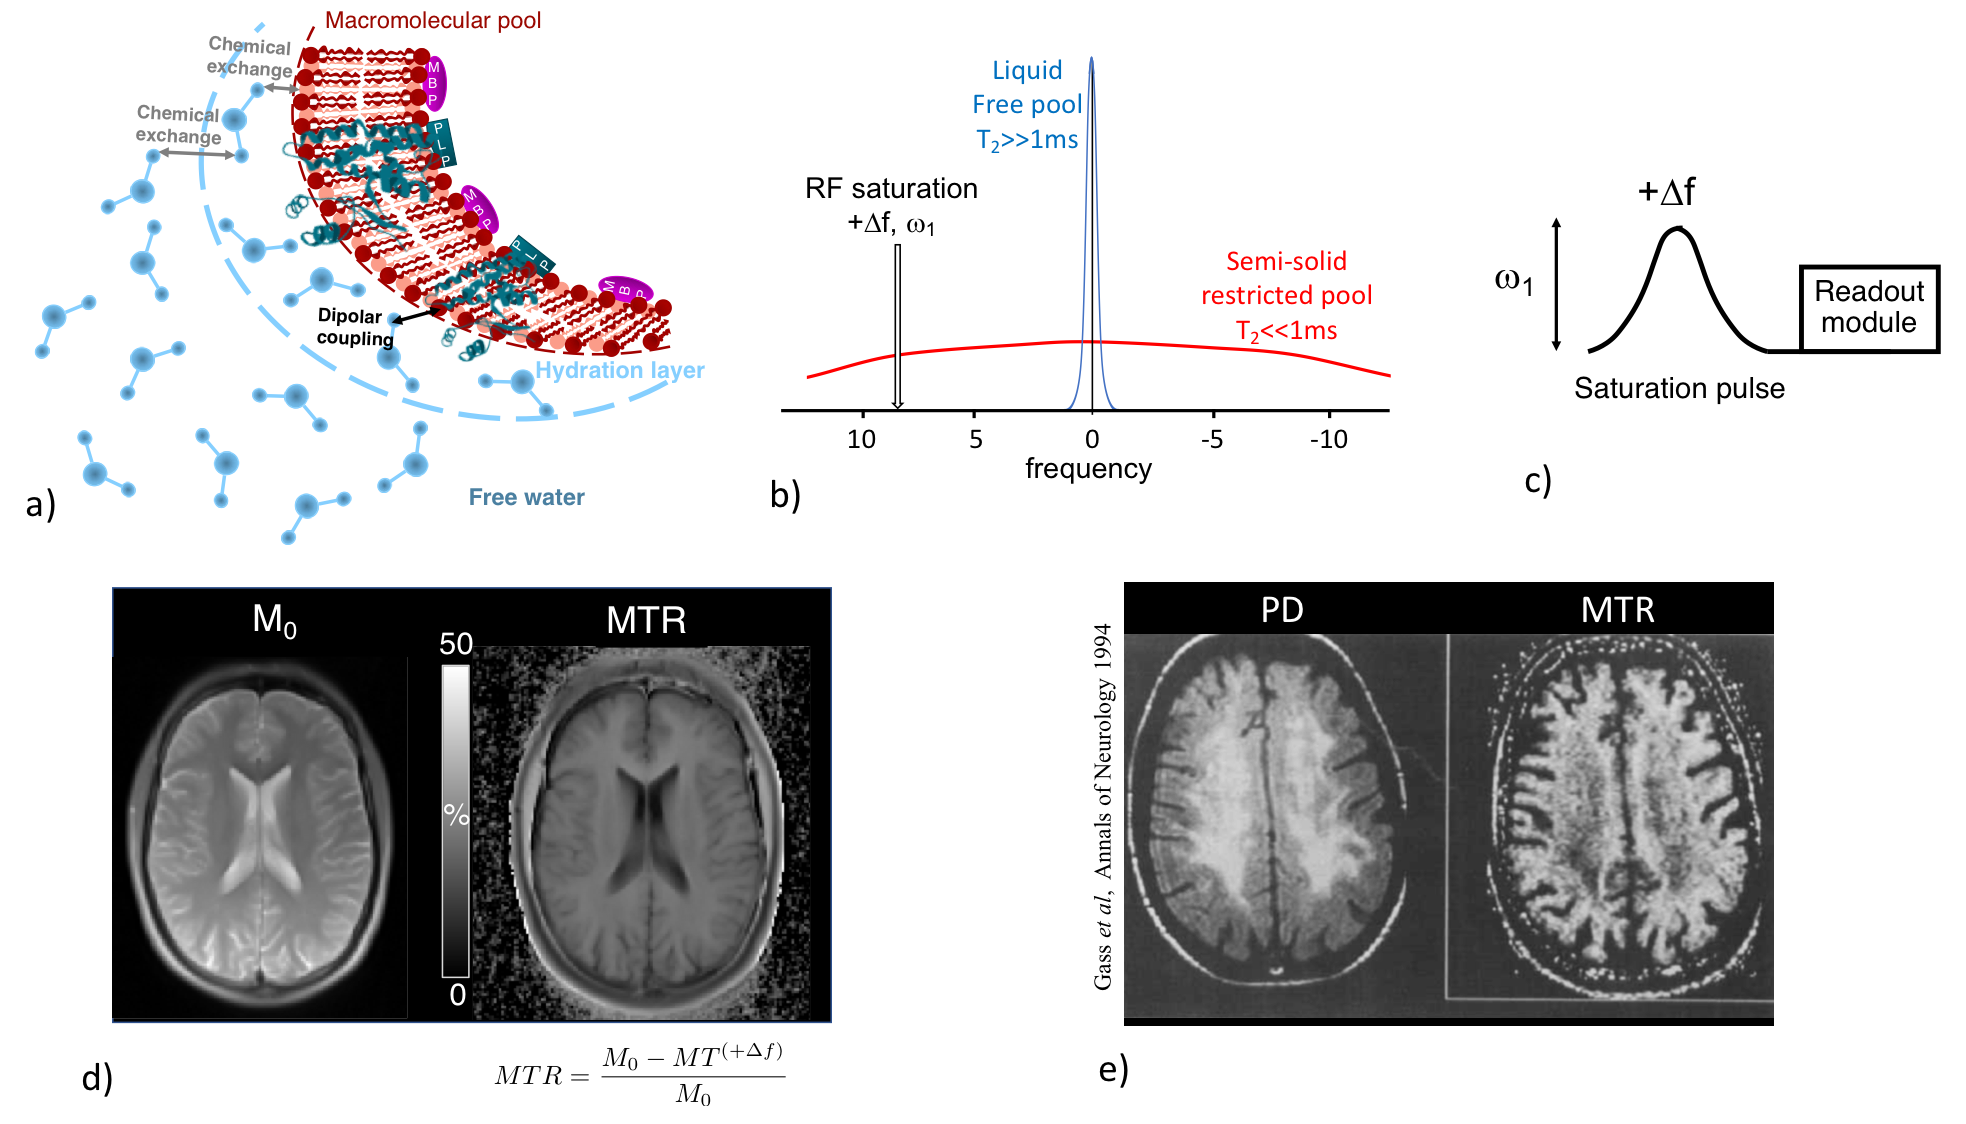
Magnetization transfer (MT) imaging1 is an MRI technique whose contrast is based on the spin exchange between long-T2 water protons (on which MR signal is collected) and very short-T2 (<<1ms) non-directly detectable semi-solid protons associated with macromolecules and membranes in tissues (Fig. 1a).
The principle of magnetization transfer imaging relies on the possibility to selectively saturate the broad macromolecular proton spectrum using an off-resonance RF irradiation (Fig. 1b). Dipolar interactions and chemical exchanges between saturated macromolecular protons and free protons result in the net decrease of the free protons magnetization, and therefore in a net decrease of the MR signal.
Magnetization Transfer (MT) Contrast
In practice, a MT dependent contrast image (MT+Δf) can be readily obtained by the application of an off-resonance RF saturation pulse (power ω1, frequency +Δf) prior to a readout module (Fig. 1c). The acquisition of a reference image, M0, with the saturation power set to 0, allows deriving the semi-quantitative metric, the magnetization transfer ratio (MTR).
Strong MT effects occur in white matter (WM), and the good sensitivity of MTR to myelinated tissues (Fig. 1d) provided precious knowledge regarding pathological myelin in animal models(2,3) and in clinical studies especially in the field of Multiple Sclerosis (MS)(4–6). Demyelination, which causes a breakdown of the macromolecular structure, results in adecreased MTR as it has been reported in demyelinated WM lesions in MS patients(2,4,5,7) (Fig. 1e). MTR is however not specific to myelin and mechanisms other than demyelination, such as inflammation, gliosis or edema, also induce MTR variations(8,9). Hence the establishment of the underlying mechanisms for the reduction in MTR is very difficult to make even from the collection of various experimental evidences.
Quantitative Magnetization Transfer (qMT)
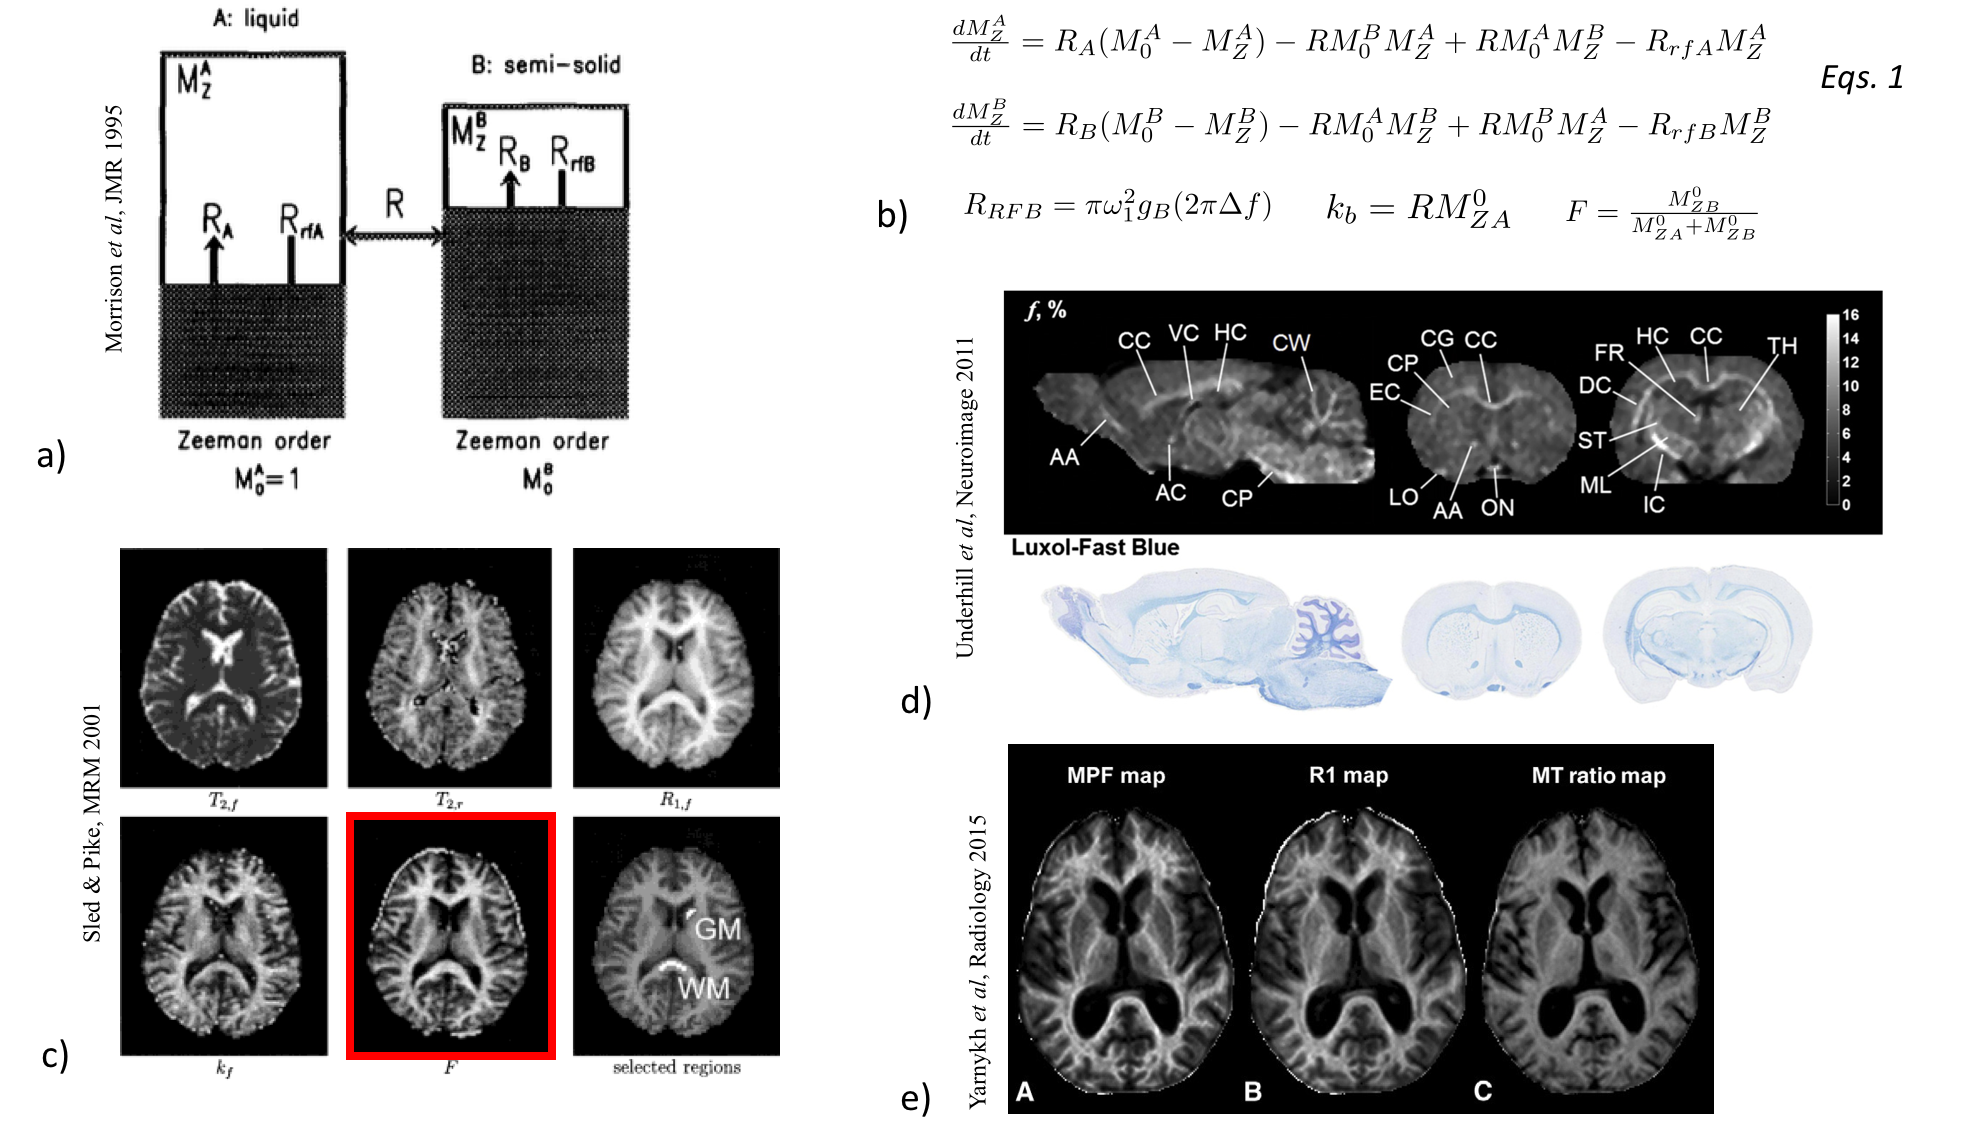
To overcome limitations of MTR, biophysical quantitative models of magnetization transfer (qMT) have been developed and solved. A binary coupled spin-bath model10 is usually used (Fig. 2a) and coupled differential equations based on the Modified Bloch equations that include exchange of longitudinal magnetization are used to describe the evolution of magnetization of the free protons pool (A) and a semi-solid (restricted) protons pool (B)11 (Eqs.1, Fig. 2b).
General solutions of Eqs.1 can be obtained for steady-state conditions and approximations to handle the time-varying coefficients (ω1) associated to the short, shaped RF pulses used for saturation in clinical MT scans(12–15).
In practice, fits of solutions of Eqs.1 to experimental MT data acquired with varying RF pulse amplitudes and frequency offsets allow estimation of the biophysical parameters of the restricted pool(12,16): kB, RB, F, T2B (Fig. 2c).
The macromolecular proton fraction, F, is of particular interest as it has shown strong associations with the myelin content(17,18) (Fig. 2d) and provided clinically relevant information about demyelination in MS(16,19–21) (Fig. 2e).
Multi-parameter qMT fit procedures involve a large number of input images whose acquisition time is a restriction to the extended clinical use of macromolecular proton fraction imaging. Single-point MT associated with constraint of model parameters has been proposed to overcome this limitation23.
inhomogeneous Magnetization Transfer (ihMT)
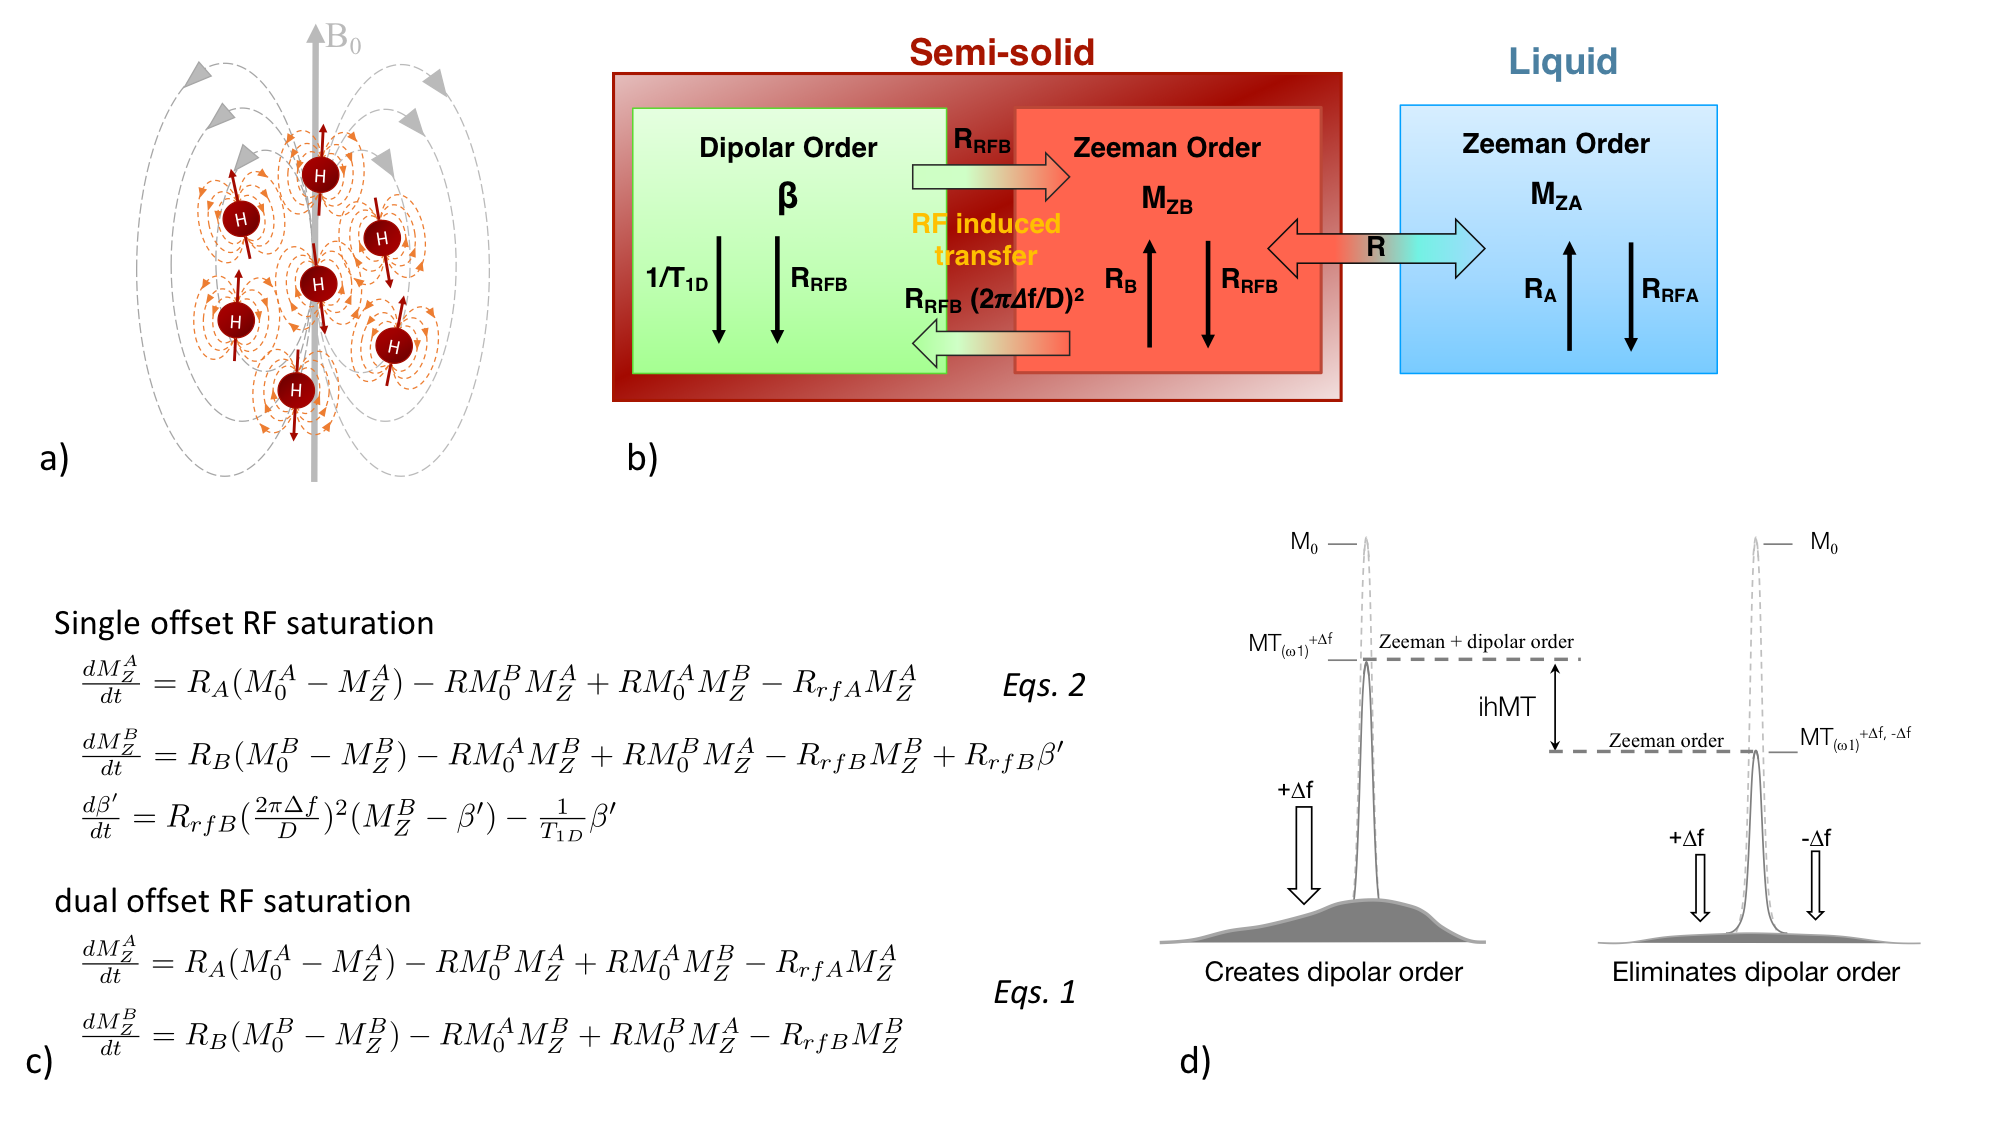
The magnetization of the restricted pool submitted to RF irradiation can be more appropriately described by the theory of RF saturation in solids under weak RF field, first derived by Provotorov24 using the concept of spin temperature25. In this representation, the restricted pool is divided into Zeeman and dipolar orders (Fig. 3a), which can be described by their spin temperature, and that are effectively coupled in the presence of single offset RF irradiation (Fig. 3b). The RF saturation theory inserted into the spin-bath model(22,26) allows taking into account the contribution of Zeeman and dipolar orders on the free pool magnetization during a single-offset (+Δf) MT experiment (Eqs.2, Fig. 3c).
The existence of dipolar order arises from the nonzero time-averaged dipolar Hamiltonian; a case encountered in molecules with strong motional restrictions and weak spin diffusion(27,28) such as lipids that make up the bilayer structures in myelin. Hence, isolating the effects of dipolar order from the broad MT signal may be a way to assess myelin more specifically and constitutes the principle of the recently developed ihMT technique29.
Following an MT experiment realized with a single offset RF saturation (+Δf, ω1) for which MT signal is governed by Eqs.2, a second experiment is realized with a symmetric dual-offset RF saturation at same total power (±Δf, ω1). Incorporation of this RF irradiation in Eqs.2 shows that Zeeman order is effectively decoupled from the dipolar order(30,31), which can thus be ignored. For dual RF irradiation, Eqs.2 thus reduce to Eqs.1. Without any dipolar contribution, the RF saturation of the restricted pool is more efficient, which results in an MT image (MT±Δf) more attenuated than that obtained with a single offset RF saturation (MT+Δf). The difference of the two MT images, which defines the ihMT image is a simple way to isolate dipolar order effects (Fig. 3d).
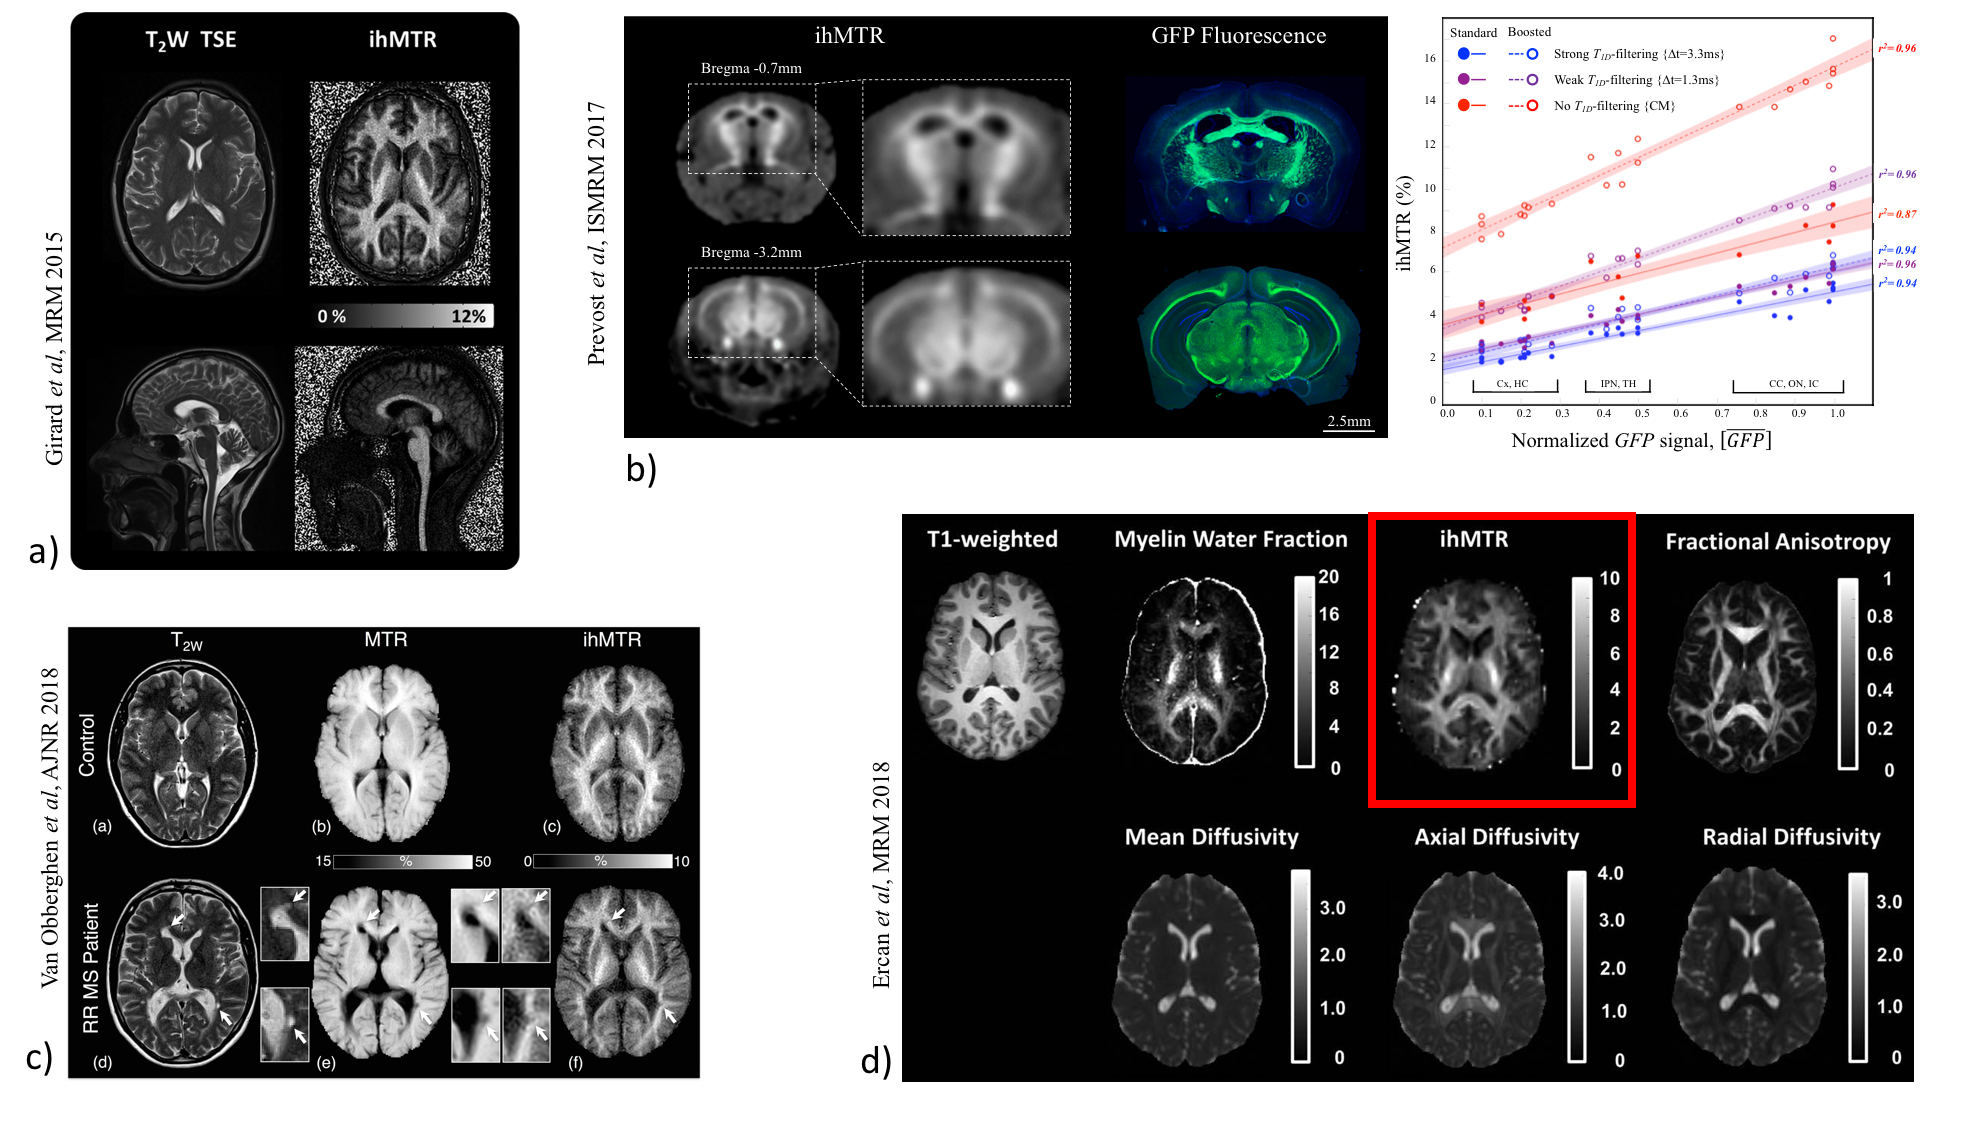
ihMT images have shown strong apparent specificity for CNS myelinated tissue (Fig. 4a), and a recent study on genetically-modified mice formalized the association of the ihMT signal with myelin content assessed by a reference histological myelin imaging technique32 (Fig. 4b).
These properties have made ihMT an attractive method to assess myelin-related information in vivo, in the clinical context of demyelinating diseases(33,34) (Fig. 4c) or in aging studies(35,36).
The physical mechanisms underlying the ihMT signal (relationship with the dipolar order relaxation time T1D(30,37–40), effects of the saturation parameters(37,41-43), sensitivity to white matter structural anisotropy44, correlation with other myelin-sensitive MR imaging technique(35,45) (Fig. 4d) …) is a matter of current investigation.
Acknowledgements
No acknowledgement found.References
1. Wolff SD, Balaban RS. Magn. Reson. Med. 1989;10:135–144
2. Dousset V, et al Radiology 1992;182:483–491
3. Deloire-Grassin MS, et al. J. Neurol. Sci. 2000;178:10–16.
4. Gass A, et al Ann. Neurol. 1994;36:62–67.
5. Filippi M, et al Neurology 1995;45:478–482.
6. Schmierer K, et al Ann. Neurol. 2004;56:407–415
7. van Waesberghe JH, Barkhof F. Neurology 1999;53:S46-48.
8. Vavasour IM, et al J. Magn. Reson. Imaging JMRI 2011;33:713–718
9. Newcombe J, et al Brain J. Neurol. 1991;114 ( Pt 2):1013–1023.
10. EDZES HT, SAMULSKI ET. Nature 1977;265:521–523
11. Henkelman RM, H et al Magn. Reson. Med. 1993;29:759–766.
12. Sled JG, Pike GB. J. Magn. Reson. 2000;145:24–36
13. Ramani A, et al Magn. Reson. Imaging 2002;20:721–731.
14. Yarnykh VL. P Magn. Reson. Med. 2002;47:929–939
15. Portnoy S, Stanisz GJ. Magn. Reson. Med. 2007;58:144–155
16. Sled JG, Pike GB. Magn. Reson. Med. 2001;46:923–931.
17. Underhill HR, et al NeuroImage 2011;54:2052–2065
18. Thiessen JD, et al NMR Biomed. 2013;26:1562–1581
19. Tozer et al. Magn. Reson. Med. 2003;50:83–91
20. Davies GR, et al Mult. Scler. 2004;10:607–613.
21. Yarnykh VL, et al Radiology 2015;274:210–220
22. Morrison C, et al J. Magn. Reson. B 1995;108:103–113.
23. Yarnykh VL. Magn. Reson. Med. 2012;68:166–178
24. Provotorov B. Zh Exsp Teor Fiz 1962;14:1126–1131.
25. Goldman M. Oxford University Press.; 1970.
26. Yeung HN, et al J. Magn. Reson. A 1994;106:37–45
27. Chan SI, et al Nature 1971;231:110–112
28. Wennerström H akan. Chem. Phys. Lett. 1973;18:41–44.
29. Varma G, et al Magn.Reson. Med. 2015;73:614–622
30. Varma G, et al. J. Magn. Reson. 2015;260:67–76
31. Lee J-S et al. J. Chem. Phys. 2011;134:234504
32. Prevost VH, et al ISMRM; 2017. p. 1498.
33. Rasoanandrianina H, et al NMR Biomed. 2017;30
34. Van Obberghen E, et al Am. J. Neuroradiol. 2018;39:634–641
35. Geeraert BL, et al NeuroImage 2017
36. Taso M, et al NMR Biomed. 2016
37. Prevost VH, et al. NMR Biomed. 2017;30
38. Swanson SD, et al. Magn. Reson. Med. 2017;77:1318–1328
39. Manning AP, J. Magn. Reson. 2016;274:125–136
40. Varma G, et al Magn.Reson. Med. 2017;78:1362–1372
41. Girard OM, et al Magn. Reson. Med. 2015;73:2111–21
42. Mchinda S, et al Magn. Reson. Med. 2017;79:2607–2619
43. Varma G, et al J. Magn. Reson. 2018;296:60–71
44. Girard OM, et al ISMRM; 2017 p472
45. Ercan E, et al Magn. Reson. Med. 2018 doi: 10.1002/mrm.27211
Figures