Data Processing, Fitting & Quantification
1CREATIS, CNRS UMR 5220, Lyon, France
Synopsis
This lecture tackles the main steps and concepts underlying the quantitative analysis of MR spectroscopic signal in an in vivo context. The goal is to obtain reliable metabolite concentrations from its analysis.
TARGET AUDIENCE:
Researchers and clinical users of MR spectroscopy (MRS) wanting to review the main requirements and approaches to extract quantitative parameters –essentially the metabolite concentrations- from the spectroscopic signal.OBJECTIVES
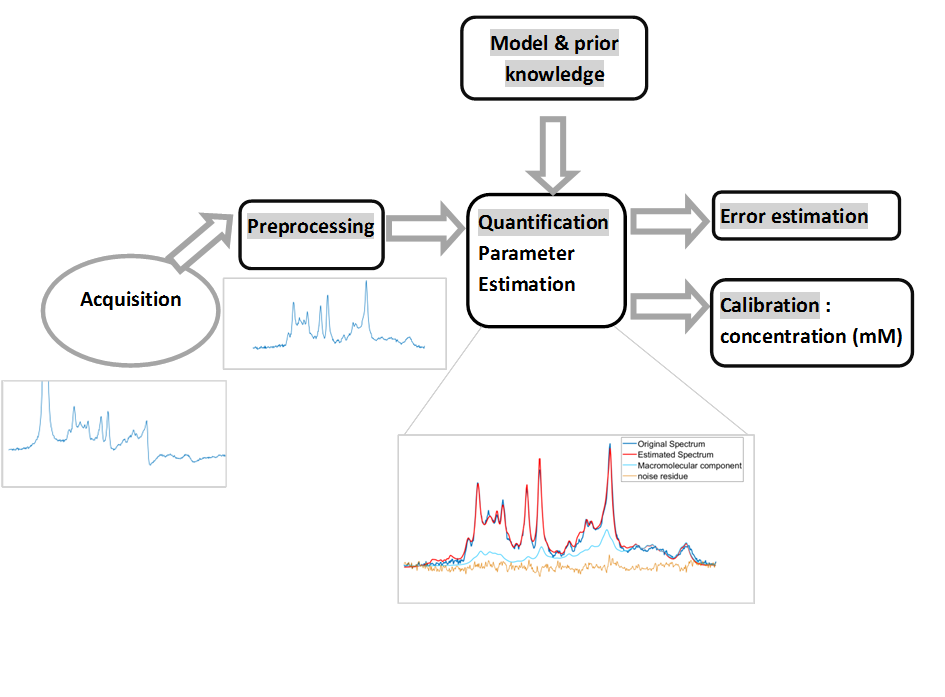
This lecture tackles the main steps and concepts underlying the quantitative analysis of MR spectroscopic signal in an in vivo context. The goal is to obtain reliable metabolite concentrations from its analysis. Indeed the signal amplitudes in the time domain (i.e the measurement domain) or equivalently the relative resonance areas in the frequency domain (spectrum after Fourier transformation) are directly proportional to the metabolite concentrations. Starting from the necessary signal processing requirements, the main spectral fitting methods and principles are surveyed. All along the lecture, underlying mathematical models, time and frequency domain signal representations are given. Indeed, all the analysis of the spectroscopic data resides on a mathematical and parametric description of the signal.Data pre-processing
Before the quantification procedure, data quality assessments together with preprocessing are often necessary to prepare and “clean” the signal. Indeed, different phenomena linked to the acquisition conditions need to be taken in consideration in order to simplify or ease the subsequent quantification procedure. The main preprocessing concerns phase correction and frequency alignment. These preprocessing steps can be essential when dealing, for example, with diffusion measurement (Diffusion weighted MRS (Upadhyay et al., 2007)). When individual spectra are stored, these preprocessing steps enable to improve both signal to noise ration and linewidth (and thus the spectral resolution). Frequency alignment can be done by spectral registration (Near et al., 2015). Other specific processing will be addressed such as correction of line shape distortions due to field inhomogeneity linked to eddy current effects (Graaf et al., 1990) or residual water peak suppression.Data Quantification
Several spectral fitting approaches and methods have been proposed over the last two decades. The majority of them are model-based. The basics will be recalled: the signal is described with a parametric model, and the quantitative analysis consists in the estimation of the model parameters. Fitting of this model function to the low SNR spectroscopic data can be performed either in the time domain or in the frequency domain. The most popular fitting methods implements a non linear least squares algorithm that aims at minimizing the square distance between the model signal/spectrum and the acquired signal/spectrum.(LCModel (Provencher, 1993), TARQUIN (Wilson et al., 2011), QUEST (Ratiney et al., 2005), AQSES (Poullet et al., 2007), VARPRO(Veen et al., 1988), AMARES (Vanhamme et al., 1997), VESPA (Soher et al., 1998), FID-A (Simpson et al., 2017), MIDAS(Maudsley et al., 2006) ). The signal model depends on the sequence parameters, on the considered nucleus and the targeted organ. One can distinguish two cases: A) the sparse spectrum, B) spectrum with overlapping peaks and multiplets. A) The spectrum to analyze is considered as sparse when it contains a small number (Npeak<10) of distinct resonating lines compared to the acquisition bandwidth. Then a simple MRS model can be employed such as a sum of individual exponentially decaying functions in the time domain or Lorentzian peaks in the frequency domain. Sparse spectra are typically found in 13C MRS, 31P MRS, or 1H long echo time acquisition. B) When spectra exhibit visible multiplets, strongly overlapping spectral signatures, the most powerful approach is to describe the acquired signal as a linear combination of isolated metabolites. This problem is typically encountered in short TE 1H NMR spectra analysis. Indeed at short TE, many molecules with short T2 have coupled spin systems resulting in multiplets.Incorporating Prior Knowledge
Prior knowledge plays a central role in in vivo MRS data quantification. Apart from increasing precision, it can be crucial to improve the parameter identifiability. A number of considerations should be taken into account: - Setting up of the metabolite basis from : either quantum mechanics simulations (NMR-SCOPE in jMRUI, GAMMA) or experimental measurements using high concentration of individual metabolite. For quantum mechanics simulation the prior knowledge on the metabolite spin systems, with accurate J coupling and chemical shifts is required (Kaiser et al., 2008; Kreis and Bolliger, 2012; Govind et al., 2015) -setting up of the parameter relations (e.g linear relations between frequencies, or damping factors, or amplitude as for example within a system with known scalar couplings) - Specific to short TE 1H spectrum analysis is the handling of the macromolecular contribution. Incorporation of the experimentally measured macromolecule baseline is highly desirable in terms of quantification precision and bias. - Specific to spectra where the main contributions come from triglycerides (such as in liver steatosis, adipose tissue), some specific prior knowledge can help to qualify the lipid composition (i.e proportion of saturated, unsaturated and poly-saturated lipids)Absolute quantification
The fitting procedure provides relative resonance areas (or signal amplitudes). However, the aim is to provide quantification results expressed in terms of concentration of a specific metabolite (e.g. in mmol.L-1) so as to enable direct comparison with data acquired at a different magnetic field, different coils or simply different measurement techniques. Three calibrations methods will be reviewed: 1) with internal reference2) with External concentration reference 3) phantom replacement
Error Estimation
Model-based Estimator accuracy can be assessed by considering the Cramér Rao lower bound (CRLBs) computed from the Fisher information matrix. The CRLB are the lowest possible standard deviations of the model parameters estimated from the data. Consequently they constitute a standard of precision to which the result of quantification can be compared (Cavassila et al., 2001). CRLBs are computed using the estimated parameter, when considering that convergence has been reached Also, high CRLBs indicate unreliable quantification results, but low CRLBs does not necessary guarantee valid quantification results. CRLBs use should be done with caution (Kreis, 2016) (Bonny and Pagès, 2019)User Interface
User interfaces can help to get into the MRS data analysis: jMRUI (www.jmrui.eu/) , voxelshift/Csiapo https://www.sattse.com/innovation2/voxelshift/ (Le Fur et al., 2010), python mrsViewer (https://www.creatis.insa-lyon.fr/site7/en/mrsviewer), TARQUIN http://tarquin.sourceforge.net/, VESPA https://scion.duhs.duke.edu/, FID-A : https://github.com/CIC-methods/FID-A .Acknowledgements
ANR-11-LABX-0063/ ANR-11-IDEX-0007References
Bonny,
J.-M., Pagès, G., 2019. Uncertainties of
calculated Cramér-Rao lower bounds: implications for quantitative MRS. Magnetic
Resonance in Medicine 81, 759–764. https://doi.org/10.1002/mrm.27415
Cavassila, S., Deval,
S., Huegen, C., van Ormondt, D., Graveron-Demilly, D., 2001. Cramér-Rao bounds:
an evaluation tool for quantitation: CRAMÉR-RAO BOUNDS. NMR in Biomedicine 14,
278–283. https://doi.org/10.1002/nbm.701
Govind, V., Young, K.,
Maudsley, A.A., 2015. Corrigendum: Proton NMR chemical shifts and coupling
constants for brain metabolites.
Govindaraju V, Young K, Maudsley AA, NMR
Biomed. 2000; 13: 129–153. NMR in Biomedicine 28, 923–924.
https://doi.org/10.1002/nbm.3336
Graaf, A.A.D., Dijk,
J.E.V., BoéE, W.M.M.J., 1990. Quality: quantification improvement by converting
lineshapes to the lorentzian type. Magnetic Resonance in Medicine 13, 343–357.
https://doi.org/10.1002/mrm.1910130302
Kaiser, L.G., Young, K.,
Meyerhoff, D.J., Mueller, S.G., Matson, G.B., 2008. A detailed analysis of
localized J-difference GABA editing: theoretical and experimental study at 4 T.
NMR in Biomedicine 21, 22–32. https://doi.org/10.1002/nbm.1150
Kreis, R., 2016. The
trouble with quality filtering based on relative Cramér-Rao lower bounds.
Magnetic Resonance in Medicine 75, 15–18. https://doi.org/10.1002/mrm.25568
Kreis, R., Bolliger,
C.S., 2012. The need for updates of spin system parameters, illustrated for the
case of γ-aminobutyric acid. NMR
in Biomedicine 25, 1401–1403. https://doi.org/10.1002/nbm.2810
Le Fur, Y., Nicoli, F.,
Guye, M., Confort-Gouny, S., Cozzone, P.J., Kober, F., 2010. Grid-free
interactive and automated data processing for MR chemical shift imaging data.
Magn Reson Mater Phy 23, 23–30. https://doi.org/10.1007/s10334-009-0186-y
Maudsley, A.A.,
Darkazanli, A., Alger, J.R., Hall, L.O., Schuff, N., Studholme, C., Yu, Y.,
Ebel, A., Frew, A., Goldgof, D., Gu, Y., Pagare, R., Rousseau, F.,
Sivasankaran, K., Soher, B.J., Weber, P., Young, K., Zhu, X., 2006. Comprehensive
processing, display and analysis forin vivo MR spectroscopic imaging. NMR in
Biomedicine 19, 492–503. https://doi.org/10.1002/nbm.1025
Near, J., Edden, R.,
Evans, C.J., Paquin, R., Harris, A., Jezzard, P., 2015. Frequency and Phase
Drift Correction of Magnetic Resonance Spectroscopy Data by Spectral
Registration in the Time Domain. Magn Reson Med 73, 44–50.
https://doi.org/10.1002/mrm.25094
Poullet, J.-B., Sima,
D.M., Simonetti, A.W., Neuter, B.D., Vanhamme, L., Lemmerling, P., Huffel,
S.V., 2007. An automated quantitation of short echo time MRS spectra in an open
source software environment: AQSES. NMR in Biomedicine 20, 493–504.
https://doi.org/10.1002/nbm.1112
Provencher, S.W., 1993.
Estimation of metabolite concentrations from localizedin vivo proton NMR
spectra. Magnetic Resonance in Medicine 30, 672–679.
https://doi.org/10.1002/mrm.1910300604
Ratiney, H., Sdika, M.,
Coenradie, Y., Cavassila, S., van Ormondt, D., Graveron-Demilly, D., 2005.
Time-domain semi-parametric estimation based on a metabolite basis set. NMR in
Biomedicine 18, 1–13. https://doi.org/10.1002/nbm.895
Simpson, R., Devenyi,
G.A., Jezzard, P., Hennessy, T.J., Near, J., 2017. Advanced processing and
simulation of MRS data using the FID appliance (FID-A)—An open source, MATLAB-based
toolkit. Magnetic Resonance in Medicine 77, 23–33.
https://doi.org/10.1002/mrm.26091
Soher, B.J., Young, K.,
Govindaraju, V., Maudsley, A.A., 1998. Automated spectral analysis III:
Application to in Vivo proton MR Spectroscopy and spectroscopic imaging.
Magnetic Resonance in Medicine 40, 822–831.
https://doi.org/10.1002/mrm.1910400607
Upadhyay, J., Hallock,
K., Erb, K., Kim, D.-S., Ronen, I., 2007. Diffusion properties of NAA in human
corpus callosum as studied with diffusion tensor spectroscopy. Magnetic
Resonance in Medicine 58, 1045–1053. https://doi.org/10.1002/mrm.21372
Vanhamme, L., van den
Boogaart, A., Van Huffel, S., 1997. Improved Method for Accurate and Efficient
Quantification of MRS Data with Use of Prior Knowledge. Journal of Magnetic Resonance
129, 35–43. https://doi.org/10.1006/jmre.1997.1244
Veen, J.W.C. van der,
Beer, R. de, Luyten, P.R., Ormondt, D. van, 1988. Accurate quantification of in
vivo 31P NMR signals using the variable projection method and prior knowledge.
Magnetic Resonance in Medicine 6, 92–98. https://doi.org/10.1002/mrm.1910060111
Wilson, M., Reynolds,
G., Kauppinen, R.A., Arvanitis, T.N., Peet, A.C., 2011. A constrained
least-squares approach to the automated quantitation of in vivo 1 H
magnetic resonance spectroscopy data: Automated Quantitation of In Vivo 1
H MRS Data. Magnetic Resonance in Medicine 65, 1–12.
https://doi.org/10.1002/mrm.22579
Figures