Measuring Metabolic Rate with 17O: MR vs. PET
1Radiology - Medical Physics, University Medical Center Freiburg, Freiburg, Germany
Synopsis
17O MRI can be used to quantify metabolic rates of oxygen consumption. The use of 17O methods is currently still complicated as the SNR of 17O is very low, and the spatial resolution is limited. Nevertheless, reliable measurements of the cerebral metabolic rate of oxygen consumption have been performed that are in good agreement with values from 15O PET.
Target Audience
Researchers and clinicians interested in the measurement of oxygen consumptionObjectives
Participants of this lecture will
- become acquainted with the fundamental principles of 17O MRI
- learn methods to determine metabolic rates of oxygen consumption from dynamic 17O MRI measurements
- be able to identify strengths and weaknesses of these methods
- compare the methods to other techniques such as PET
Introduction
Neuro-degenerative diseases (Alzheimer’s disease, Parkinson’s disease, and Huntington's disease), tumors or aging alter the oxygen metabolism. To study these processes and to monitor disease progression, a quantitative imaging method would be desirable that can map the local metabolic rate of oxygen consumption (MRO2). Many indirect proton MRI methods for MRO2 quantification have been proposed, which have the advantage that they can be implemented on any clinical MRI system. However, for MRO2 quantification direct 17O MRI is preferable, as it allows detecting of the only MR-accessible stable oxygen isotope 17O via its metabolic end product H217O. Thus, MRO2 can be determined in vivo from the 17O MRI signal changes during and after inhalation of isotope-enriched 17O gas.Dynamic Oxygen-17 MRI
To measure metabolic rates with 17O MRI, several different components must be available: a system to administer the gaseous tracer 17O, a broadband RF transmit system for RF excitation at the 17O frequency, a dedicated 17O Tx/Rx coil, an optimized pulse sequence to acquire a dynamic image series, and a post-processing framework to calculate the metabolic rates using pharmaco-kinetic modeling.
In general, 17O MRI and MRS is challenging due to the extreme properties of the 17O nucleus: the natural abundance of 17O is only 0.037% and the gyromagnetic ratio of the 17O nucleus is approximately sevenfold lower than that of protons, which results in a relative sensitivity of 1.1·10-5 compared to 1H. To overcome this low sensitivity, direct detection of the 17O MR signal has been predominantly performed at ultra-high magnetic fields (UHFs) of 7 T and 9.4 T. UHF MR systems are unfortunately not widely available, and are not yet used in clinical routine. Recently, feasibility of direct 17O MRI has been reported in human brain and heart at clinical field strengths of 3 T, so that the implementation MRO2 quantification at clinical MR systems seems feasible.
To study the oxygen metabolism, isotope-enriched 17O with up to 70% enrichment factors is inhaled, and the change in 17O MRI signal is monitored in the target organ (mostly, the brain). In the previous studies, a re-breathing system was implemented for efficient usage of rare and expensive 17O2 gas by re-inhalation of the stored 17O2 gas in subsequent inhalation cycles. Unfortunately, this delivery method leads to uncertainties in the determination of the 17O enrichment fraction of the inhaled gas, which in turn can lead to systematic errors in the quantities derived from this enrichment fraction.
Another limitation of 17O MRI is the short relaxation times of H217O. With a T2* on the order of 2-3 ms, pulse sequences with very short echo times are required. Thus, 17O MRI is preferably performed with ultra-short TE (UTE) pulse sequences which acquire k-space data radially and which can achieve TEs as low as 40 μs. Radial UTE k-space sampling is often performed in combination with a density compensated gradient encoding scheme to increase the SNR and to optimize the point spread function. Due to the short T1 of only 4-6 ms, UTE data acquisition can be realized with short repetition times and high flip angles (TR = 4-8 ms, α = 30°-70°) without saturating the weak 17O MR signal.
An advantage of the UTE data acquisition is the possibility to trade the spatial resolution against the temporal resolution. In dynamic UTE acquisitions radial k-space sampling is repeated many times, and with a suitable ordering of the radial k-space spokes (e.g. using a Golden Angle scheme) temporal and spatial resolution can be selected after the acquisition. Typically, a spatial resolution of 8-10 mm is used and a temporal acquisition window of 1-2 min is selected.
Calculation of Metabolic Rates
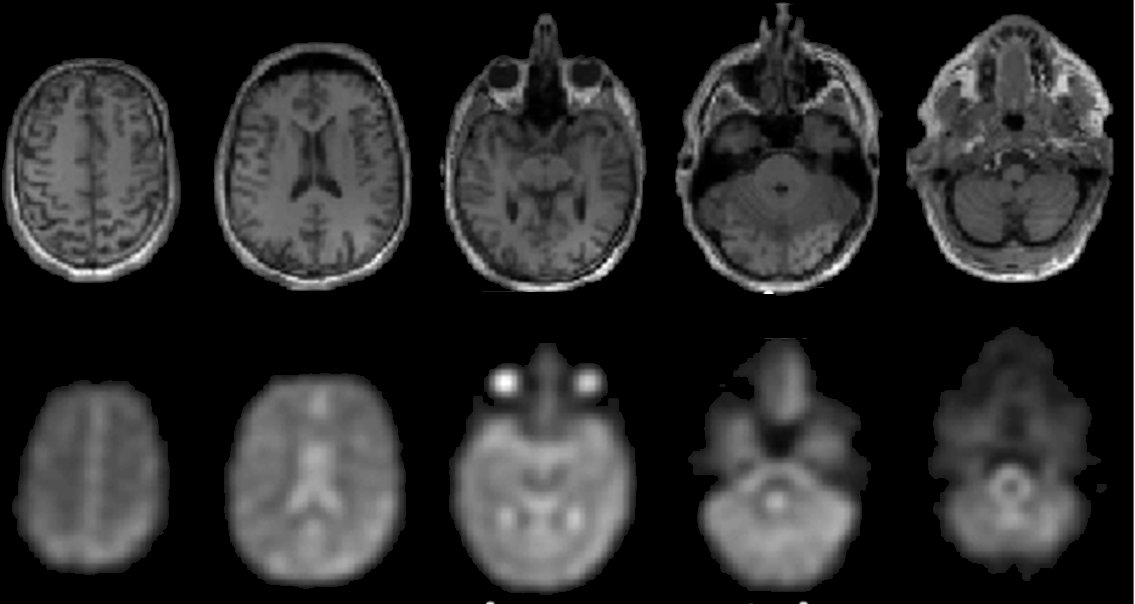
From the dynamic 17O MRI experiment the time evolution of the 17O MR signal is extracted either in a pixel-wise manner or for selected anatomical regions. If TR is not too short, the 17O MR signal can be assumed to be linearly correlated with the concentration of 17O due to the short T1. The signal is exclusively representing the H217O concentration, as the 17O2 molecules bound to hemoglobin in the blood or in the gas phase cannot be detected. Thus, the observed 17O MR signal increase after gas inhalation is only proportional to the amount of the metabolized H217O water.
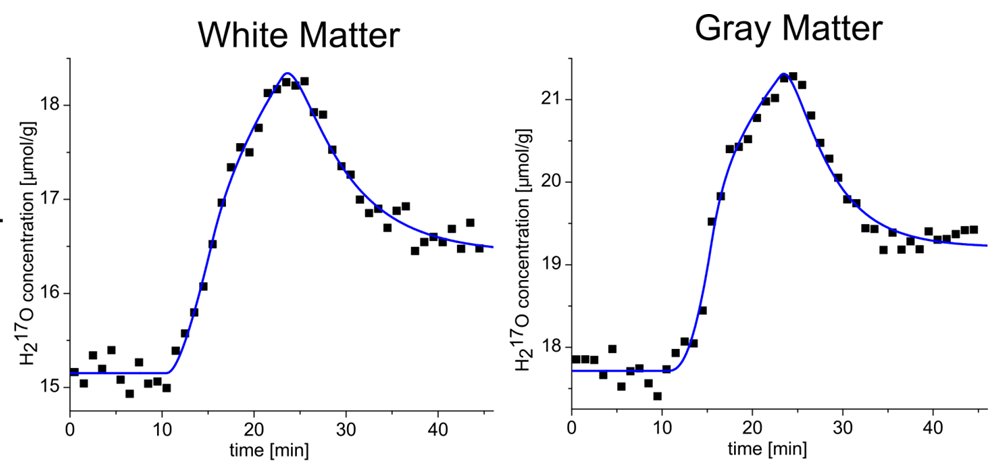
To convert the 17O MR signal into H217O concentration in µmol per gram tissue, the 17O signal intensities are normalized to the baseline phase (i.e., before gas inhalation). Using coregistered 1H image data (e.g., an MPRAGE data set) and the H217O natural abundance of 20.56 µmol/gwater, water partition coefficients and averaged density of brain tissue of 1.038 g/mL, the signal can be converted into absolute concentration values. In a next step the signal-time curves are fitted to a pharmaco-kinetic model. According to the principle of mass conservation, the change of the H217O concentration within a given volume can be caused either by water creation and conversion to other intermediates in the volume, or inward and outward diffusion between neighboring volumes. For the brain, a cerebral MRO2 (CMRO2) quantification model was proposed by Atkinson and Thulborn. The model can be modified to account for pulsed supply of 17O gas that is often used in an experimental setup with a demand oxygen delivery system (DODS).
One fit parameter of the model is CMRO2. In parameter fitting, practical and structural parameter identifiability needs to be investigated to assess the reliability of the fitting results. For example, practical non-identifiability can arise, if data is too noisy, and structurally non-identifiability is observed if the numerical model does not properly describe the measured data. For the identifiability analysis a profile likelihood (PL) method can be used. In PL, confidence intervals (CI) are not based on Fisher information theory which cannot be applied for nonlinear models as the CMRO2 quantification model. The PL analysis of the modified Atkinson model shows that CMRO2 can only be quantified reliably if the 17O enrichment fraction is used as prior information in the model fit.
In the brain, CMRO2 values of about 0.8-1.1 µmol/gtissue/min have been found with 17O MRI in white brain matter, whereas a higher value of 1.1-1.8 µmol/gtissue/min was observed in gray brain matter. These results are in good agreement with reference values from 15O PET which is the only clinically established method for direct oxygen quantification. 15O PET, however, is difficult to implement clinically due to the short isotope half‑life of only 2 min, which requires costly on-site production. Deviations between the PET and the MR measurement can be explained by partial volume effects which are caused by the low resolution of 17O MRI and the additional blurring due to signal decay during the UTE readout. To overcome these limitations, partial volume models based on prior 1H information can be used. With these models, even different compartments can be studied in a lesion such as the necrotic core, the hyperintense rim and the surrounding edema in a glioblastoma.
Acknowledgements
Support from Siemens Healthcare (Erlangen, Germany) and Nukem Isotopes (Alzenau, Germany) is gratefully acknowledged.References
Ashburner J, Friston KJ. Unified segmentation. Neuroimage 2005;26:839–851.
Ashburner J, Friston KJ. Voxel-Based Morphometry - The Methods. Neuroimage 2000;11:805–821. Atkinson IC, Thulborn KR. Feasibility of mapping the tissue mass corrected bioscale of cerebral metabolic rate of oxygen consumption using 17-oxygen and 23-sodium MR imaging in a human brain at 9.4 T. Neuroimage 2010;51:723–733.
Beal MF. Does impairment of energy metabolism result in excitotoxic neuronal death in neurodegenerative illnesses? Ann. Neurol. 1992;31:119–130.
Becker V, Schilling M, Bachmann J, Baumann U, Raue A, Maiwald T, Timmer J, Klingmüller U. Covering a broad dynamic range: information processing at the erythropoietin receptor. Science. 2010;328:1404–1408.
Borowiak R, Groebner J, Haas M, Hennig J, Bock M. Direct cerebral and cardiac 17O-MRI at 3 Tesla: initial results at natural abundance. MAGMA 2014;27:95–99.
Borowiak R, Kurzhunov D, Wagner P, Reisert M, Bock M. Dynamic 17O-MRI at 3 Tesla for in vivo CMRO2 Quantification. In: In proceedings of 23rd Annual Meeting of ISMRM; Toronto, Canada. ; 2015. p. 4633.
Charagundla SR, Stolpen AH, Leigh JS, Reddy R. Off-resonance proton T1rho dispersion imaging of 17O-enriched tissue phantoms. Magn. Reson. Med. 1998;39:588–595.
Coleman TF, Y. L. An interior, trust region approach for nonlinear minimization subject to bounds. SIAM J. Optim. 1996;6:418–445.
Frackowiak RS, Herold S, Petty RK, Morgan-Hughes JK. The cerebral metabolism of glucose and oxygen measured with positron tomography in patients with mitochondrial diseases. Brain 1988;111:1009–1024.
Fukuyama H, Ogawa M, Yamauchi H, Yamaguchi S, Kimura J, Yonekura Y, Konishi J. Altered Cerebral Energy Metabolism in Alzheimer’s Disease : A PET Study. J. Nucl. Med. 1994;35:1–6.
Gnahm C, Bock M, Bachert P, Semmler W, Behl NGR, Nagel AM. Iterative 3D projection reconstruction of 23Na data with an 1H MRI constraint. Magn. Reson. Med. 2014;71:1720–1732.
Gudbjartsson H, Patz S. The Rician Distribution of Noisy MRI Data. Magn. Reson. Med. 1995;34:910–914.
Hindmarsh AC, Brown PN, Grant KE, Lee SL, Serban R, Shumaker DANE, Woodward CS. SUNDIALS : Suite of Nonlinear and Differential / Algebraic Equation Solvers. ACM Trans. Math. Softw. 2005;31:363–396.
Hoffmann SH, Begovatz P, Nagel AM, Umathum R, Schommer K, Bachert P, Bock M. A measurement setup for direct 17O MRI at 7 T. Magn. Reson. Med. 2011;66:1109–1115.
Hoffmann SH, Radbruch A, Bock M, Semmler W, Nagel AM. Direct 17O MRI with partial volume correction: first experiences in a glioblastoma patient. MAGMA 2014;27:579–87.
Hoffmann SH. Localized quantification of the cerebral metabolic rate of oxygen consumption CMRO2 with 17O magnetic resonance tomograghy. University of Heidelberg; 2011.
Hopkins AL, Barr RG. Oxygen-17 Compounds as Potential NMR T2 Contrast Agents: Enrichment Effects of H2170 on Protein Solutions and Living Tissues. Magn. Reson. Med. 1987;4:399–403.
Ishii K, Kitagaki H, Kono M, Mori E. Decreased Medial Temporal Oxygen Metabolism in Alzheimer’ s Disease Shown by PET. J. Nucl. Med. 1996;37:1159–1165.
Ito M, Lammertsma AA, Wise RJ, Bernardi S, Frackowiak RS, Heather JD, McKenzie CG, Thomas DG, et al. Measurement of regional cerebral blood flow and oxygen utilisation in patients with cerebral tumours using 15O and positron emission tomography: analytical techniques and preliminary results. Neuroradiology 1982;23:63–74.
Jackson JI, Meyer CH, Nishimura DG, Macovski A. Selection of a convolution function for fourier inversion using gridding. IEEE Trans. Med. Imaging 1991;I0:473–478.
Kurzhunov D, Borowiak R, Wagner P, Reisert M, Bock M. Proton-Constrained CMRO2 Quantification with Direct 17O-MRI at 3 Tesla. In: In proceedings of 23rd annual meeting of ISMRM; Toronto, Ontario, Canada. ; 2015. p. 2450.
Kurzhunov D, Borowiak R, Reisert M, Özen AC, Bock M. Direct estimation of (17) O MR images (DIESIS) for quantification of oxygen metabolism in the human brain with partial volume correction. Magn Reson Med. 2018 Dec;80(6):2717-2725.
Kurzhunov D, Borowiak R, Reisert M, Joachim Krafft A, Caglar Özen A, Bock M. 3D CMRO(2) mapping in human brain with direct (17)O MRI: Comparison of conventional and proton-constrained reconstructions. Neuroimage. 2017 Jul 15;155:612-624.
Kurzhunov D, Borowiak R, Hass H, Wagner P, Krafft AJ, Timmer J, Bock M. Quantification of oxygen metabolic rates in Human brain with dynamic (17) O MRI: Profile likelihood analysis. Magn Reson Med. 2017 Sep;78(3):1157-1167.
Leenders KL, Perani D, Lammertsma AA, Heather JD, Buckingham P, Healy MJ, Gibbs JM, Wise RJ, et al. Cerebral blood flow, blood volume and oxygen utilization. Normal values and effect of age. Brain 1990;113:27–47.
Lehnert W, Gregoire M-C, Reilhac A, Meikle SR. Characterisation of partial volume effect and region-based correction in small animal positron emission tomography (PET) of the rat brain. Neuroimage 2012;60:2144–2157.
Lu M, Zhang Y, Ugurbil K, Chen W, Zhu X-H. In vitro and in vivo studies of 17O NMR sensitivity at 9.4 and 16.4 T. Magn. Reson. Med. 2013;69:1523–1527.
Maurer I, Zierz S, Möller H-J. A selective defect of cytochrome c oxidase is present in brain of Alzheimer disease patients. Neurobiol. Aging 2000;21:455–462.
Maurer I, Zierz S, Möller H-J. Evidence for a mitochondrial oxidative phosphorylation defect in brains from patients with schizophrenia. Schizophr. Res. 2001;48:125–136.
Mellon EA, Beesam RS, Elliott MA, Reddy R. Mapping of cerebral oxidative metabolism with MRI. Proc. Natl. Acad. Sci. USA 2010;107:11787–11792.
Mineura K, Yasuda T, Kowada M, Shishido F, Ogawa T, Uemura K. Positron emission tomographic evaluation of histological malignancy in gliomas using oxygen-15 and fluorine-18-fluorodeoxyglucose. J. Neurol. Res. 1986;8:164–168.
Mintun MA, Raichle ME, Martin WRW, Herscovitch P. Brain Oxygen Utilization Measured with O-15 Radiotracers and Positron Emission Tomography. J. Nucl. Med. 1984;25:177–187.
Nagel AM, Laun FB, Weber M-A, Matthies C, Semmler W, Schad LR. Sodium MRI using a density-adapted 3D radial acquisition technique. Magn. Reson. Med. 2009;62:1565–1573.
Neyman J, Pearson ES. On the Problem of the Most Efficient Tests of Statistical Hypotheses. Philos. Trans. R. Soc. A Math. Phys. Eng. Sci. 1933;231:289–337.
Rahmer J, Börnert P, Groen J, Bos C. Three-dimensional radial ultrashort echo-time imaging with T2 adapted sampling. Magn. Reson. Med. [Internet] 2006;55:1075–1082.
Raue A, Kreutz C, Maiwald T, Bachmann J, Schilling M, Klingmüller U, Timmer J. Structural and practical identifiability analysis of partially observed dynamical models by exploiting the profile likelihood. Bioinformatics 2009;25:1923–1929.
Raue A, Schilling M, Bachmann J, Matteson A, Schelker M, Kaschek D, Hug S, Kreutz C, et al. Lessons learned from quantitative dynamical modeling in systems biology. PLoS One 2013;8:e74335.
Raue A, Steiert B, Schelker M, Kreutz C, Maiwald T, Hass H, Vanlier J, T??nsing C, et al. Data2Dynamics: A modeling environment tailored to parameter estimation in dynamical systems. Bioinformatics [Internet] 2015;31:3558–3560.
Reddy R, Stolpen AH, Leigh JS. Detection of 17O by Proton T1rho Dispersion Imaging. J. Magn. Reson. 1995;108:276–279.
Regatte RR, Akella SVS, Borthakur A, Reddy R. Proton spin-lock ratio imaging for quantitation of glycosaminoglycans in articular cartilage. J. Magn. Reson. Imaging 2003;17:114–121.
Rhodes CG, Wise RJ, Gibbs JM, Frackowiak RS, Hatazawa J, Palmer a J, Thomas DG, Jones T. In vivo disturbance of the oxidative metabolism of glucose in human cerebral gliomas. Ann. Neurol. 1983;14:614–626.
Ronen I, Lee J-H, Merkle H, Ugurbil K, Navon G. Imaging H217O distribution in a phantom and measurement of metabolically produced H217O in live mice by proton NMR. NMR Biomed. 1997;10:333–340.
Ronen I, Merkle H, Ugurbil K, Navon G. Imaging of H217O distribution in the brain of a live rat by using proton-detected 17O MRI. Proc. Natl. Acad. Sci. USA 1998;95:12934–12939.
Takagi H, Shapiro K, Marmarou A, Wisoff H. Microgravimetric analysis of human brain tissue: Correlation with computerized tomography scanning. J Neurosurg 1981;54:797–801.
Ter-Pogossian MM, Eichling JO, Davis DO, Welch MJ. The measure in vivo of regional cerebral oxygen utilization by means of oxyhemoglobin labeled with radioactive oxygen-15. J. Clin. Invest. 1970;49:381–391.
Thulborn KR, Davis D, Adams H, Gindin T, Zhou J. Quantitative tissue sodium concentration mapping of the growth of focal cerebral tumors with sodium magnetic resonance imaging. Magn. Reson. Med. 1999;41:351–359.
Tyler JL, Diksic M, Villemure JG, Evans AC, Meyer E, Yamamoto YL, Feindel W. Metabolic and hemodynamic evaluation of gliomas using positron emission tomography. J. Nucl. Med. 1987;28:1123–1133.
Venzon DZ, Moolgavkar SH. A method for computing profile-likelihood-based confidence intervals. Appl. Stat. 1988;37:87–94.
Wallace DC. Mitochondrial Diseases in Man and Mouse. Science. 1999;283:1482–1488. Wallace DC. Mitochondrial genetics: a paradigm for aging and degenerative diseases? Science. 1992;256:628–632.
Whittall KP, MacKay AL, Graeb DA, Nugent RA, Li DK, Paty DW. In vivo measurement of T2 distributions and water contents in normal human brain. Magn. Reson. Med. 1997;37:34–43.
Wilks SS. The Large-Sample Distribution of the Likelihood Ratio for Testing Composite Hypotheses. Ann. Math. Stat. 1938;9:60–62.
Wong-Riley M, Antuono P, Ho KC, Egan R, Hevner R, Liebl W, Huang Z, Rachel R, et al. Cytochrome oxidase in Alzheimer’s disease: biochemical, histochemical, and immunohistochemical analyses of the visual and other systems. Vision Res. 1997;37:3593–3608.
Zhang N, Zhu X-H, Lei H, Ugurbil K, Chen W. Simplified methods for calculating cerebral metabolic rate of oxygen based on 17O magnetic resonance spectroscopic imaging measurement during a short 17O2 inhalation. J. Cereb. blood flow Metab. 2004;24:840–848.
Zhu X-H, Chen JM, Tu T-W, Chen W, Song S-K. Simultaneous and noninvasive imaging of cerebral oxygen metabolic rate, blood flow and oxygen extraction fraction in stroke mice. Neuroimage 2013;64:437–447.
Zhu X-H, Chen W. In vivo oxygen-17 NMR for imaging brain oxygen metabolism at high field. Prog. Nucl. Magn. Reson. Spectrosc. 2011;59:319–335.
Zhu X-H, Merkle H, Kwag JH, Ugurbil K, Chen W. 17O relaxation time and NMR sensitivity of cerebral water and their field dependence. Magn. Reson. Med. 2001;45:543–9.
Zhu X-H, Zhang Y, Tian R-X, Lei H, Zhang N, Zhang X, Merkle H, Ugurbil K, et al. Development of 17O NMR approach for fast imaging of cerebral metabolic rate of oxygen in rat brain at high field. Proc. Natl. Acad. Sci. USA 2002;99:13194–13199.
Figures