Beyond the Phenemenological Single Compartment Model
1Bill & Melinda Gates Foundation, United States
Synopsis
While the majority of routine clinical and diagnostic imaging comprises qualitative T1, T2 and/or proton density (PD)-weighted imaging, additional information related to tissue microstructure can be gleaned through quantitative voxel-wise evaluation of the T1 and T2 relaxation times. In this educational talk we will examine the various single and multi-component approaches to modelling relaxation data and the biological insight they provide.
HIGHLIGHTS
• Will provide a comprehensive overview of current approaches to multicomponent relaxometry analysis;
• Strengths and limitations of proposed methods and associated tissue models will be examined;
• Potential clinical utility and interpretability will be discussed.
TARGET AUDIENCE
The target audience of this presentation includes MR physicists as well as clinical researchers interested in the use of relaxometry data to interrogate tissue microstructure and composition.OUTCOME/OBJECTIVES
By the conclusion of this presentation, viewers will have an improved understanding of the mathematical tissue models that are commonly applied to relaxation data, including their strengths and limitationsPURPOSE
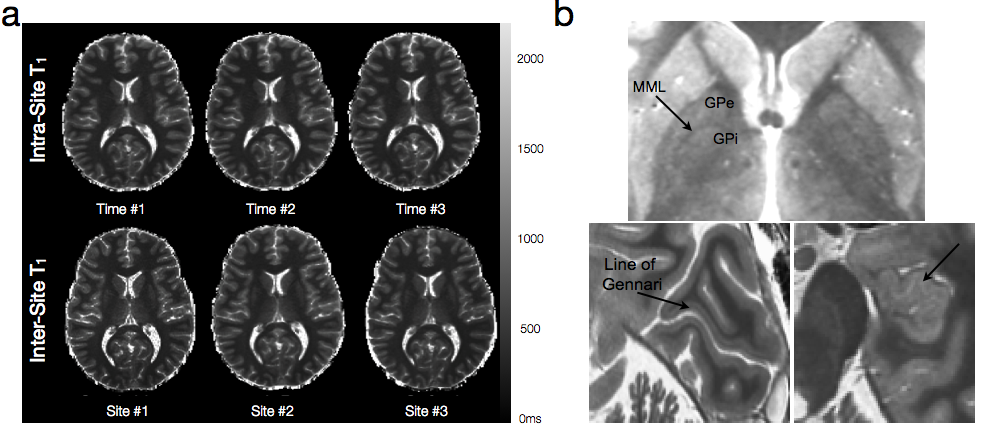
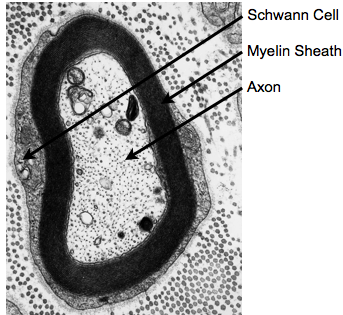
While the majority of routine clinical and diagnostic imaging comprises qualitative T1, T2 and/or proton density (PD)-weighted imaging, additional information related to tissue microstructure can be gleaned through quantitative voxel-wise evaluation of the T1and T2 relaxation times. Such imaging, commonly referred to as quantitative relaxometry, can minimize or eliminate hardware, acquisition, and patient-specific confounds that exist within conventional qualitative images, such as coil sensitivity differences, or differences in acquisition pulse sequences and imaging parameters. As such, quantitative imaging can afford improved reproducibility (both between different imaging centers, as well as with longitudinal measures on the same patient) and, in some cases, improved image contrast (Fig. 1). Conventionally, calculation of T1 and/or T2 within each imaging voxel is performed by fitting a known signal intensity model to appropriately acquired data. For example, T1may be obtained from a series of inversion recovery (IR) data, acquired with 3 or more incremented inversion times (TI), by fitting the governing IR signal expression, for PD, T1, and β (included to account for imperfect 180° inversion pulses). Similarly, T2 may be calculated by fitting the Spin Echo signal equation, to a series of spin echo (SE) data acquired with at two or more echo times (TE). While both these approaches (and many others) provide precise and reproducible T1 and T2 values, they impose an inherent tissue model onto the data. That being, all water protons within the voxel have the same relaxation properties (i.e, they are all governed by the same T1 and/or T2 relaxation time). Since T1 and T2 are exquisitely sensitive to their biophysical and biochemical environment (Bottomley et al., 1984), this model, therefore, assumes each voxel contains a single homogeneous water pool (i.e., single component relaxation). Unfortunately, observation of tissue structure on the microscopic scale reveals a more complex picture, with water compartmentalized into multiple distinct environments, with differing physical and biochemical structures, and passive and active transportation processes that shuttle water between them (Fenrich et al., 2001) (Fig. 2). While the complexity of tissue microstructure raises concerns about the validity of single component relaxometry, the sensitive of relaxation to their environment offers the potential to glean additional microstructural information through the use of more complex relaxation (e.g., multicomponent) models.
METHODS
Multicomponent T2 Relaxation
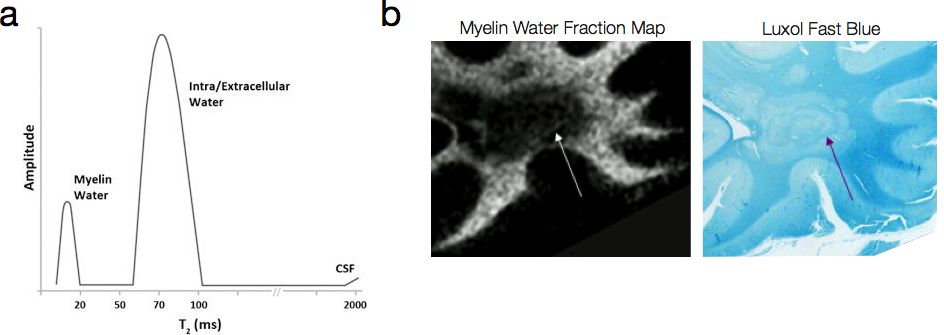
Proposed in the late 1980’s and further refined through the 1990’s, the first approach to tissue microstructure through relaxometry was through multicomponent analysis of T2relaxation (Fischer et al., 1990; MacKay et al., 1994). Expanding the Spin Echo model to include multiple T2 relaxation species (each corresponding to a different water compartment) yields the general multicomponent variant of the Spin Echo equation. This model makes no assumption regarding the number of differing T2 species within the voxel, it does present a formidable analysis problem in that unconstrained it presents an underdetermined system. To avoid this problem, a T2 distribution consisting of M logarithmically-spaced T2 values are fit to the M echo time SE data using non-negative least squares and imposing a smoothing function to ensure a continuous distribution (Whittall et al., 1997; Hwang and Du, 2009) (Fig. 3a). Peaks within the T2 distribution are believed to correspond to unique physical environments (MacKay et al., 2006). In brain, for example, the short T2 peak (T2< 50ms) corresponds to water trapped within the lipid bilayers of the myelin sheath; the intermediate peak (80ms < T2 < 200ms) to intra/extra-cellular water; and the longer peak (T2 > 250ms) to unrestricted free water. These assignments have been collaborated through histological comparison studies (Fig. 3b), as well as examination of their changes in known demyelinating diseases (such as multiple sclerosis, MS) (Laule et al., 2008). The ratio of the area under the short T2 peak to the area under the full distribution has been termed the myelin water fraction (MWF), which has seen increased research activity of late due to its ability to provide improved sensitivity and specificity to myelin changes in MS and other degenerative disorders (Mackay et al., 2009). In addition to neuroimaging applications, multicomponent T2 analysis has also been performed, and found utility, in musculoskeletal applications, including changes in muscle composition following training and creatine supplementation (Saab et al., 2002); and in the analysis of cartilage degradation (Reiter et al., 2009).
Multicomponent T1 Relaxation
Initial attempts to replicate results from T2 analysis in the context of T1 were, unfortunately, unsuccessful. This failure is believed to be due to the relative difference in the timescales between T1, T2, and the rate of water exchange between the various water compartments (Li et al., 2012). Simplified multi-component Spin Echo signal models make no mention of water exchange between, for example, the myelin-associated water and the intra/extra-cellular water pools, assuming instead that T2 is short relative to the exchange time, τ, such that each component can be considered in isolation. In contrast, T1 is long with respect to τ, such that the components appear as one “well-mixed” container. Thus, while T2 may be analyzed using multicomponent analysis, T1 appears to be mono-exponential. However, in combined T1and T2analysis of peripheral nerve, Does et al., have shown unique T1 times associated with each T2 component (Does et al., 1998). Though difficult to observe and quantify directly, this underlying multicomponent T1 has led to the development of novel imaging methods designed to selectively isolate the T1-weighted signal associated with the myelin water (Travis and Does, 2005).
Combined Multicomponent T1and T2 Relaxation
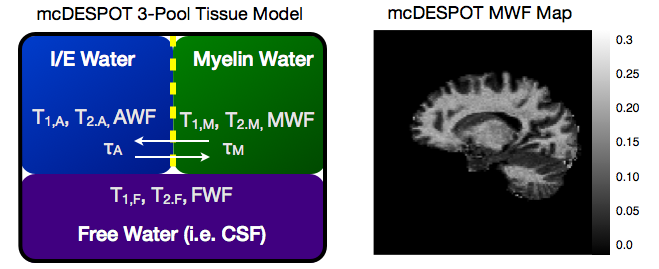
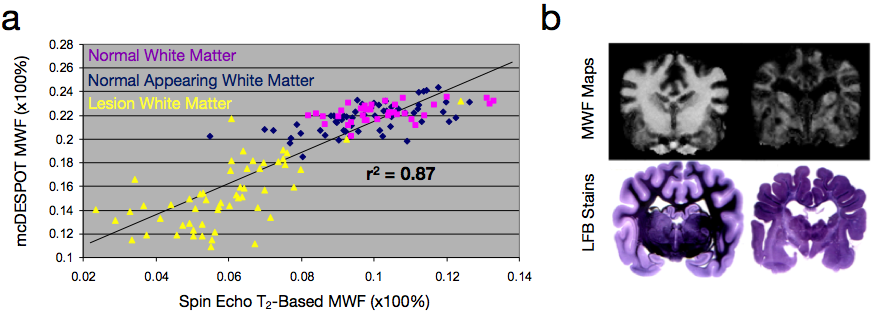
While the conventional approaches to visualizing and quantifying multicomponent relaxation rely on spin echo or inversion recovery methods, any imaging sequence is sensitive and susceptible to these effects. Recently, a more rapid approach for quantifying multicomponent relaxation, termed mcDESPOT, has been proposed that utilizes rapid and time efficient steady-state imaging methods (Deoni et al., 2008). This approach differs from spin echo based measures in that water exchange and cross-relaxation effects are implicitly included within the signal model. This inclusion, however, requires knowledge of the tissue system (i.e., what water pools are in each with each other), which forces an upper limit on the number of tissue pools that can be modelled (3) (Fig. 4) (Deoni et al., 2013). While offering a potentially rapid approach to myelin water imaging (as well as potential application to cartilage imaging (Liu et al., 2014)), mcDESPOT remains to be fully understood. MWF values derived using mcDESPOT are universally higher than those obtained using spin-echo methods, though they are correlated with each other (Fig. 5a), and have been qualitatively validated against histology (Fig. 5b). Further, the effect of magnetization transfer remains to be fully addressed (Zhang et al., 2014).
RESULTS
MRI relaxation data offers a potential wealth of information with increased specificity and sensitivity to tissue microstructure and composition. While numerous acquisition methods have been presented, and several mathematical tissue models and analysis approaches described, there remains significant limitations and voids in our knowledge regarding the ideal approach or the interpretation of derived results. Nevertheless, with more recent methodologies offering the potential for multicomponent relaxometry within clinically realistic scan times, the field is experiencing renewed interest and rapid growth. Once relegated to research studies of known myelin disorders, multicomponent relaxometry and MWF imaging is now being applied to studies of neurodevelopment (Deoni et al., 2011; 2012), aging (Lamar et al., 2014), and other neurological disorders (Spader et al., 2013). Throughout this talk, we will discuss the various models and acquisition approaches commonly employed for multicomponent relaxometry, and detail the strengths and limitations of each model.Acknowledgements
No acknowledgement found.References
Bottomley PA, Foster TH, Argersinger RE, Pfeifer LM. A review of normal tissue hydrogen NMR relaxation times and relaxation mechanisms from 1-100 MHz: dependence on tissue type, NMR frequency, temperature, species, excision, and age. Med Phys. 1984 Jul;11(4):425–48. PMCID: 6482839
Deoni SCL, Dean DC, O'Muircheartaigh J, Dirks H, Jerskey BA. Investigating white matter development in infancy and early childhood using myelin water faction and relaxation time mapping. Neuroimage. 2012 Nov 15;63(3):1038–53. PMCID: 3711836
Deoni SCL, Matthews L, Kolind SH. One component? Two components? Three? The effect of including a nonexchanging “free” water component in multicomponent driven equilibrium single pulse observation of T1 and T2. Magn Reson Med. 2013 Jul;70(1):147–54. PMCID: 3711852
Deoni SCL, Mercure E, Blasi A, Gasston D, Thomson A, Johnson M, et al. Mapping infant brain myelination with magnetic resonance imaging. J. Neurosci. Society for Neuroscience; 2011 Jan 12;31(2):784–91. PMCID: 21228187
Deoni SCL, Rutt BK, Arun T, Pierpaoli C, Jones DK. Gleaning multicomponent T1 and T2 information from steady-state imaging data. Magn Reson Med. 2008 Dec;60(6):1372–87. PMCID: 19025904
Does MD, Beaulieu C, Allen PS, Snyder RE. Multi-component T1 relaxation and magnetisation transfer in peripheral nerve. Magn Reson Imaging. 1998 Nov;16(9):1033–41.
Fenrich FRE, Beaulieu C, Allen PS. Relaxation times and microstructures. NMR Biomed. John Wiley & Sons, Ltd; 2001 Apr 1;14(2):133–9.
Fischer HW, Rinck PA, Van Haverbeke Y, Muller RN. Nuclear relaxation of human brain gray and white matter: analysis of field dependence and implications for MRI. Magn Reson Med. 1990 Nov;16(2):317–34.
Hwang D, Du YP. Improved myelin water quantification using spatially regularized non-negative least squares algorithm. J Magn Reson Imaging. Wiley Subscription Services, Inc., A Wiley Company; 2009 Jul;30(1):203–8.
Lamar M, Zhou XJ, Charlton RA, Dean D, Little D, Deoni SC. In vivo quantification of white matter microstructure for use in aging: a focus on two emerging techniques. Am J Geriatr Psychiatry. 2014 Feb;22(2):111–21. PMCID: PMC3947219
Laule C, Kozlowski P, Leung E, Li DKB, MacKay AL, Moore GRW. Myelin water imaging of multiple sclerosis at 7 T: correlations with histopathology. Neuroimage. 2008 May 1;40(4):1575–80. PMCID: 18321730
Li X, Priest RA, Woodward WJ, Siddiqui F, Beer TM, Garzotto MG, et al. Cell membrane water exchange effects in prostate DCE-MRI. J. Magn. Reson. 2012 May;218:77–85. PMCID: PMC3532863
Liu F, Chaudhary R, Hurley SA, Munoz Del Rio A, Alexander AL, Samsonov A, et al. Rapid multicomponent T2 analysis of the articular cartilage of the human knee joint at 3.0T. Journal of Magnetic Resonance Imaging. 2014 May;39(5):1191–7.
MacKay A, Laule C, Vavasour I, Bjarnason T, Kolind S, Mädler B. Insights into brain microstructure from the T2 distribution. Magn Reson Imaging. 2006 May;24(4):515–25.
MacKay A, Whittall K, Adler J, Li D, Paty D, Graeb D. In vivo visualization of myelin water in brain by magnetic resonance. Magn Reson Med. 1994 Jun;31(6):673–7. PMCID: 8057820
Mackay AL, Vavasour IM, Rauscher A, Kolind SH, Mädler B, Moore GRW, et al. MR relaxation in multiple sclerosis. Neuroimaging Clin. N. Am. 2009 Feb;19(1):1–26. PMCID: 19064196
Reiter DA, Lin P-C, Fishbein KW, Spencer RG. Multicomponent T2 relaxation analysis in cartilage. Magn Reson Med. Wiley Subscription Services, Inc., A Wiley Company; 2009 Apr;61(4):803–9. PMCID: PMC2711212
Saab G, Marsh GD, Casselman MA, Thompson RT. Changes in human muscle transverse relaxation following short-term creatine supplementation. Exp. Physiol. 2002 May;87(3):383–9.
Spader HS, Ellermeier A, O'Muircheartaigh J, Dean DC, Dirks H, Boxerman JL, et al. Advances in myelin imaging with potential clinical application to pediatric imaging. Neurosurg Focus. 2013 Apr;34(4):E9. PMCID: PMC3777219
Travis AR, Does MD. Selective excitation of myelin water using inversion-recovery-based preparations. Magn Reson Med. 2005 Sep;54(3):743–7.
Whittall KP, Mackay AL, Graeb DA, Nugent RA, Li DK, Paty DW. In vivo measurement of T2 distributions and water contents in normal human brain. Magn Reson Med. 1997 Jan;37(1):34–43.
Zhang J, Kolind SH, Laule C, MacKay AL. How does magnetization transfer influence mcDESPOT results? Magn Reson Med. 2014
Figures