5066
MRI Susceptibility Mapping Suggests Elevated Brain Iron in Sickle Cell Anaemia1Department of Medical Physics and Biomedical Engineering, University College London, London, United Kingdom, 2Developmental Neurosciences, UCL Great Ormond Street Hospital Institute of Child Health, London, United Kingdom
Synopsis
Sickle Cell Anaemia (SCA) is a genetic condition characterized by haemolytic anaemia, cerebral vasculopathy and cognitive impairment. The effect of SCA on brain iron concentrations has not been extensively studied. Brain iron is important in cognitive function and iron overload may accelerate neurodegeneration. Here, susceptibility mapping (QSM) was used to compare brain tissue susceptibility values in 86 SCA patients and 25 healthy controls. Elevated susceptibility was found in the red nucleus of the SCA group versus controls, suggesting increased iron accumulation. In SCA subjects there was no significant effect of silent cerebral infarcts or anaemia severity on brain susceptibility values.
Introduction
Sickle Cell Anaemia (SCA) is a genetic condition which affects the development of red blood cells (RBCs). The modified RBCs break down prematurely causing haemolytic anaemia. Cerebral vasculopathy is prevalent, exposing SCA subjects to a high risk of silent cerebral infarcts (SCI) and ischaemic stroke. SCA subjects, including those exhibiting no obvious neurological damage, suffer from cognitive deficits that increase with age1.
The accumulation of excess brain iron may contribute to these cognitive deficits observed in SCA. Brain iron is important in cognitive function2, and iron accumulation accelerates neurodegeneration in conditions such as Parkinson’s3. Cerebral vasculopathy is known to trigger iron accumulation4 and the effect of haemolytic anaemia on brain iron is not well characterized5.
Here, we used Susceptibility Mapping (QSM) to compare regional brain iron concentrations between SCA and healthy control (HC) groups. Magnetic susceptibility (χ) values were measured in iron-rich grey matter regions of interest (ROI), where χ is directly proportional to iron stored in the form of ferritin macromolecules6,7. Within the SCA group, the effects of anaemia severity and vasculopathy on χ values were investigated by comparing regional χ with blood haematocrit (Hct) and SCI presence respectively.
Methods
86 SCA subjects (mean ± standard deviation age: 19.03±10.84 years) and 25 HCs (16.19±5.02 years) were recruited from the Sleep and Asthma Cohort(SAC), and Prevention of Morbidity in Sickle Cell Disease(POMS) clinical studies8,9, whose exclusion criteria included chronic blood transfusions.
MRI data were acquired on a 3T Siemens Magnetom Prisma. Susceptibility maps were calculated from multi-echo gradient-recalled-echo (GRE) images. Sequence parameters included: 7 echoes, TE1/ΔTE/TR:3ms/4ms/38ms, 1.15mm isotropic resolution, FOV:180x220x166mm3. A trained radiologist identified SCIs on fluid-attenuated inversion recovery images. Hct was measured in blood sampled during the clinical studies.
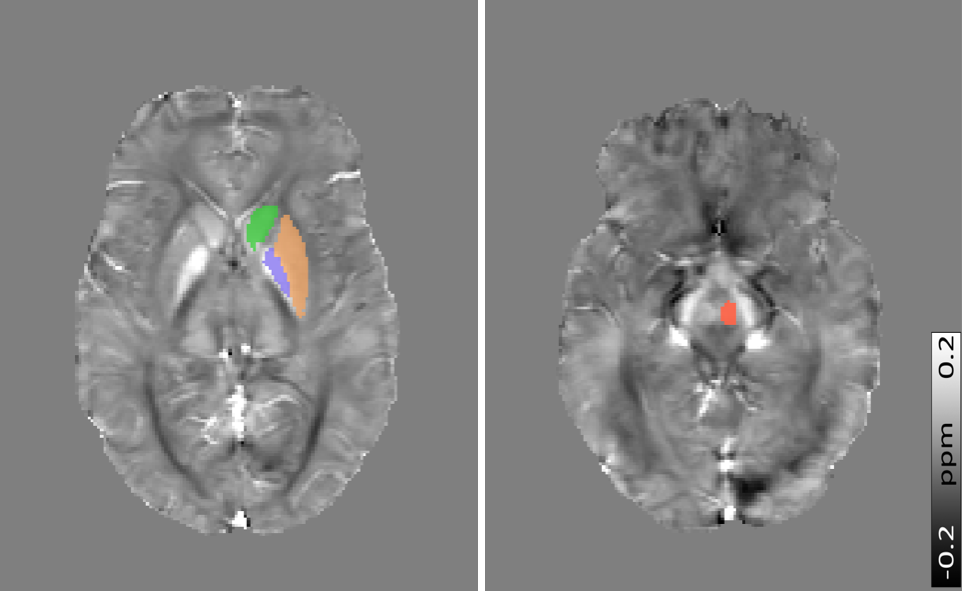
QSM Pipeline: B0 field maps were obtained from a nonlinear fit of the complex GRE images10 and underwent Laplacian-based unwrapping11. Background field removal was performed using Projection onto Dipole Fields12. Brain masks were calculated using the FSL Brain Extraction Tool13. Field-to-χ inversion was performed using Tikhonov regularization14 with regularization parameter α=0.06, selected using L-Curve methods. Susceptibility values were examined in four iron-rich ROI: Red Nucleus (RN), Caudate Nucleus (CN), Putamen (PT) and Globus Pallidus (GP) (Figure 1). ROI were segmented by co-registration of the Eve QSM atlas15 to the sixth-echo GRE magnitude image using NiftyReg16.
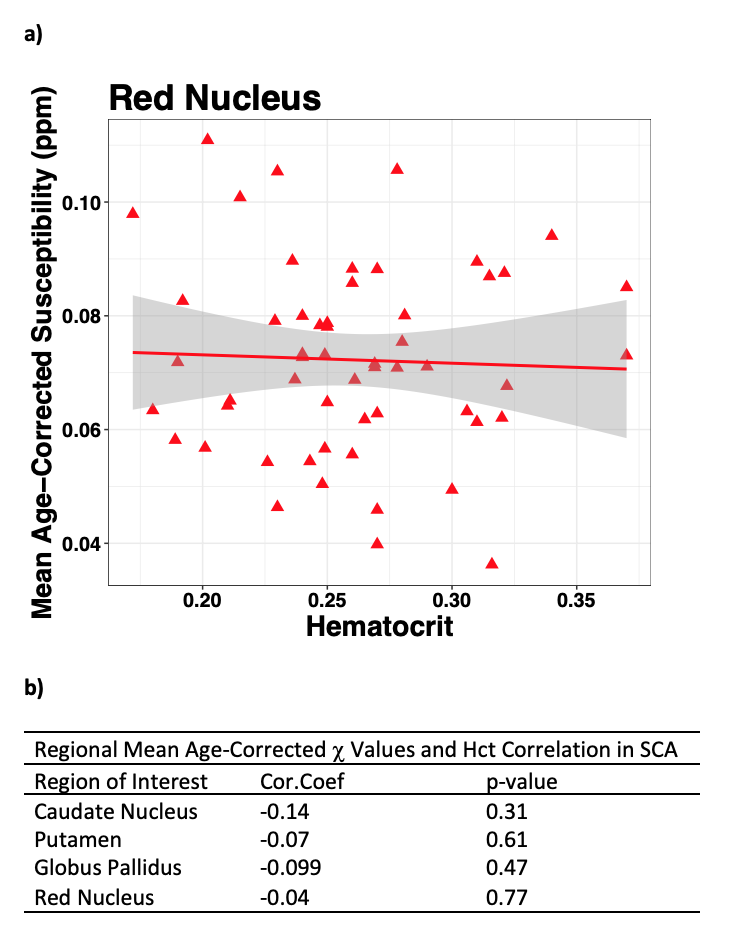
Regression of regional mean χ values on log-transformed age was performed on pooled SCA and HC subjects to remove any effect of iron accumulation with age17. ANCOVA was applied to examine differences in regional age-corrected χ between SCA and HCs, and between SCA subjects with (SCI+) and without SCI (SCI-). In SCA subjects, correlations between the age-corrected ROI mean χ values and Hct levels were calculated to assess the effect of anaemia severity on χ.
Results
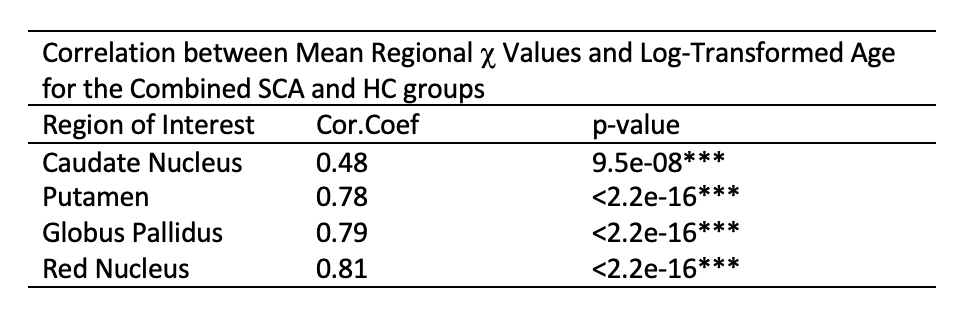
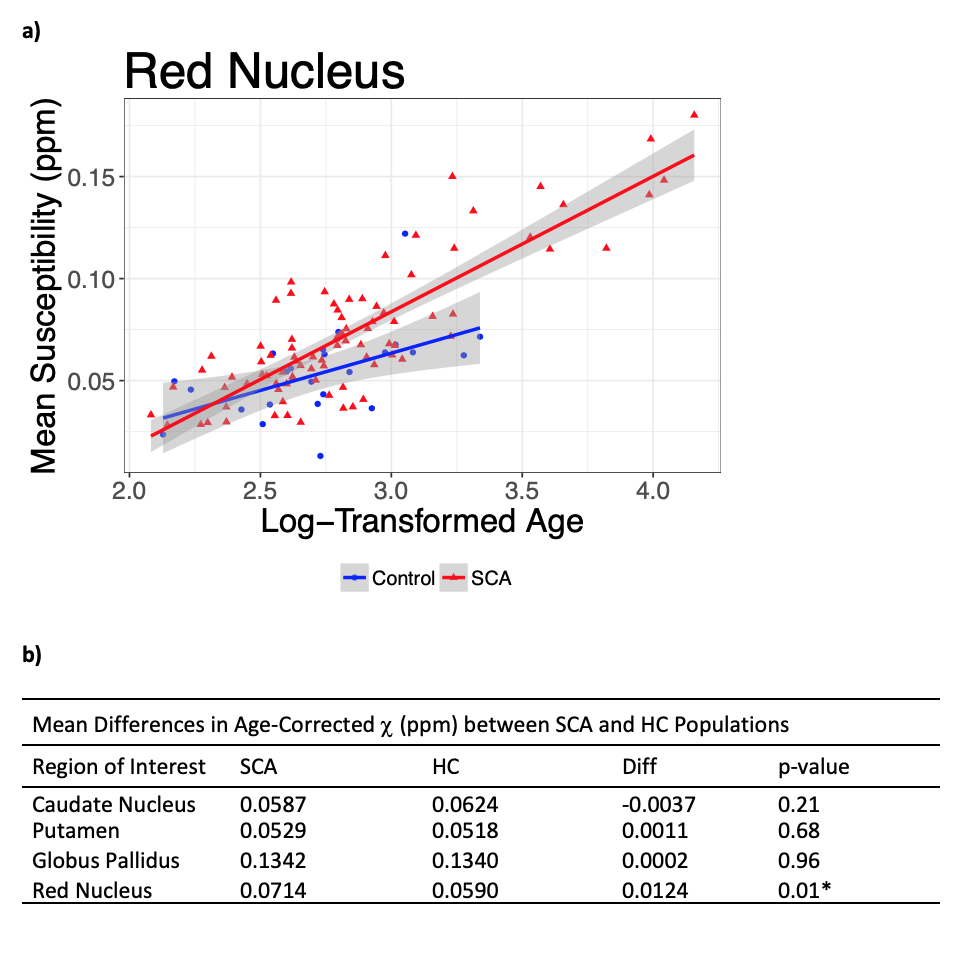
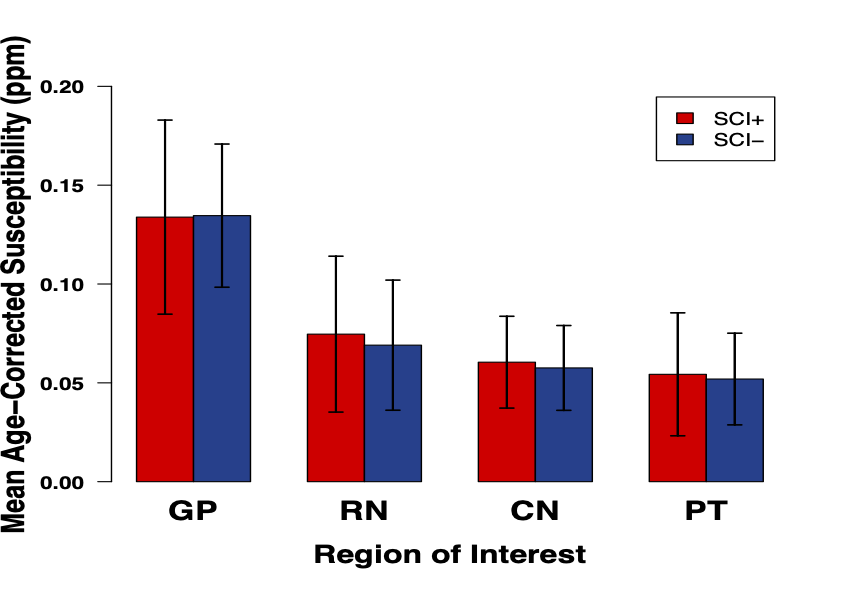
A significant increase in χ with age was observed in all ROI (Figure 2). ANCOVA showed a faster χ increase with age in the RN in SCA than in HCs (Figure 3a). The mean age-corrected χ in the RN was significantly greater in the SCA group than in the HCs, but there were no significant group differences in any of the other ROI (Figure 3b). There were no significant χ differences between the SCI+ and SCI- groups in any ROI (Figure 4). There was no correlation between the mean χ values and Hct levels in any of the ROIs (Figure 5).Discussion and Conclusions
The greater mean age-corrected susceptibility and faster susceptibility increase with age suggests increased iron accumulation in the red nucleus of subjects with sickle cell anaemia compared to healthy controls. The underlying mechanism remains unclear as the increased χ was not correlated with Hct (a putative measure of anaemia severity) or SCI presence (a putative measure of vasculopathy) in the SCA group. A more direct measure of vasculopathy than SCI (e.g. transcranial Doppler or MR angiography) together with measures of tissue compromise (e.g. diffusion tensor imaging) and hypoxic exposure (e.g. oxygen saturation) could be acquired in future to investigate any relationship with iron accumulation. Furthermore, it would be interesting to use QSM to examine iron accumulation outside these basal ganglia ROIs, closer to cortical areas affected by SCI. The increased iron accumulation observed in SCA may affect cognitive function. We are currently awaiting cognitive results from the clinical studies, and future work will include comparing χ values and cognitive performance.Acknowledgements
This study was supported by the EPSRC-funded UCL Centre for Doctoral Training in Medical Imaging (EP/L016478/1) and the Department of Health’s NIHR-funded Biomedical Research Centre at Great Ormond Street Hospitals.References
1. Steen RG, Fineberg-Buchner C, Hankins G, Weiss L, Prifitera A, Mulhern RK. Cognitive deficits in children with sickle cell disease. J Child Neurol. 2005;20(2):102–7.
2. Carpenter KLH, Li W, Wei H, Wu B, Xiao X, Liu C, et al. Magnetic susceptibility of brain iron is associated with childhood spatial IQ. Neuroimage. 2016;132:167–74.
3. Eskreis-Winkler S, Zhang Y, Zhang J, Liu Z, Dimov A, Gupta A, et al. The clinical utility of QSM: disease diagnosis, medical management, and surgical planning. NMR Biomed. 2017;30(4).
4. Palmer C, Menzies SL, Roberts RL, Pavlick G, Connor JR. Changes in iron histochemistry after hypoxic-ischemic brain injury in the neonatal rat. J Neurosci Res. 1999;56(1):60–71.
5. Miao, Xin, Choi, Souyong, Tamrazi, Benita, Chai, Yaqiong, Vu, Chau, Coates, Thomas D WJC. Increased brain iron deposition in patients with sickle cell disease: an MRI quantitative susceptibility mapping study. Blood. 2018;1–10.
6. Langkammer C, Schweser F, Krebs N, Deistung A, Goessler W, Scheurer E, et al. Quantitative susceptibility mapping (QSM) as a means to measure brain iron? A post mortem validation study. Neuroimage [Internet]. 2012;62(3):1593–9. Available from: http://dx.doi.org/10.1016/j.neuroimage.2012.05.049
7. Shmueli K, de Zwart JA, van Gelderen P, Li T-Q, Dodd SJ, Duyn JH. Magnetic susceptibility mapping of brain tissue in vivo using MRI phase data. Magn Reson Med. 2009;62(6):1510–22.
8. Howard J, Inusa B, Liossi C, Jacob E, Murphy PB, Hart N, et al. Prevention of Morbidity in sickle cell disease - qualitative outcomes, pain and quality of life in a randomised cross-over pilot trial of overnight supplementary oxygen and auto-adjusting continuous positive airways pressure (POMS2a): Study protocol for a. Trials [Internet]. 2015;16(1). Available from: http://dx.doi.org/10.1186/s13063-015-0883-y
9. Vanderbilt University School of Medicine Department of Pediatrics. The Sleep and Asthma Cohort (SAC) Study [Internet]. 2011. p. https://pediatrics.mc.vanderbilt.edu/interior.php? Available from: https://pediatrics.mc.vanderbilt.edu/interior.php?
10. Liu T, Wisnieff C, Lou M, Chen W, Spincemaille P, Wang Y. Nonlinear formulation of the magnetic field to source relationship for robust quantitative susceptibility mapping. Magn Reson Med. 2013;69(2):467–76.
11. Schweser F, Deistung A, Sommer K, Reichenbach JR. Toward online reconstruction of quantitative susceptibility maps: Superfast dipole inversion. Magn Reson Med. 2013;69(6):1582–94.
12. Liu T, Khalidov I, de Rochefort L, Spincemaille P, Liu J, Tsiouris AJ, et al. A novel background field removal method for MRI using projection onto dipole fields (PDF). NMR Biomed. 2011;24(9):1129–36.
13. Smith SM. Fast robust automated brain extraction. Hum Brain Mapp. 2002;17(3):143–55.
14. Kressler B, De Rochefort L, Liu T, Spincemaille P, Jiang Q, Wang Y. Nonlinear regularization for per voxel estimation of magnetic susceptibility distributions from MRI field maps. IEEE Trans Med Imaging. 2010;29(2):273–81.
15. Lim IAL, Faria A V., Li X, Hsu JTC, Airan RD, Mori S, et al. Human brain atlas for automated region of interest selection in quantitative susceptibility mapping: Application to determine iron content in deep gray matter structures. Neuroimage. 2013;82:449–69.
16. Modat M, Ridgway GR, Taylor ZA, Lehmann M, Barnes J, Hawkes DJ, et al. Fast free-form deformation using graphics processing units. Comput Methods Programs Biomed. 2010;98(3):278–84.
17. Bilgic B,
Pfefferbaum A, Rohlfing T, Sullivan E V., Adalsteinsson E. MRI estimates of
brain iron concentration in normal aging using quantitative susceptibility
mapping. Neuroimage. 2012;59(3):2625–35.
Figures