5060
Dynamic susceptibility contrast MRI phantom for validation of clinical perfusion imaging11. National institute for standards and technology, Boulder, CO, United States, 2 National institute for standards and technology, Boulder, CO, United States, 3National institute for standards and technology, Boulder, CO, United States, 4Athinoula A Martinos Center for Biomedical Imaging, MGH, Charlestown, MD, United States, 5Dept. of Radiology, Massachusetts General Hospital, Massachusetts, MD, United States, 6Leiden University Medical Center, Leiden, Netherlands, 7Mayo Clinic, Rochester, MN, United States, 8Barrows Neurological Institute, Phoenix, AZ, United States, 9Mayo Clinic, Scottsdale, AZ, United States, 10Wisconsin Institutes for Medical Research, Madison, WI, United States, 11Brigham & Women's Hospital, Boston, MD, United States, 12CEO at Verellium, Inc, Boulder, CO, United States, 13Cleveland Clinic, Cleveland, OH, United States
Synopsis
Dynamic susceptibility contrast MR imaging (DSC MRI) is a very promising quantitative imaging technique used increasingly as both a diagnostic and research tool. This technique quantifies susceptibility-induced (R2*) signal loss to assess tissue perfusion (blood supply) and viability. Development of reference phantoms is crucial to determine the in vitro accuracy, test‐retest repeatability, and inter-platform reproducibility of ∆R2* quantification protocols. Hence, we developed a static DSC phantom suitable for simple and reliable evaluation of acquisition methods to assess susceptibility changes across multiple scanners and time. We also finalized acquisition protocols and developed software to analyze the DSC phantom data.
INTRODUCTION:
Dynamic susceptibility contrast (DSC) MRI provides valuable information about tissue perfusion and is widely used in neuroimaging and stroke assessment1. It is based on tracking a paramagnetic contrast agent injected into the blood stream conventionally using a T2*-weighted echo-planar imaging (EPI) approach. Measured susceptibility-induced signal loss can be postprocessed and quantified to obtain perfusion maps with different hemodynamic parameters, such as blood volume and blood flow. The quantification accuracy of those parameters is affected by methods used for image acquisition and postprocessing. Moreover, the variability of data gained from different studies, across sites or longitudinally, makes it hard to compare the results. We developed a simple DSC phantom that recapitulates in vivo susceptibility changes and allows simple and reliable evaluation of the acquisition methods used to measure such changes. In tandem, we created generic acquisition protocols to assess the contrast-to-noise (CNR) of the susceptibility measurements as well as stability across time across multiple vendors. Finally, we estimated reproducibility and feasibility of performing these measurements.METHODS:
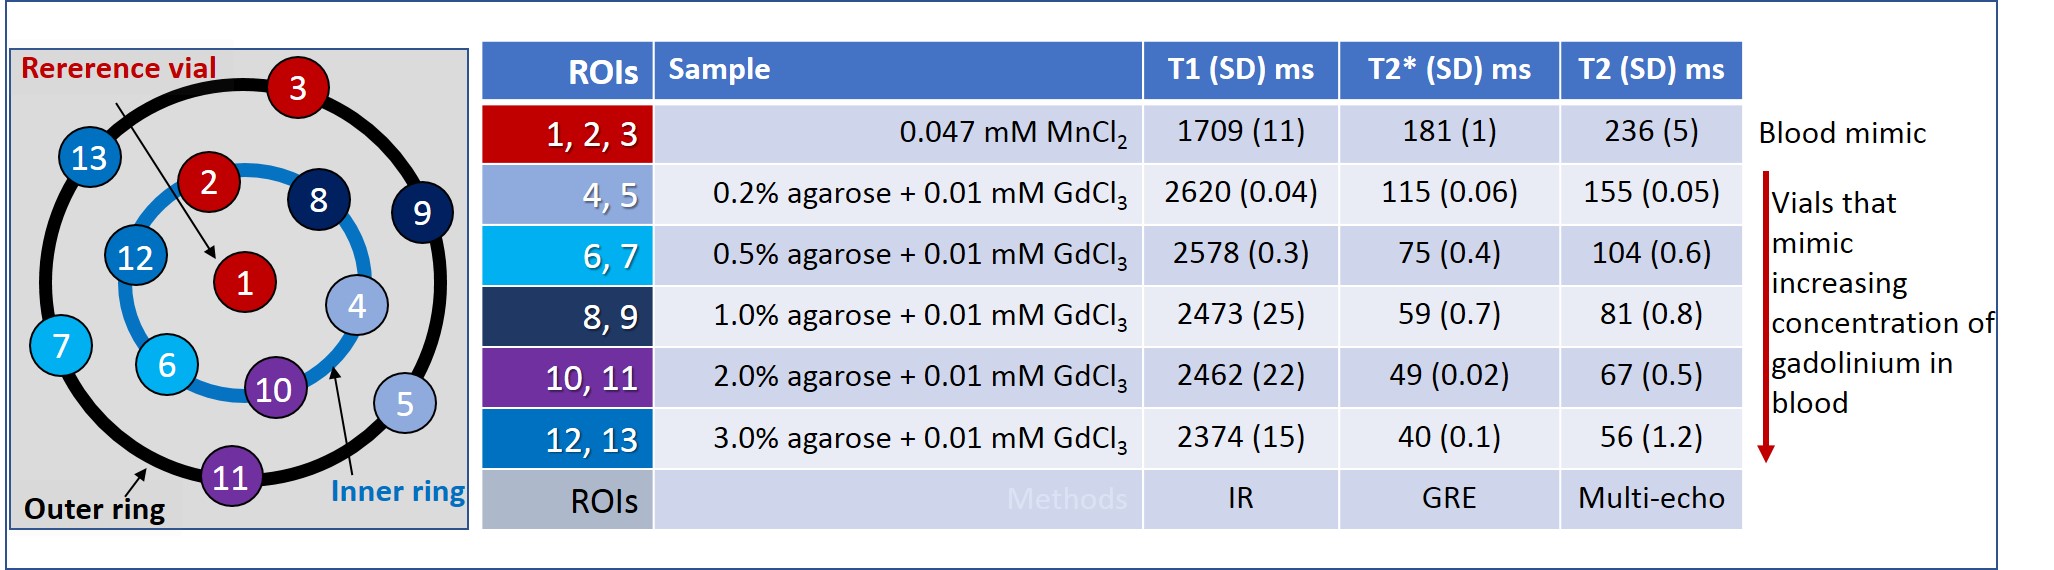
We developed a DSC phantom composed of 13 vials filled with chemically-doped aqueous solutions
mimicking T1, T2 and T2* of blood (reference vials) or blood-doped with
different concentrations of contrast agent corresponding to those observed in vivo2,3 (Figure 1). The center vial contained 0.047 mM manganese chloride (MnCl2)
to mimic magnetic properties of blood positioned into the center of the phantom
shell (HPD). The rest of the vials were arranged in an inner and outer ring.
Both rings contained 6 vials, 5 of which were filled with chelated gadolinium
chloride (GdCl3) and agarose with concentrations ranging from 0.2%-3%
and the 6th was a reference vial containing 0.047 mM MnCl2. The DSC acquisition protocol consisted of a
localizer and 3min 2D axial gradient echo (GRE) acquisition with EPI readout or
multi-echo GRE (MEGRE). The EPI acquisition consisted of 11
slices, 240mm FOV, 128x128 acquisition matrix, 5mm thick, 1mm
slice gap, TR/TE=1500/30ms,
FA=60º, and 120 measurements.
The MEGRE
sequence was performed to validate
the EPI measurements. It consisted of the same FOV and acquisition matrix as the
EPI, with TR=700-750ms, TE ranging from 4-60ms with 8ms spacing and FA=60º, with reconstruction
matrix 256x256 (one scanner required 512x512). Protocols have been created for
Siemens, GE and Philips 3T MRI systems. Because we
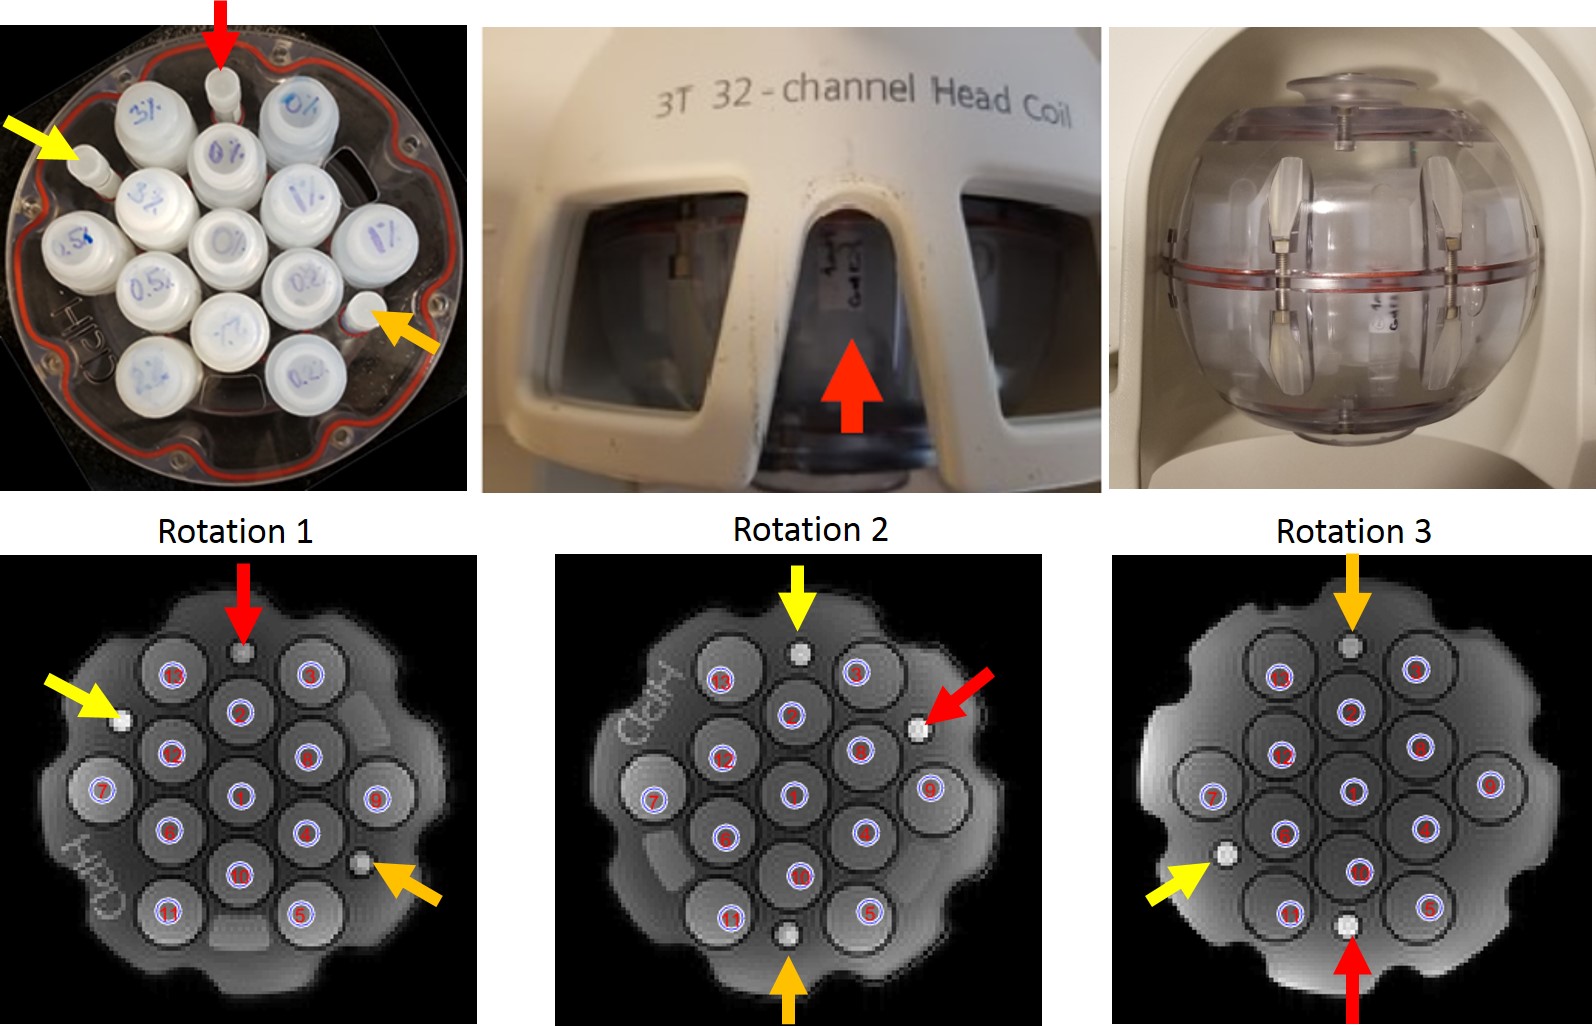
observed inner and outer vial variability, we decided to rotate phantom twice
and calculate ∆R2* to account for spatial inhomogeneity away from isocenter. The
phantom was rotated 3 times to allow for the calculation of ΔR2* from EPI sequence (ΔR2* EPI). ΔR2* EPI was calculated as:
ΔR2* EPI = -1/TE*ln(St /S0),
where S0 was signal magnitude from the reference vial in the inner or outer
rings and St was signal magnitude from the vial of interest for the EPI
acquisitions. For the MEGRE data, we used an exponential fit of 5mm ROIs
in 3 slices to get R2* and subtracted the R2* measured in the
inner/outer rings to generate ΔR2*MEGRE. In addition,
measurements were made using a MEGRE method on the small-bore 3T MRI scanner at NIST.
RESULTS:
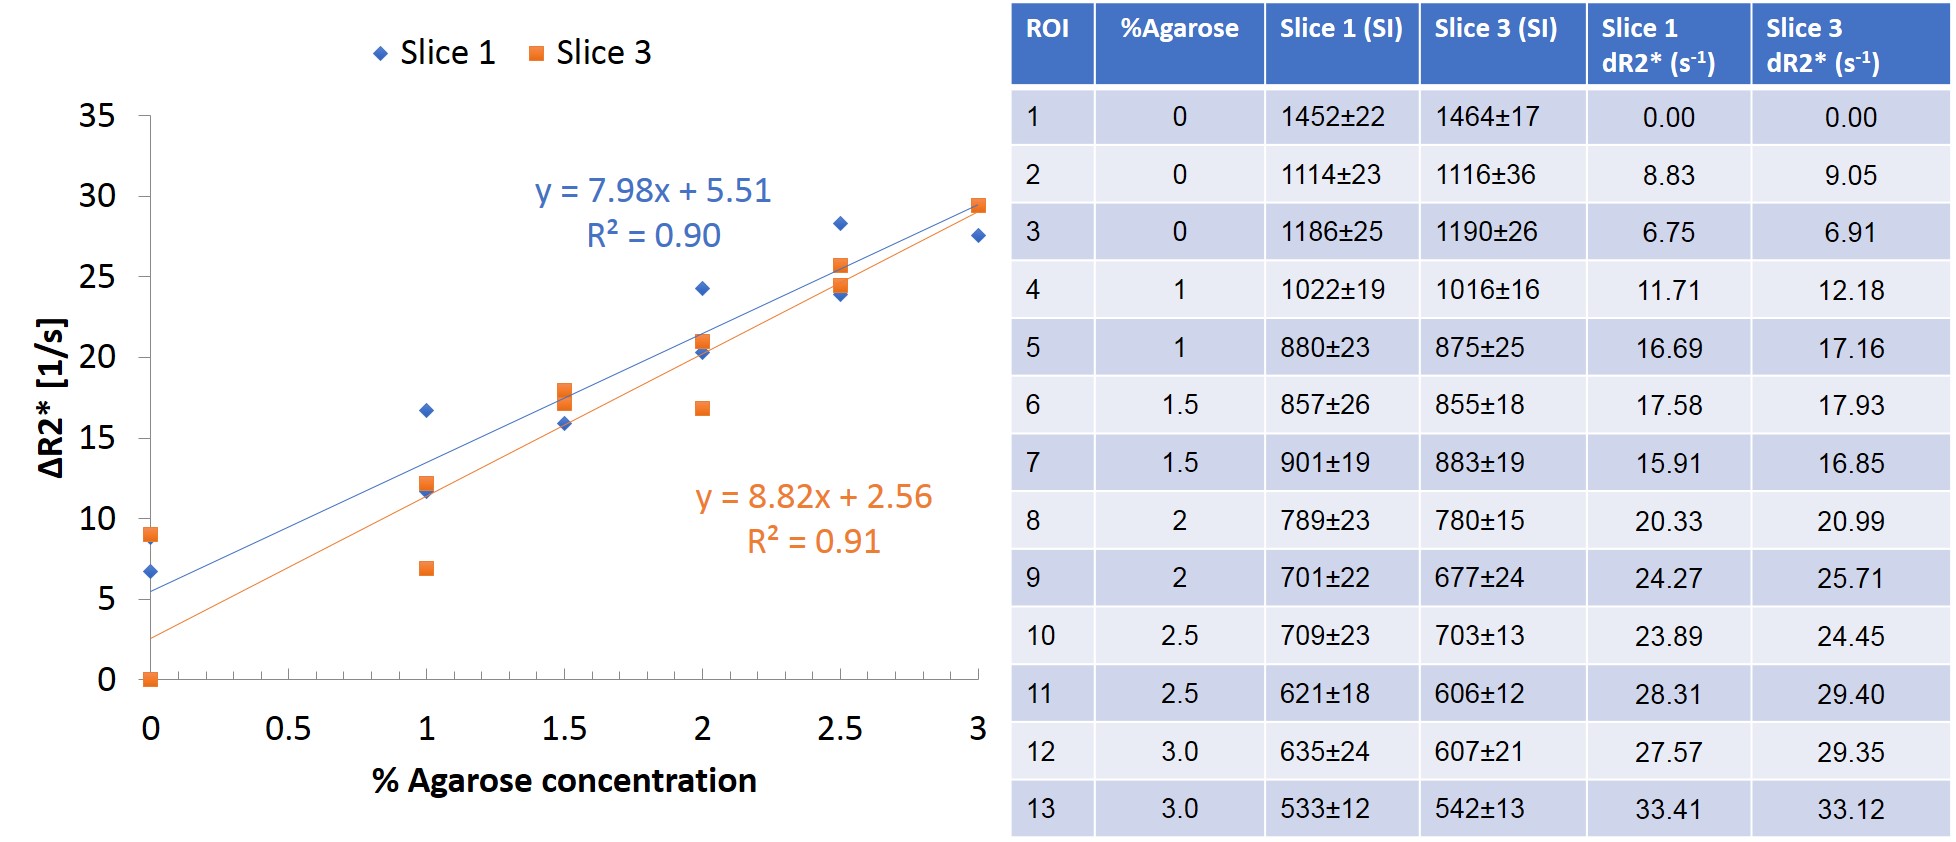
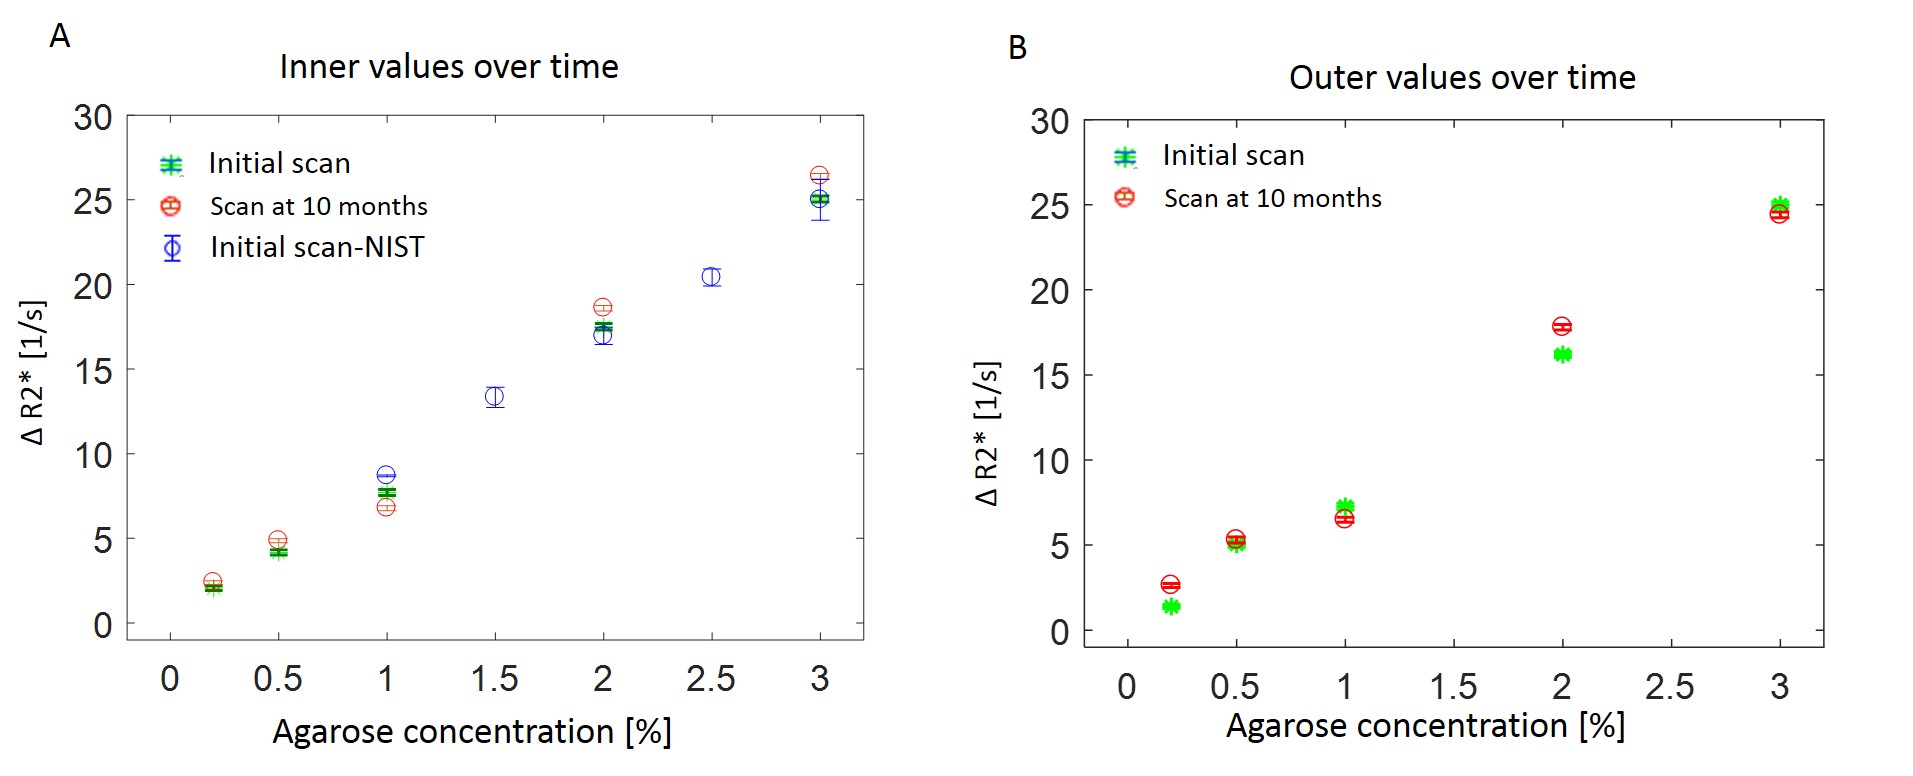
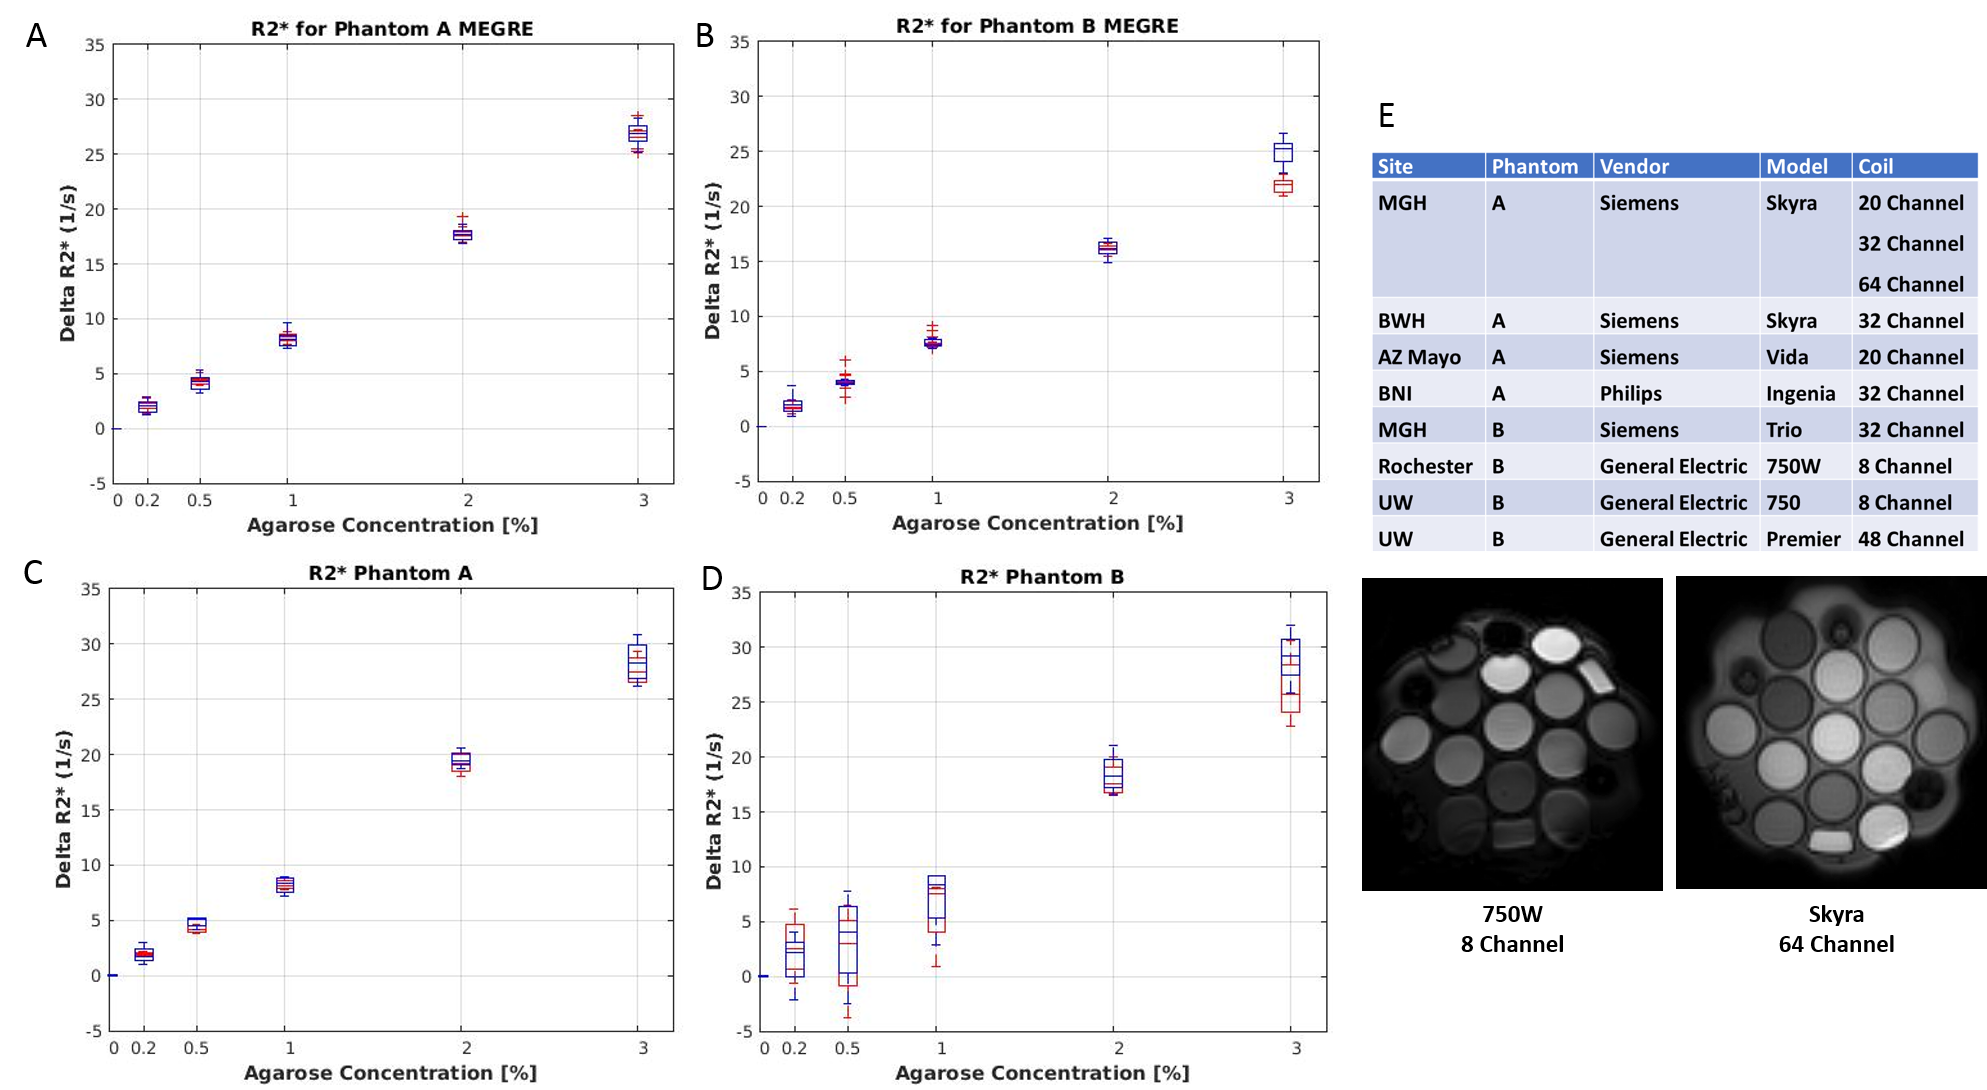
∆R2* values measured in a slice at isocenter were slightly different than the same values measured in a slice 12mm off-isocenter (Figure 3). Rotating the phantom produced ΔR2*EPI results that were similar to ΔR2*MEGRE results obtained at clinical sites and at NIST (Figure 4). Two prototypes of the DSC phantom were sent to several sites to test the reproducibility of these methods. Boxplots of the average ΔR2* as a function of agarose concentration for inner and outer vials measured at different sites over a period of 10 months show the range of values is similar (Figure 5).DISCUSSION:
Initial experiments with the DSC phantom showed that measured ∆R2* varied with distance from isocenter, which may be due to higher likelihood of local field distortion farther from isocenter. Results from both EPI and MEGRE were comparable between NIST and clinical sites, suggesting stable results obtained at different scanners. Some discrepancies between EPI and MEGRE can be due to variations in placement of ROIs and phantom positioning. DSC phantom produced uniform results over period of ten months suggesting its stability over time.CONCLUSIONS:
We evaluated reproducibility of DSC method using ΔR2*MEGRE and ΔR2*EPI in a multicenter study. Overall, there was excellent agreement for both inner and outer vials for all scanners. The observed variability in the phantom B scanners, EPI results, was most likely caused by susceptibility artifacts due to loss of phantom components. Currently, we are developing an NMR measurement method that could reveal bias, if any, in the MRI measurements.Acknowledgements
The authors thank RNSA-QIBA for support of the project. We would like to thank Dariya Malyarenko and Tom Chenevert at University of Michigan for providing us ROI selection interface code from their DWI analyses software.References
1.Thomsen H, Steffensen E, Larsson EM. Perfusion MRI (dynamic susceptibility contrast imaging) with different measurement approaches for the evaluation of blood flow and blood volume in human gliomas. Acta Radiol. 2012;53(1):95-101.
2. Lind E, Knutsson L, Kämpe R, et al. Assessment of MRI contrast agent concentration by quantitative susceptibility mapping (QSM): application to estimation of cerebral blood volume during steady state. MAGMA. 2017;30(6):555-566.
3.Wharton S J, Petridou N, Lotfipour AE, et al. Measuring the Concentration of Contrast Agent in Blood for DSC MRI from the Extra-Vascular Phase Shift. Proc. Intl. Soc. Mag. Reson. Med. 2009; 17: 750.
Figures