4991
Multidimensional T1 Relaxation -T2 Relaxation Correlation Spectroscopic Imaging with a Magnetic Resonance Fingerprinting Acquisition1Electrical Engineering, University of Southern California, Los Angeles, CA, United States, 2Athinoula A. Martinos Center for Biomedical Imaging, Charlestown, MA, United States, 3Harvard Medical School, Boston, MA, United States
Synopsis
T1 Relaxation-T2 Relaxation Correlation Spectroscopic Imaging (RR-CSI) is a novel multidimensional imaging approach that estimates a 2D T1-T2 correlation spectrum at every spatial location, and enables spatial mapping of sub-voxel tissue compartments with very good compartmental resolving capabilities. While RR-CSI was previously demonstrated using data acquired with an inversion recovery multi-echo spin-echo sequence, it can also accommodate data acquired with other encoding schemes. In this work, we investigate an inversion recovery FISP MR fingerprinting acquisition scheme for RR-CSI. Results show, both theoretically and empirically using in vivo human data, that fingerprinting is a viable alternative.
Introduction
T1 Relaxation-T2 Relaxation Correlation Spectroscopic Imaging (RR-CSI) is a novel high-dimensional imaging approach that enables high-quality separation of sub-voxel tissue compartments and spatial mapping of tissue microstructure1-2. RR-CSI acquires multidimensional data that nonseparably encodes information about T1 and T2 relaxation, and uses a constrained estimation framework to reconstruct a high-dimensional spectroscopic image that comprises a 2D T1-T2 spectrum at every spatial location. The spectral peaks from these high-dimensional spectra resolve partial voluming within a voxel, which allows the spectroscopic image to be used for spatial mapping of different tissue compartments. Previous RR-CSI implementations1-2 used an inversion recovery multi-echo spin-echo (IR-MSE) sequence for data acquisition, and demonstrated good results with in vivo human brain data. However, RR-CSI is not restricted to an IR-MSE acquisition, and it’s very possible that other acquisition schemes may be more efficient than IR-MSE. In this work, we consider the use of an MR Fingerprinting (MRF)3 style of data acquisition for RR-CSI. MRF acquires data using dynamically varying pulse sequence parameters without a traditional steady state, and is potentially promising for RR-CSI because it is sensitive to both T1 and T2 relaxation and is applicable to multicomponent relaxation modeling4-5. This work investigates the theoretical and empirical potential of an inversion-recovery (IR) FISP MRF acquisition6 for RR-CSI.Theory
RR-CSI assumes that the data $$$M(\bf{x},\bf{\gamma})$$$ acquired at spatial location $$$\bf{x}$$$ and with contrast-encoding parameters $$$\bf{\gamma}$$$ (e.g., $$$\bf{\gamma}$$$ can include inversion time (TI), echo time (TE), flip angle (FA), and repetition time (TR)) can be modeled as:
$$M(\bf{x},\bf{\gamma})=\int\int \it{F}(\bf{x},\it{T}_1,\it{T}_2)\it{K} (T_1,T_2,\bf{\gamma}) \it{dT}_1 \it{dT}_2$$
where $$$\it{F}(\bf{x},\it{T}_1,\it{T}_2)$$$ is the unknown spectroscopic image and $$$\it{K}(T_1,T_2,\bf{\gamma})$$$ is the signal corresponding to a “pure” compartment with relaxation parameters $$$\it{T}_1,\it{T}_2$$$. RR-CSI solves a dictionary-based spatially-regularized nonnegative least squares optimization problem to estimate the spectroscopic image1-2. From a modeling perspective, the main difference between IR-MSE and IR-FISP MRF is different $$$\it{K}(T_1,T_2,\bf{\gamma})$$$ functions.
Methods
The IR-FISP MRF acquisition was first compared against an IR-MSE theoretically, using the Cramér-Rao Lower Bound (CRLB) from estimation theory7. The CRLB is a lower bound on the variance of any unbiased estimator, and is frequently used as a measure of the “goodness” of an experiment for a given parameter estimation problem8. We considered two experiments:
IR-MSE: we used the same acquisition protocol from previous RR-CSI work2, which acquired data with TR=5000ms, and every combination of 7 TIs (0, 100, 200, 400, 700, 1000 and 2000ms) and 15 TEs (from TE=7.5ms to 217.5ms in 15ms increments) for a total of 105 contrasts.
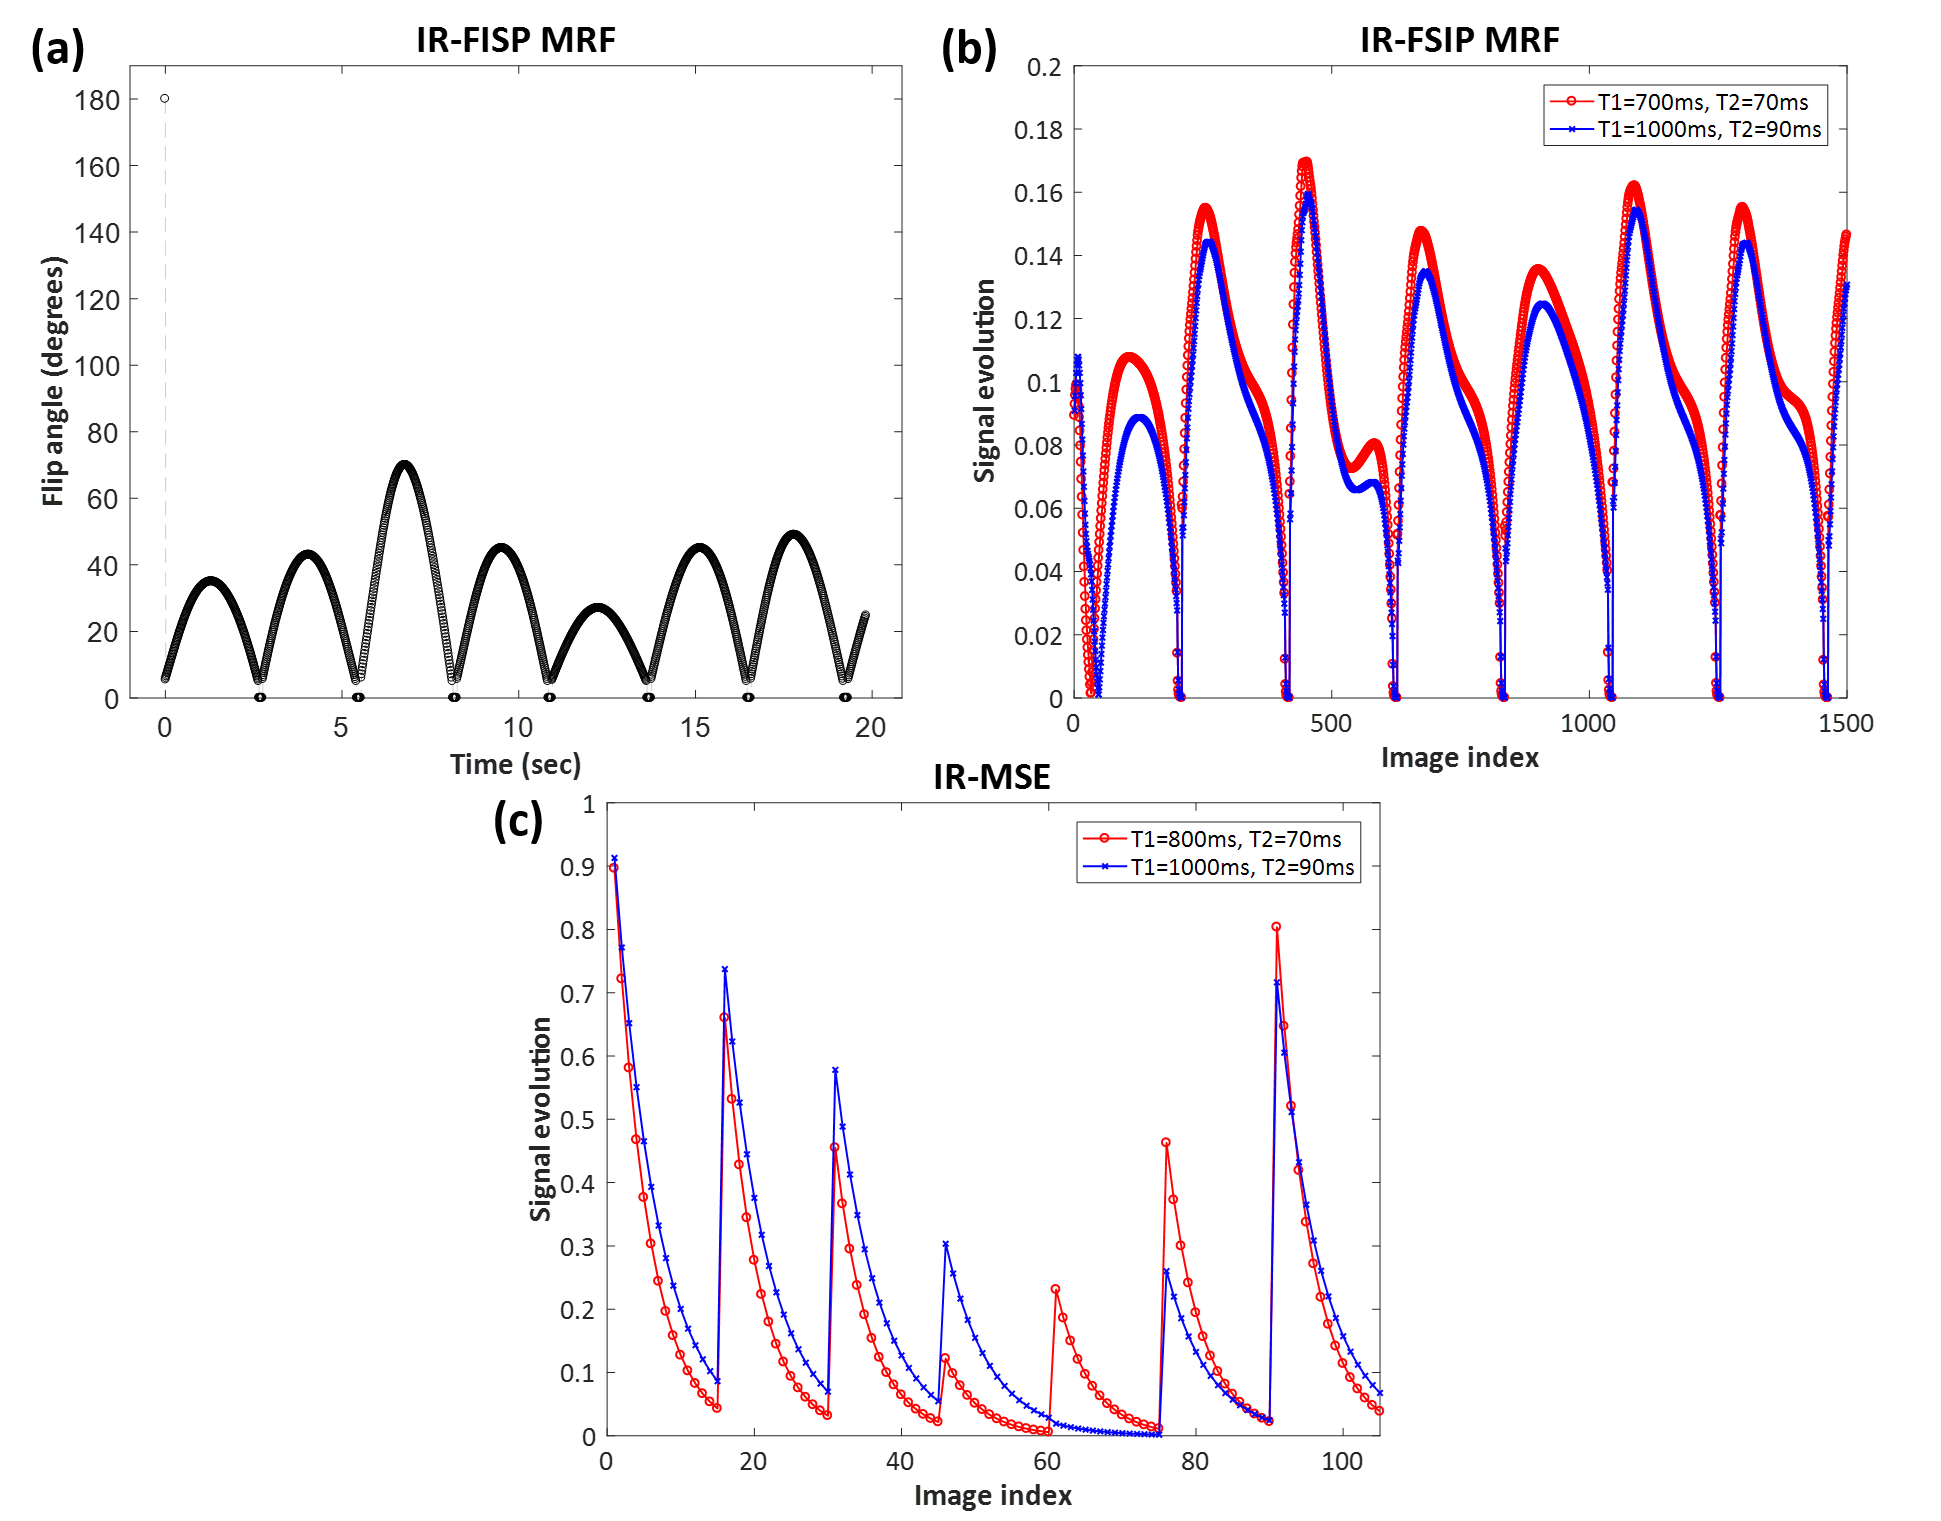
IR-FISP MRF: we used the same “conventional MRF” IR-FISP acquisition protocol from previous work8, which acquired data with TI=12.34ms, TE=2ms, and a variety of FAs and TRs for a total of 1500 contrasts. Both sequences are illustrated in Fig.1. To ensure a fair comparison, we assumed that data averaging was performed so that both sequences required the same amount of imaging time. In addition, we also acquired fully-sampled IR-FISP MRF data from an in vivo human brain on a 3T scanner, and applied RR-CSI reconstruction to this data.
Results
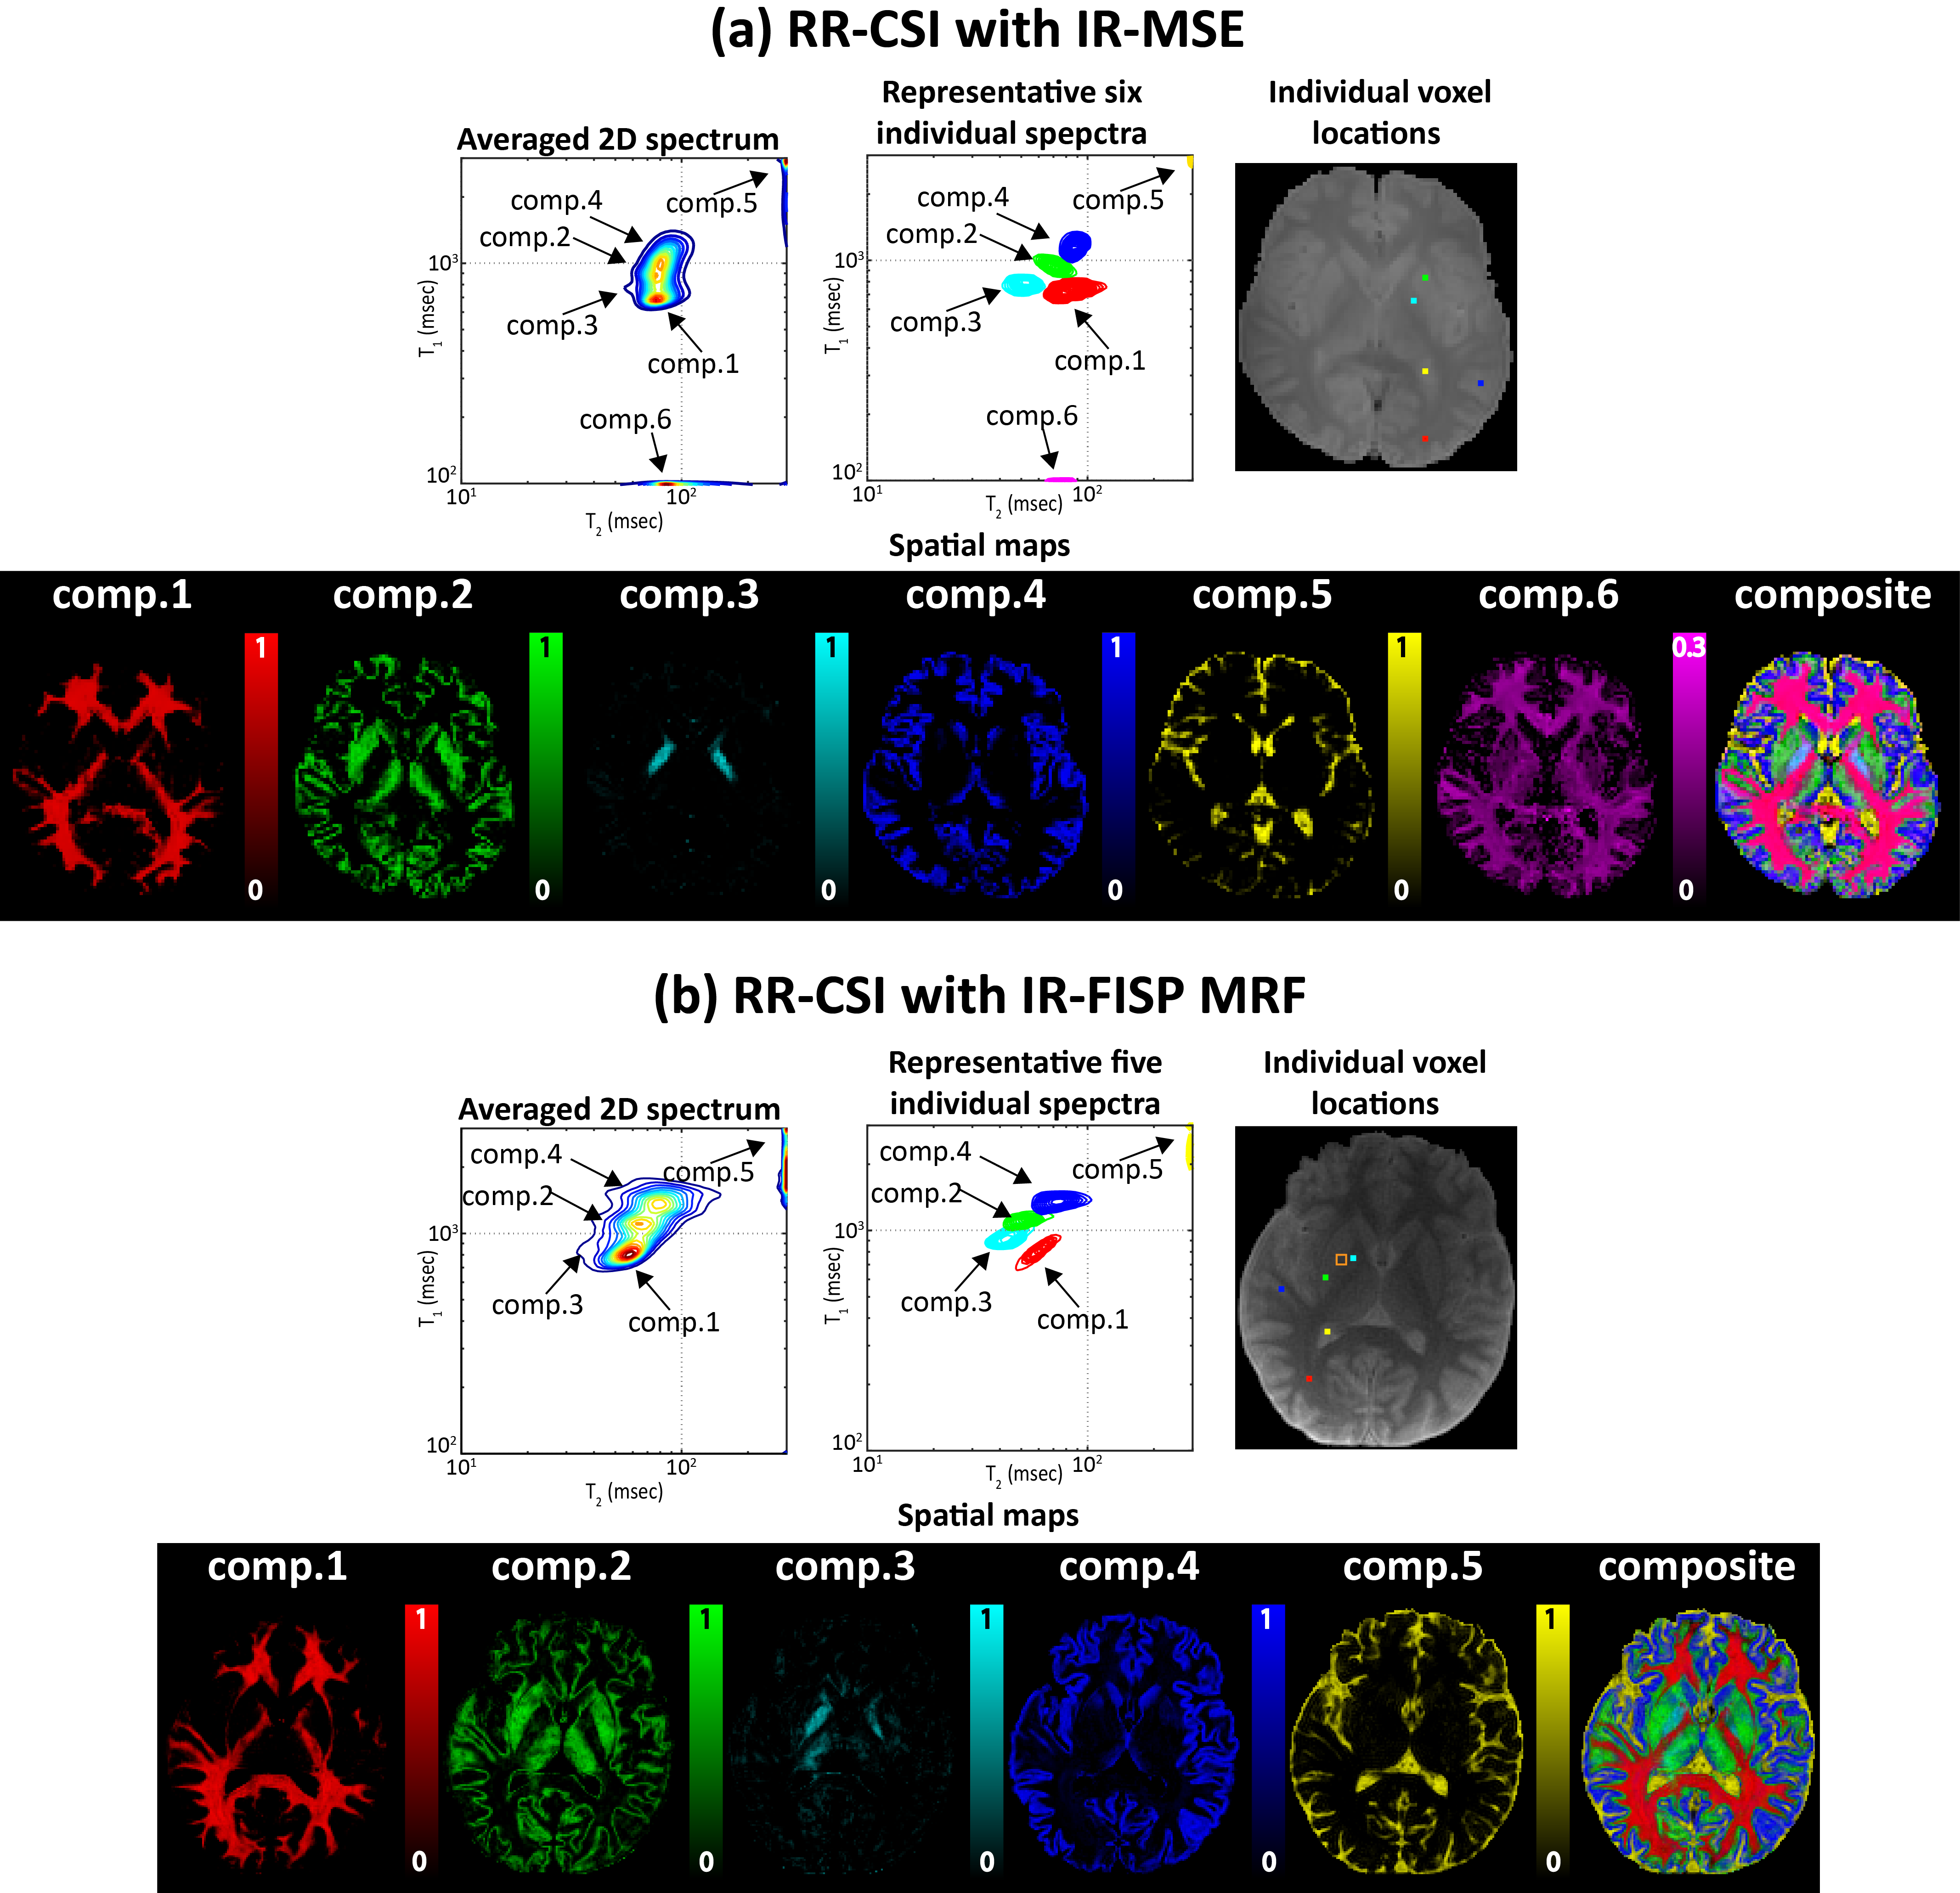
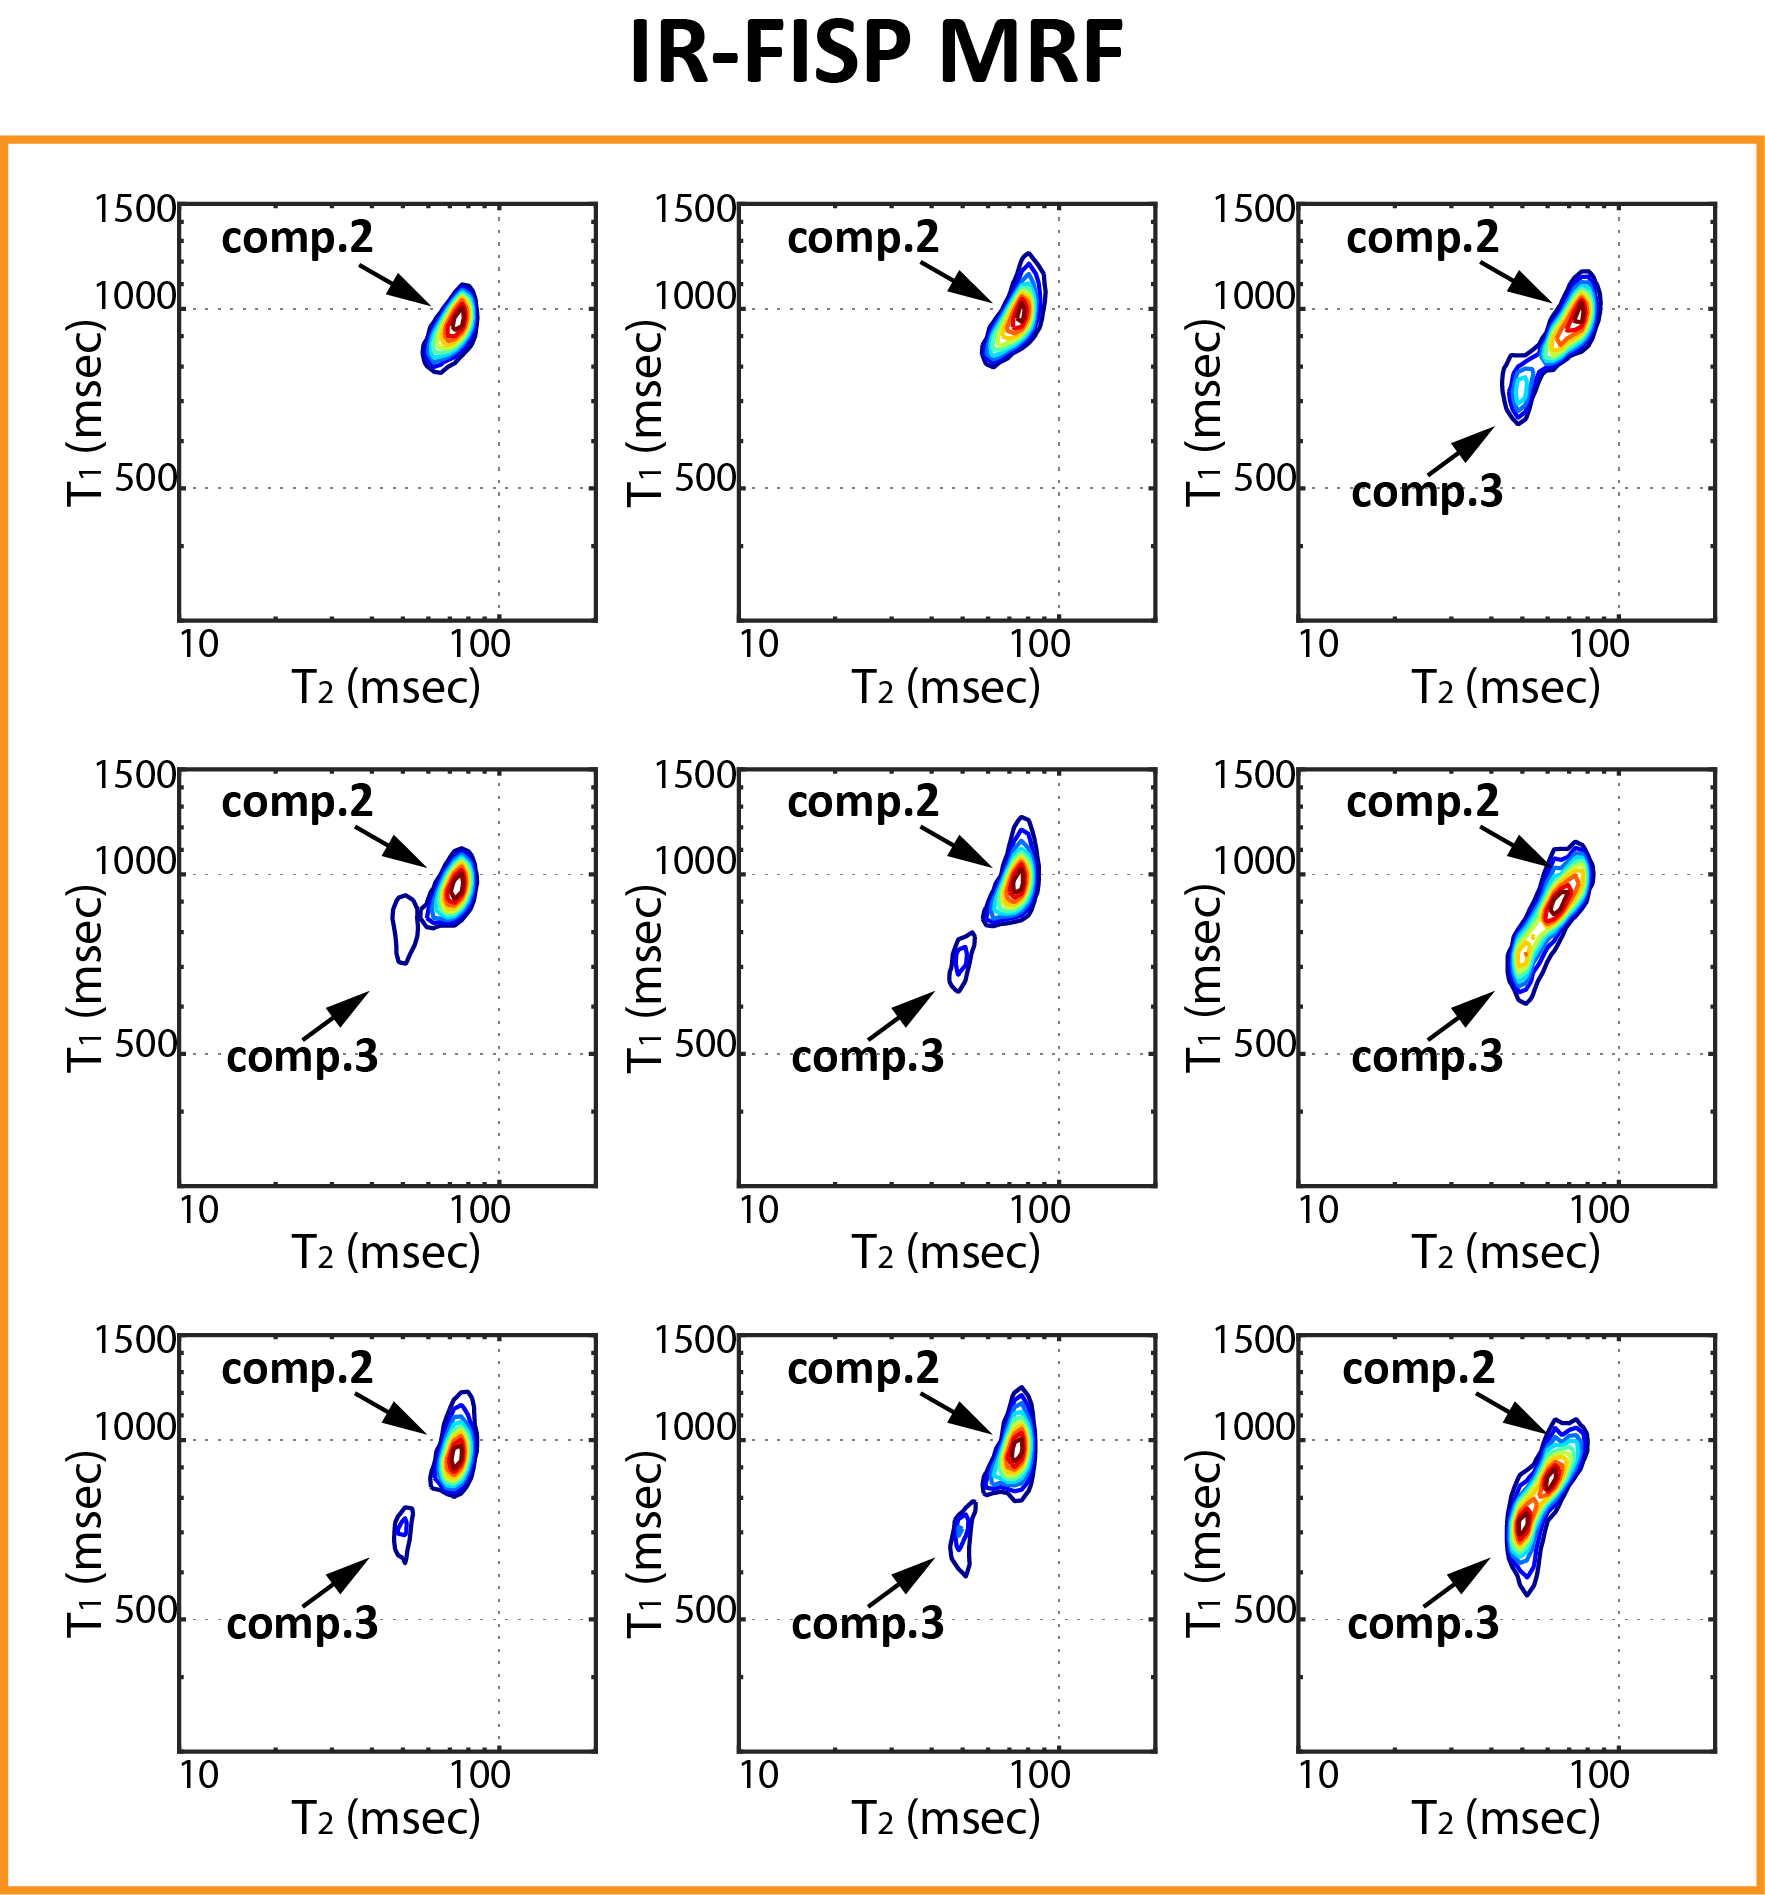
Fig.2 shows in vivo human brain RR-CSI results from IR-FISP MRF. For reference, we also show IR-MSE results from previous work1-2 (from a different subject and a different scanner!). We observe that IR-FISP MRF resolves and generates reasonable spatial maps for 5 distinct spectral peaks. These 5 peaks appear to have good spatial correspondence with 5 of the 6 peaks obtained with IR-MSE, although the values are slightly different for the two acquisitions. IR-FISP MRF does not resolve the previously-identified sixth compartment, which is associated with short T1 and may be associated with myelin water. Fig.3 shows an illustration of the 4D spectroscopic image, demonstrating the resolution of partial voluming within each voxel.
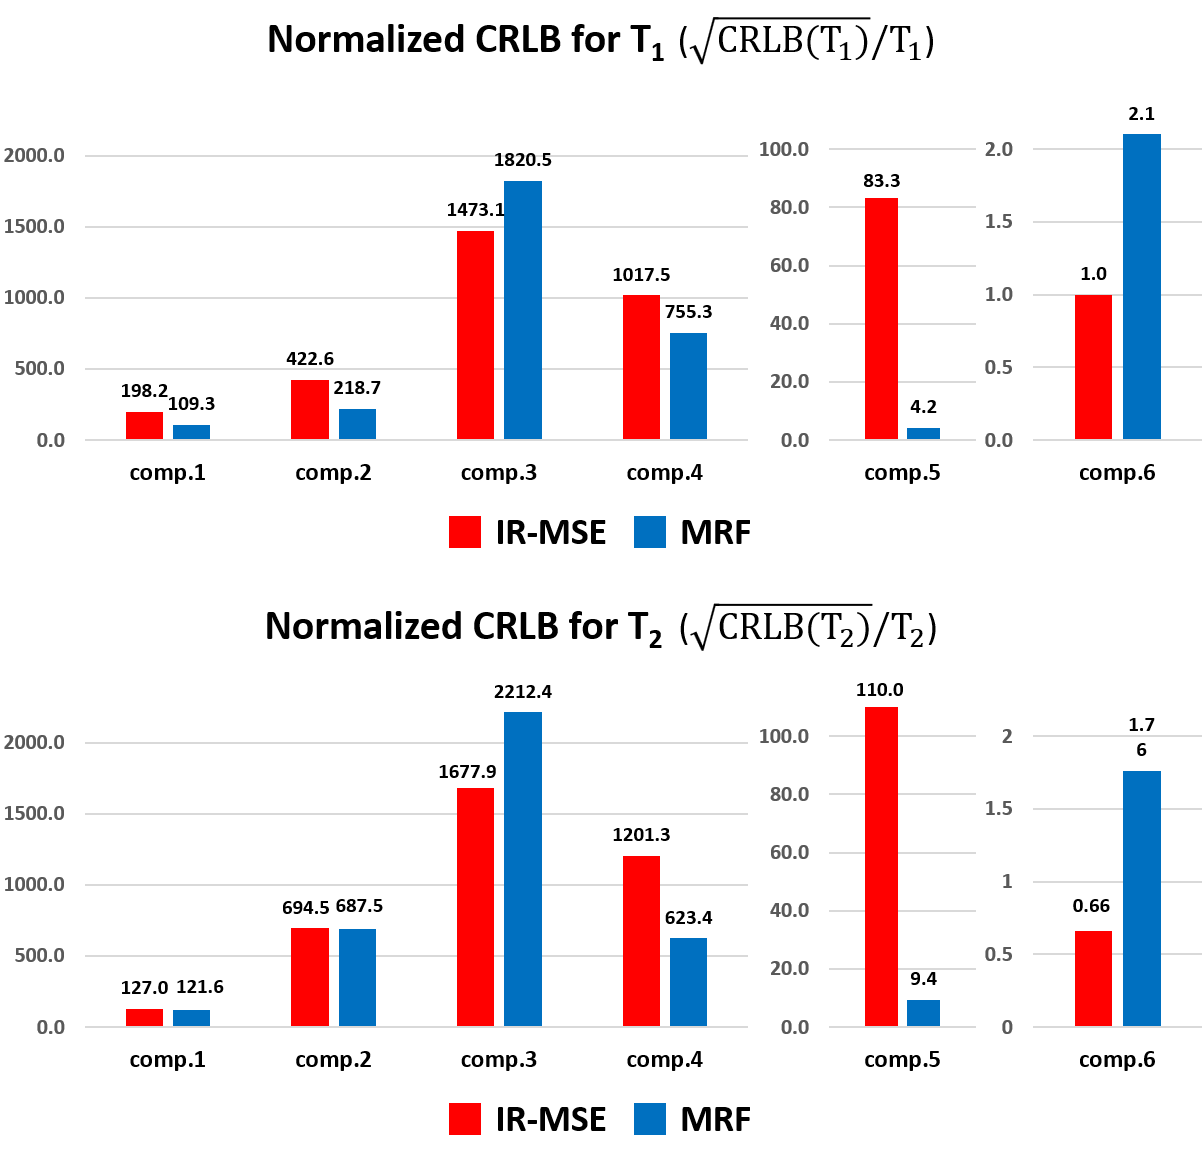
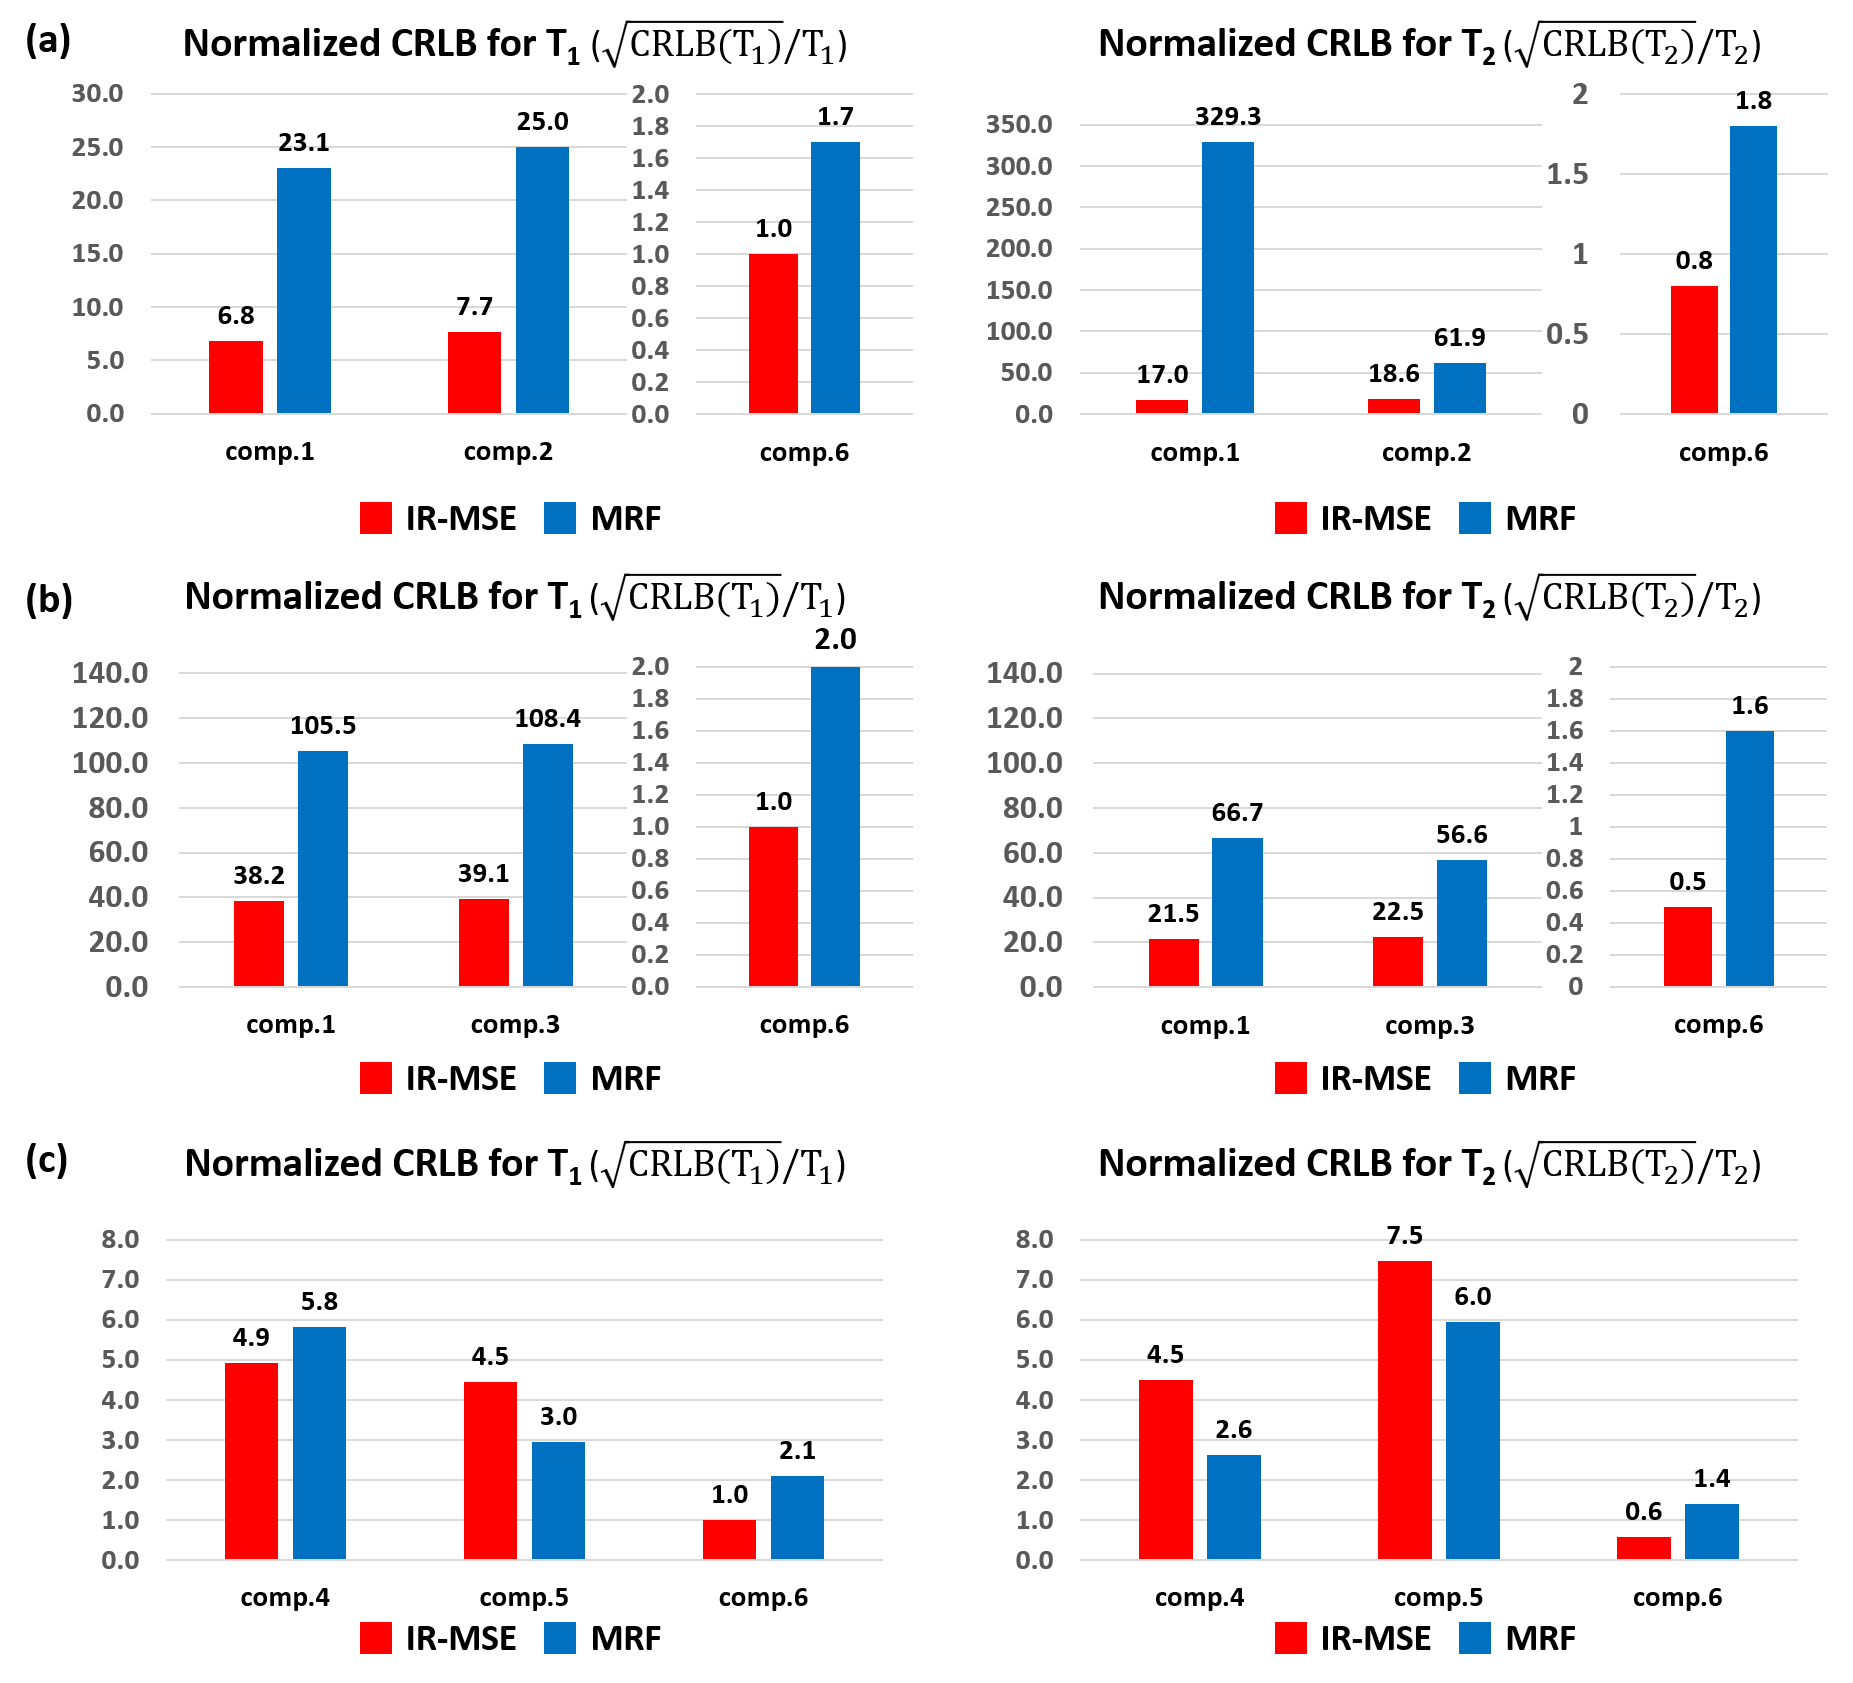
Fig.4 shows CRLB results assuming that 6 compartments are present within a voxel (the same 6 compartments identified from IR-MSE1-2), while Fig.5 shows CRLB results assuming that only 3 compartments are present within a voxel (based on the observed “typical” compartmental distributions from IR-MSE). We observe that both sequences have advantages relative to each other in different contexts (lower CRLB is better), although we also observe that IR-FISP MRF has consistently worse CRLB for estimating components 3 and 6. The substantially worse CRLB for compartment 6 may explain the missing sixth spectral peak in the IR-FISP MRF data.
Conclusion
We performed RR-CSI using an IR-FISP MRF acquisition and theoretically evaluated the experimental efficiency. Our results demonstrate that IR-FISP MRF is a viable alternative to IR-MSE for RR-CSI. However, while IR-FISP MRF is viable, it is likely suboptimal, and the application of optimal experiment design approaches8-9 is likely beneficial.Acknowledgements
This work was
supported in part by the USC Alfred E. Mann Institute and research grants NSF
award CCF-1350563 and NIH grants R21-EB022951, R01-NS074980, R01-NS089212,
R01-MH116173 and F32-EB024381.
References
1. Kim D, Wisnowski JL, Nguyen CT, Haldar JP. Multidimensional T1 Relaxation-T2 Relaxation Correlation Spectroscopic Imaging (RR-CSI) for In Vivo Imaging of Microstructure. ISMRM 2018; p.783.
2. Kim D, Wisnowski JL, Nguyen CT, Haldar JP. Relaxation-Relaxation Correlation Spectroscopic Imaging (RR-CSI): Leveraging the Blessings of Dimensionality to Map In Vivo Microstructure. Preprint, arXiv:1806.05752.
3. Ma D, Gulani V, Seiberlich N, Liu K, Sunshine KL, Duerk JL, Griswold MA. Magnetic Resonance Fingerprinting, Nature 2013; 495:187-192.
4. McGivney D, Deshmane A, Jiang Y, Ma D, Badve C, Sloan A, Gulani V, Griswold M. Bayesian Estimation of Multicomponent Relaxation Parameters in Magnetic Resonance Fingerprinting. Magn Reson Med 2018; 80:159–170.
5. Tang S, Fernandez-Granda C, Lannuzel S, Bernstein B, Lattanzi R, Cloos M, Knoll F, Asslander J. Multicompartment Magnetic Resonance Fingerprinting. Preprint, arXiv:1802.10492.
6. Jian Y, Ma D, Seiberlich N, Gulani V, Griswold MA. MR Fingerprinting using Fast Imaging with Steady State Precession (FISP) with Spiral Readout. Magn Reson Med 2015; 74:1621–1631.
7. Kay SM. Fundamentals of Statistical Signal Processing, Volume I: Estimation Theory. Upper Saddle River: Prentice Hall, 1993.
8. Zhao B, Haldar JP, Liao C, Ma D, Jiang Y, Griswold MA, Setsompop K, Wald LL. Optimal Experiment Design for Magnetic Resonance Fingerprinting: Cramer-Rao Bound Meets Spin Dynamics. IEEE Trans on Med Imag 2018; In press.
9. Kim D, Wisnowski JL, Haldar JP. Improved Efficiency for Microstructure Imaging using High-Dimensional MR Correlation Spectroscopic Imaging. Asilomar Conference on Signals, Systems and Computers 2017; 1264-1268.
Figures