4939
High Repeatability of Quantitative Susceptibility Mapping (QSM) in the Head and Neck With a View to Detecting Hypoxic Cancer Sites1Department of Medical Physics and Biomedical Engineering, University College London, London, United Kingdom, 2Centre for Medical Imaging, University College London, London, United Kingdom
Synopsis
As hypoxic tumours in the head-and-neck are more resistant to radiation therapy, there is a pressing clinical need to measure tumour oxygenation non-invasively. Since deoxyhemoglobin in the blood, which indicates hypoxia, is paramagnetic, QSM is a candidate technique. Here, we tested QSM’s repeatability in various head-and-neck regions in ten healthy volunteers to investigate the feasibility of detecting the susceptibility difference expected to result from hypoxia. We found low minimum detectable effect sizes in the lymph nodes (0.12 ppm), submandibular glands (0.08 ppm), and parotid glands (0.04 ppm). This high QSM repeatability paves the way for clinical studies.
Purpose
Tumour hypoxia is associated with adverse prognosis after radiotherapy (RT) in head-and-neck cancer1. Therefore, there is a pressing clinical need to measure tumour oxygenation and identify hypoxic sites to improve RT treatment. Blood deoxyhemoglobin, which increases in hypoxia2, is paramagnetic3 having higher susceptibility than surrounding tissues. QSM which calculates tissue magnetic susceptibility from MRI phase images4-6 is a non-invasive method that could be useful to measure tissue oxygenation. Here we measured the repeatability of a QSM protocol optimised for the head-and-neck to determine whether QSM is stable enough to detect hypoxic sites in this region.Methods
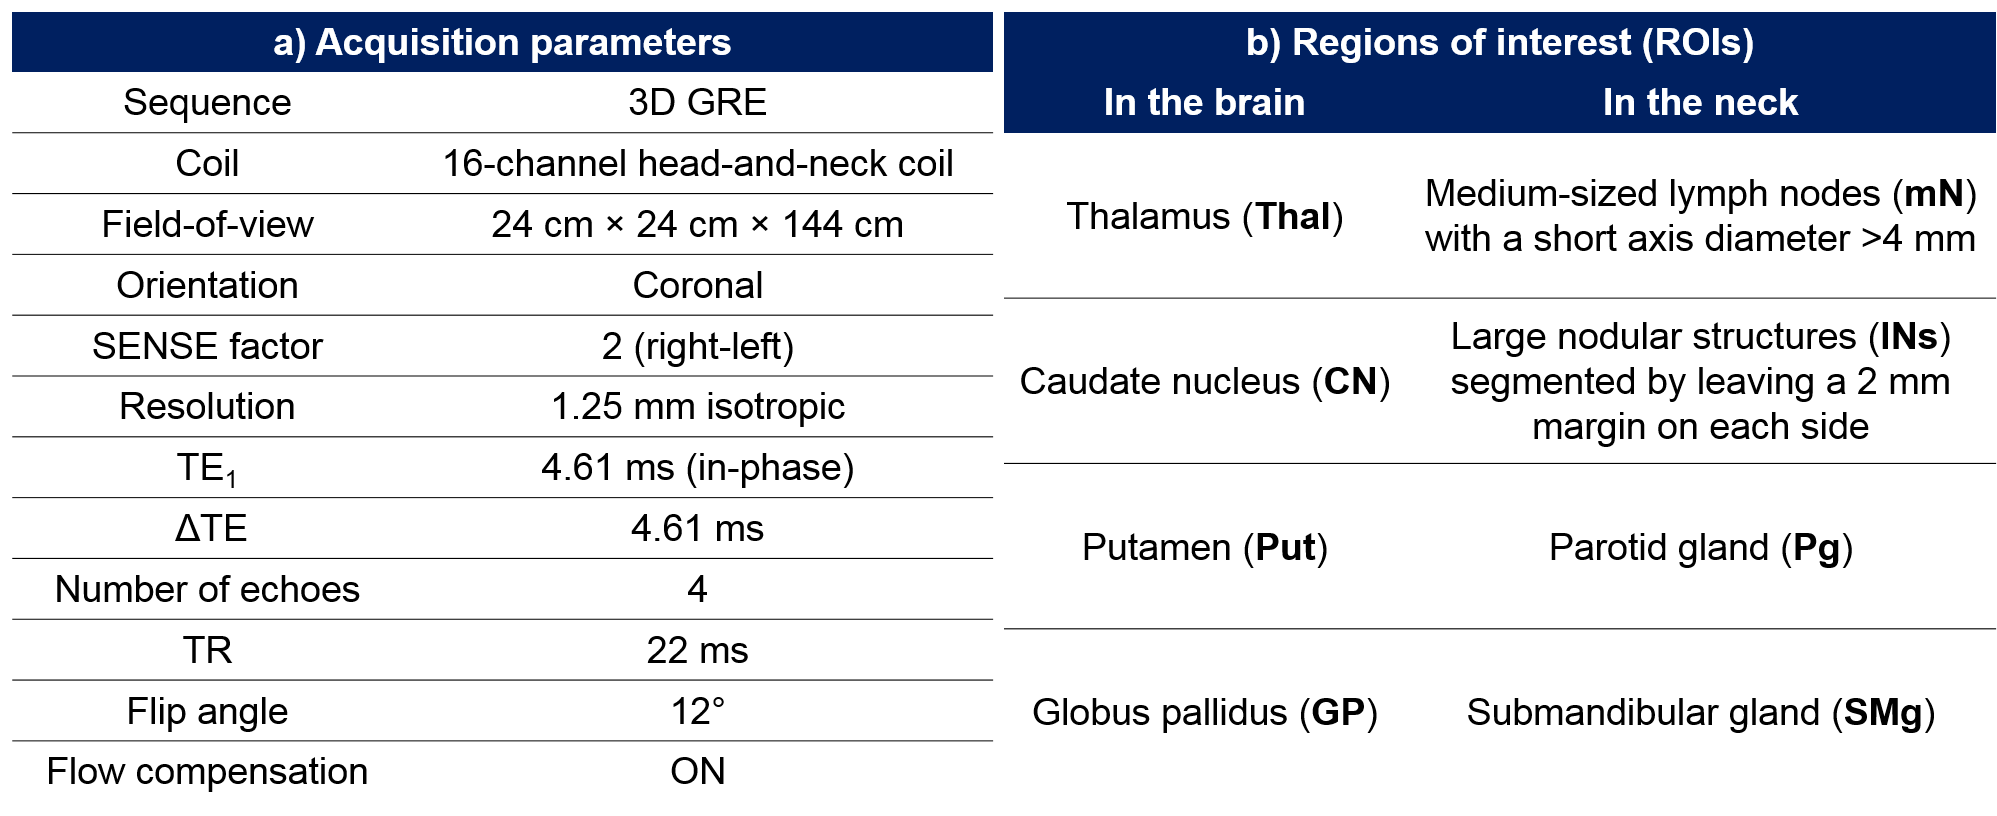
Multi-echo head-and-neck images were acquired in 10 healthy volunteers at 3T (Achieva, Philips Healthcare, NL) using a 16-channel head-and-neck RF coil and an optimised 3D gradient-echo sequence7-8 (Figure 1a). All volunteers were scanned 3 times per session at two sessions a week apart to investigate both intrasession and intersession repeatability. Head-and-neck tissue masks were generated by thresholding the inverse noise map9-10. An optimised QSM pipeline was applied: 1. Non-linear field fitting11, 2. Laplacian phase unwrapping12, 3. Projection onto Dipole Fields13, 4. Iterative fitting in image space with Tikhonov regularisation10 with regularisation parameter $$$\lambda=0.11$$$ and correction for susceptibility underestimation12.
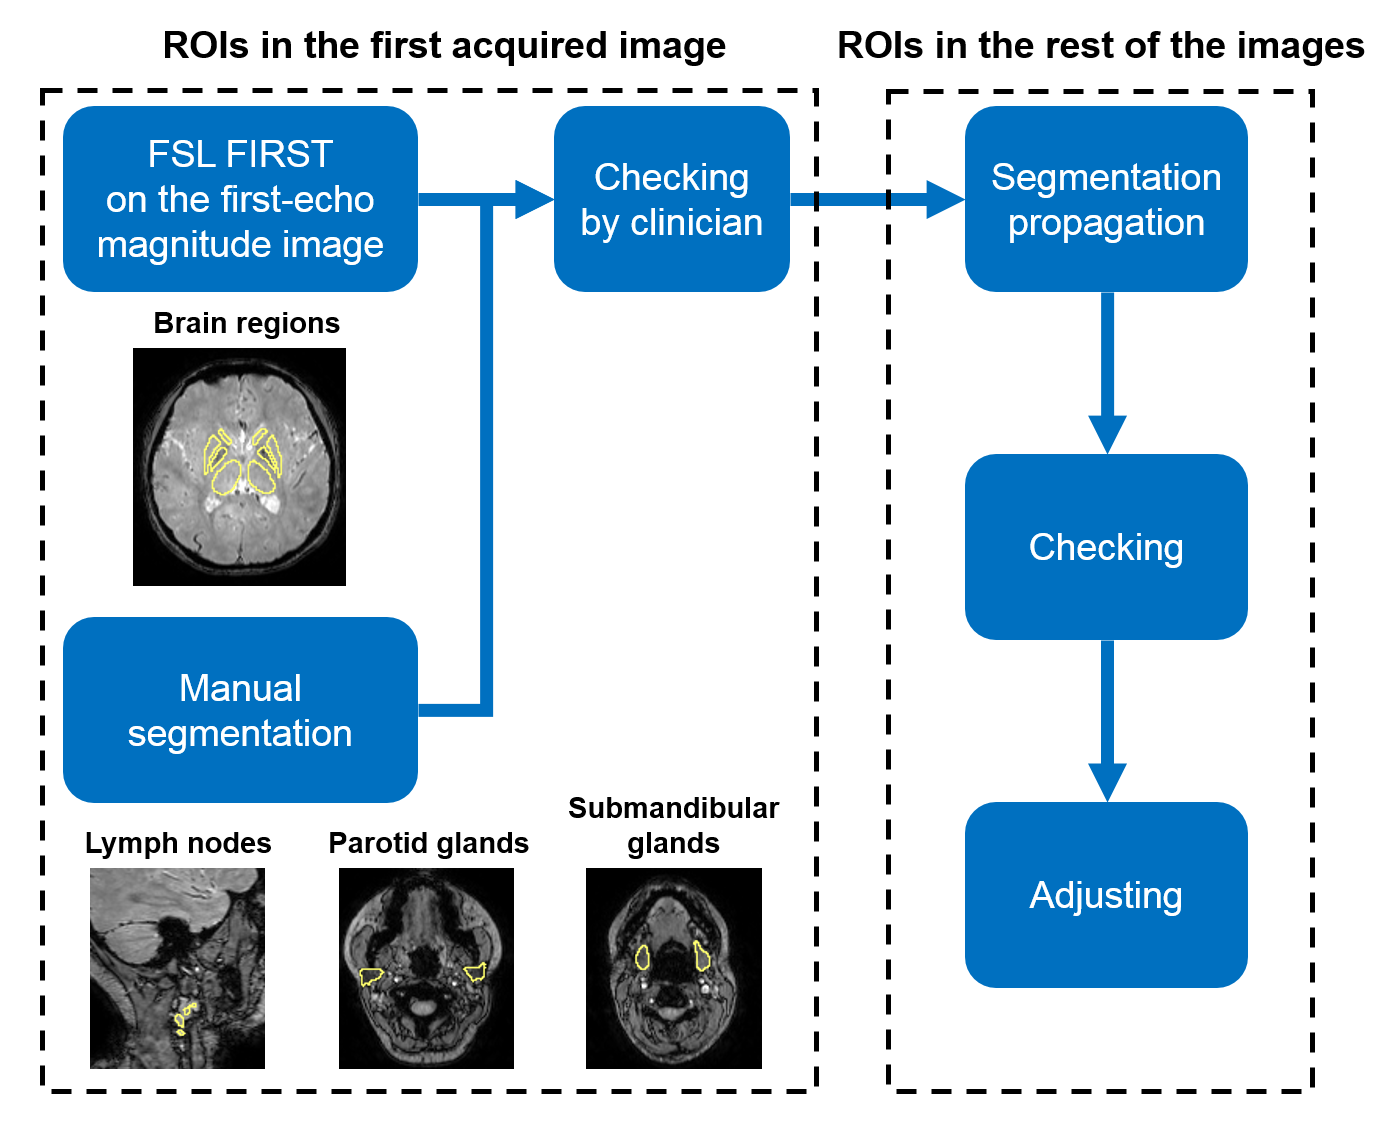
In the first acquired images of each volunteer, brain regions (Figure 1b) were automatically segmented (Figure 2) using FSL FIRST14 on the first-echo magnitude images, and neck regions of interest (ROIs) (Figure 1b) were manually delineated using ITK- SNAP15-16. Regions were checked by an experienced radiologist (Figure 2). ROIs in the remaining five images were delineated using segmentation propagation: the last-echo magnitude image of the first scan was non-rigidly registered17-19 to the rest of the last-echo magnitude images and the resulting transformations were used to warp the segmented ROIs. All ROIs were checked visually and manually adjusted if necessary (Figure 2).
Mean and median susceptibilities were calculated in all ROIs. The distributions of the susceptibility differences measured between scans were used to assess intrasession and intersession repeatability for each ROI. The minimum detectable effect size20 (MDE) was calculated for each ROI based on the standard deviation of the corresponding distribution with type I and II error rates of $$$\alpha=0.05$$$ and $$$\beta=0.2$$$ respectively.
Results and Discussion
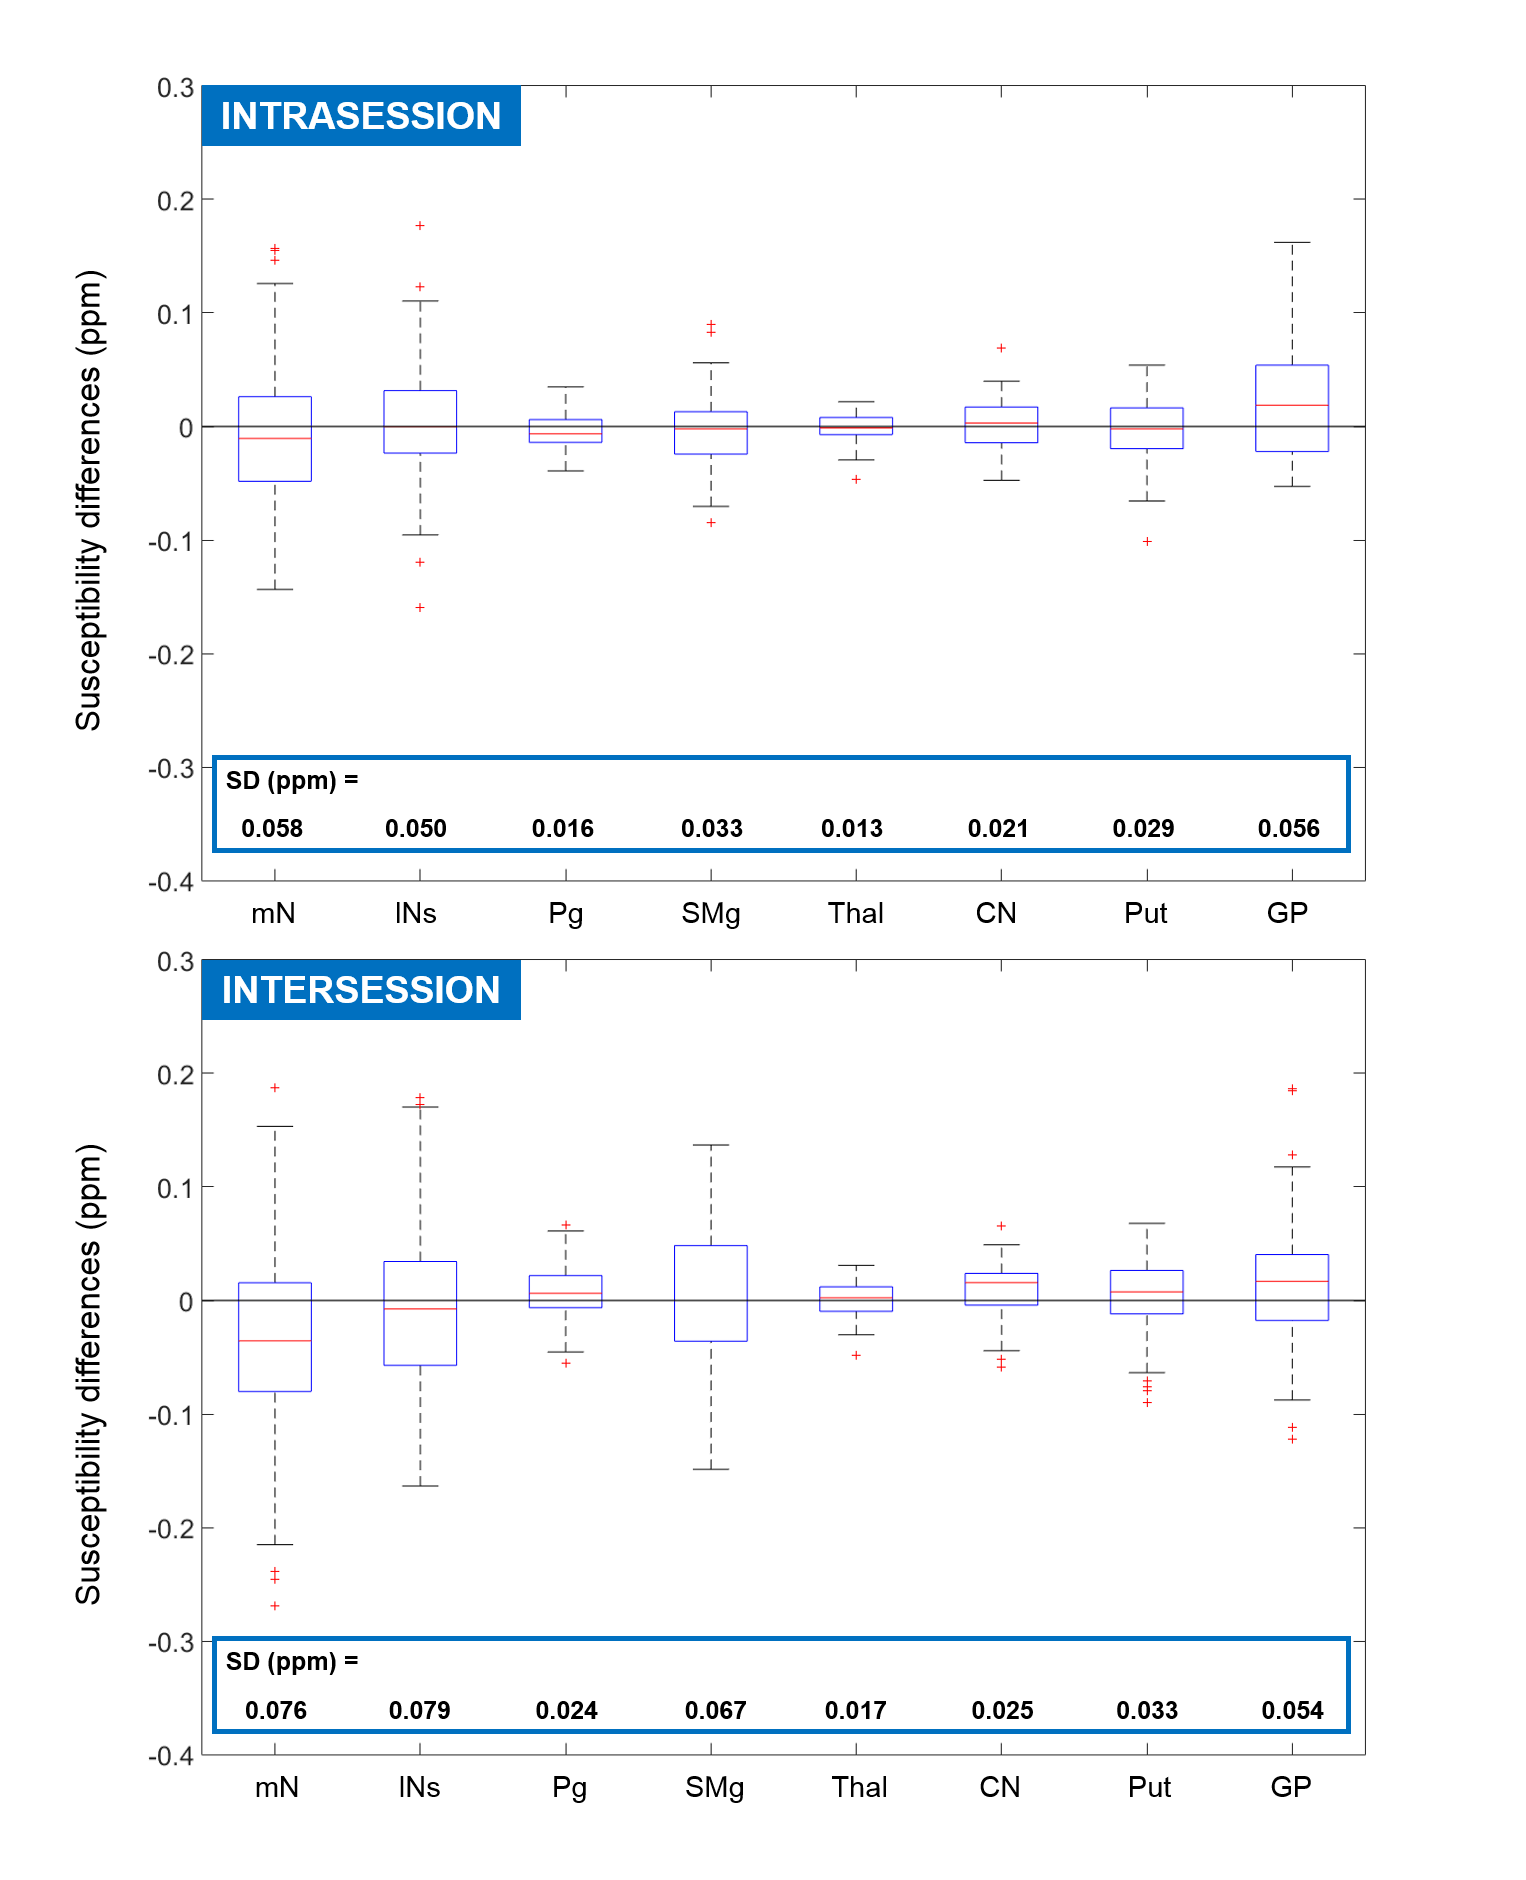
Figure 3 shows the distributions of intrasession and intersession median susceptibility differences for each ROI. Most of the distributions are centered around zero (within 0.02 ppm) except those of the GP (the ROI abbreviations can be found in Figure 1b). This could be because the GP has a much higher susceptibility than the surrounding tissue, therefore inaccuracies in its segmentation can lead to bigger, systematic errors. The intersession distribution in mN is also substantially further off-center than the rest. This could be because intersession co-registration was often inaccurate due to the mN’s relatively small size and they were usually surrounded by much more paramagnetic fatty tissue8. lNs were larger and were, therefore, segmented with a 2 mm margin on each side mitigating the effects of inaccurate segmentation and leading to much higher repeatability (narrower distribution with a center closer to zero).
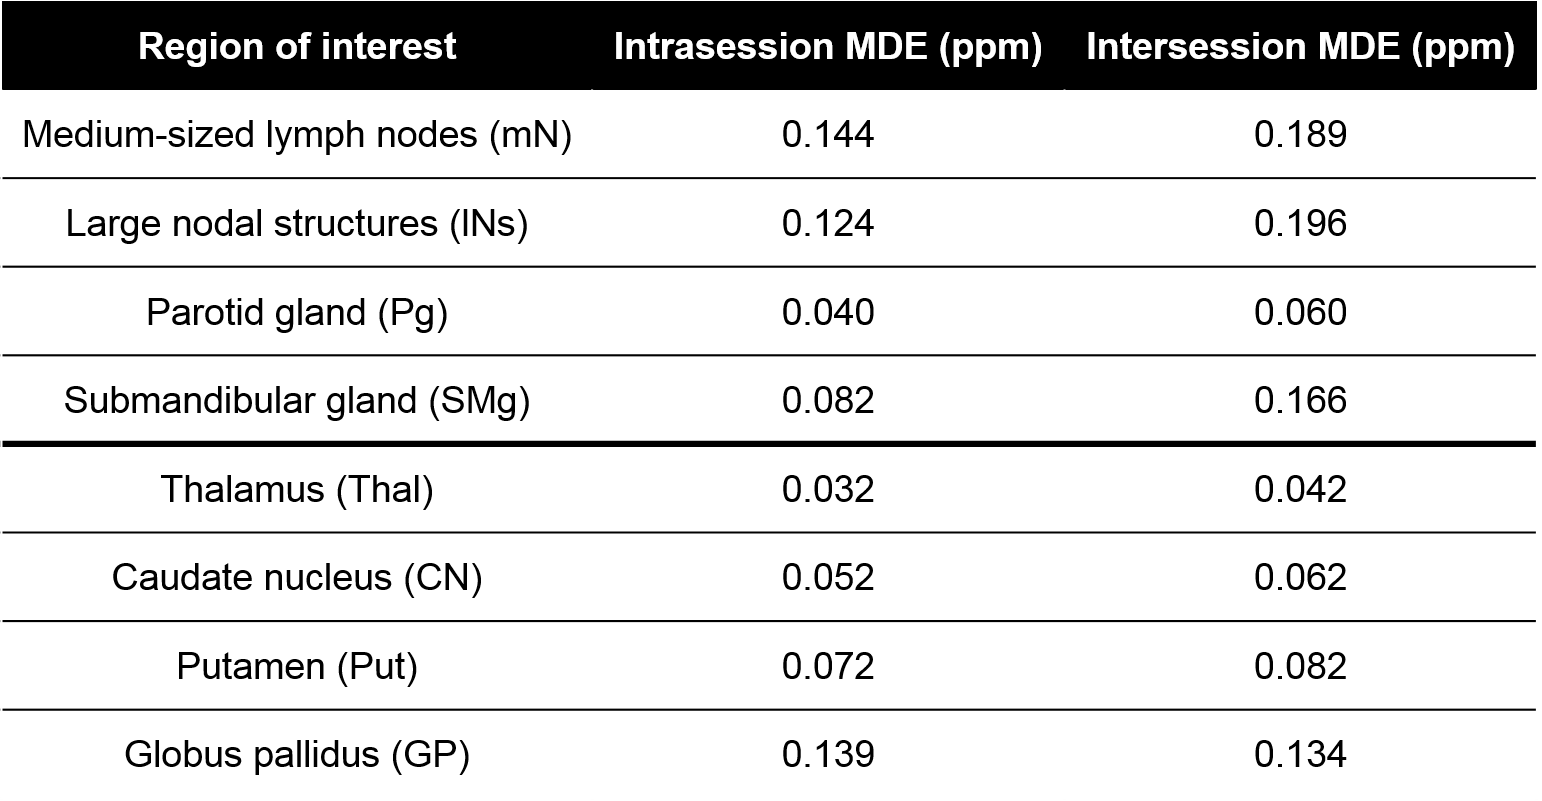
Brain regions had higher repeatability and, consequently, smaller MDEs (Figure 4) than neck regions. The intrasession repeatability was always greater than or equal to the intersession repeatability for each region, especially for the SMg where the intersession MDE was double that of the intrasession MDE. This may have been because of positioning, physiological or system differences. Susceptibility of the Pg had especially high intrasession and intersession repeatability. All MDEs were lower than 0.2 ppm. Results based on the mean susceptibility (not shown) were almost identical in these healthy volunteers.
The susceptibility difference between fully oxygenated and fully deoxygenated blood3 is $$$\Delta \chi_{blood}=Hct\cdot 3.8 ppm$$$ , where $$$Hct$$$ is the hematocrit. Therefore, the susceptibility difference between hypoxic and normoxic sites can be estimated as $$$\chi_{hypoxic}-\chi_{normoxic}=V\cdot\Delta\chi_{blood}$$$, where $$$V$$$ denotes the vascular density. Substituting $$$Hct=0.4$$$ and $$$V=0.2$$$, which are both realistic values for healthy and cancerous tissue21-24, the susceptibility difference is about 0.3 ppm which is substantially higher than the measured MDEs. Note that the exact susceptibility difference scales linearly with $$$V$$$ which was approximated to be higher (0.85) by Panek et al.25
Conclusions
Susceptibility values measured in healthy lymph nodes, large nodular structures, and the parotid and submandibular glands had sufficient repeatability to enable future detection of the estimated susceptibility difference between normoxic and hypoxic tissue. Therefore, QSM could potentially identify hypoxic sites in head-and-neck cancer. Careful delineation of ROIs is crucial to avoid inaccuracies, especially if the susceptibility difference between the region and its surroundings is high, e.g. for healthy lymph nodes embedded in paramagnetic fatty fascia.Acknowledgements
Anita Karsa's work was supported by the EPSRC-funded UCL Centre for Doctoral Training in Medical Imaging (EP/L016478/1) and the Department of Health's National Institute for Health Research funded Biomedical Research Centre at University College London Hospitals.References
1. Nordsmark, Marianne, et al. "Prognostic value of tumor oxygenation in 397 head and neck tumors after primary radiation therapy. An international multi-center study." Radiotherapy and Oncology 77.1 (2005): 18-24.
2. Baudelet, Christine, and Bernard Gallez. "How does blood oxygen level‐dependent (BOLD) contrast correlate with oxygen partial pressure (pO2) inside tumors?" Magnetic resonance in medicine 48.6 (2002): 980-986.
3. Jain, Varsha, et al. "Investigating the magnetic susceptibility properties of fresh human blood for noninvasive oxygen saturation quantification." Magnetic resonance in medicine 68.3 (2012): 863-867.
4. Shmueli, Karin, et al. "Magnetic susceptibility mapping of brain tissue in vivo using MRI phase data." Magnetic resonance in medicine 62.6 (2009): 1510-1522.
5. Reichenbach, J. R., et al. "Quantitative susceptibility mapping: concepts and applications." Clinical neuroradiology 25.2 (2015): 225-230.
6. Eskreis‐Winkler, Sarah, et al. "The clinical utility of QSM: disease diagnosis, medical management, and surgical planning." NMR in Biomedicine 30.4 (2017).
7. Karsa, A., Punwani, S., & Shmueli, K. “The effect of low resolution and coverage on the accuracy of susceptibility mapping.” Magnetic Resonance in Medicine (2018).
8. Karsa, Anita, et al. “Fat Correction of MRI Phase Images for Accurate Susceptibility Mapping in the Head and Neck.” In Proceedings of the 25th Annual Meeting of the ISMRM, Paris (2018): p. 4988
9. MEDI toolbox: http://weill.cornell.edu/mri/pages/qsm.html
10. Kressler, Bryan, et al. "Nonlinear regularization for per voxel estimation of magnetic susceptibility distributions from MRI field maps." IEEE transactions on medical imaging 29.2 (2010): 273.
11. Liu, Tian, et al. "Nonlinear formulation of the magnetic field to source relationship for robust quantitative susceptibility mapping." Magnetic resonance in medicine 69.2 (2013): 467-476.
12. Schweser, Ferdinand, et al. "Toward online reconstruction of quantitative susceptibility maps: superfast dipole inversion." Magnetic resonance in medicine 69.6 (2013): 1581-1593.
13. Liu, Tian, et al. "A novel background field removal method for MRI using projection onto dipole fields." NMR in Biomedicine 24.9 (2011): 1129-1136.
14. Patenaude, Brian, et al. "A Bayesian model of shape and appearance for subcortical brain segmentation." Neuroimage56.3 (2011): 907-922.
15. Yushkevich, Paul A., et al. "User-guided 3D active contour segmentation of anatomical structures: significantly improved efficiency and reliability." Neuroimage 31.3 (2006): 1116-1128.
16. ITK-SNAP: www.itksnap.org
17. Rueckert, Daniel, et al. "Nonrigid registration using free-form deformations: application to breast MR images." IEEE transactions on medical imaging 18.8 (1999): 712-721.
18. Lee, Seungyong, George Wolberg, and Sung Yong Shin. "Scattered data interpolation with multilevel B-splines." IEEE transactions on visualization and computer graphics 3.3 (1997): 228-244.
19. MATLAB b-spline: https://uk.mathworks.com/matlabcentral/fileexchange/20057-b-spline-grid-image-and-point-based-registration
20. Bloom, Howard S. "Minimum detectable effects: A simple way to report the statistical power of experimental designs." Evaluation review 19.5 (1995): 547-556.
21. Weisskoff, Robert M., and Suzanne Kiihne. "MRI susceptometry: image‐based measurement of absolute susceptibility of MR contrast agents and human blood." Magnetic resonance in medicine 24.2 (1992): 375-383.
22. Fein, Douglas A., et al. "Pretreatment hemoglobin level influences local control and survival of T1-T2 squamous cell carcinomas of the glottic larynx." Journal of Clinical Oncology 13.8 (1995): 2077-2083.
23. Seda, C. J., et al. "Thrombocytosis and hematocrit as prognostic factors in renal carcinoma." Arch Esp Urol 64.9 (2011): 883-890.
24. Dewhirst, Mark W., et al. "Morphologic and hemodynamic comparison of tumor and healing normal tissue microvasculature." International Journal of Radiation Oncology• Biology• Physics 17.1 (1989): 91-99.
25. Panek, R., Welsh, L., Dunlop, A., Wong, K.H., Riddell, A.M., Koh, D.M., Schmidt, M.A., Doran, S., Mcquaid, D., Hopkinson, G. and Richardson, C. “Repeatability and sensitivity of T2* measurements in patients with head and neck squamous cell carcinoma at 3T.” Journal of Magnetic Resonance Imaging, 44(1), (2016): 72-80
Figures