4815
Automatic classification of benign and malignant prostate lesions: A comparison using VERDICT DW-MRI and ADC maps1UCL Centre for Medical Image Computing, Department of Computer Science, University College London, London, United Kingdom, 2Department of Computer Science, University College London, London, United Kingdom, 3UCL Centre for Medical Imaging, Division of Medicine, University College London, London, United Kingdom, 4Department of Radiology, UCLH NHS Foundation Trust, University College London, London, United Kingdom, 5Division of Surgery & Interventional Science, University College London, London, United Kingdom
Synopsis
Currently, many studies exploit deep learning and mp-MRI data to enhance the diagnostic accuracy of prostate cancer characterisation. In this study, we focus on VERDICT DW-MRI data and compare its diagnostic performance to those of the ADC map and the raw DW-MRI from the mp-MRI. Specifically, we compare the performance obtained by a fully convolutional neural network (CNN) when training and test is performed on the raw VERDICT DW-MRI, the ADC maps and the DW-MRI data from the mp-MRI acquisition. The results indicate that the CNN performs better when it is trained and tested on VERDICT DW-MRI.
Introduction
With the increasing availability of medical imaging data many studies exploit convolutional neural networks (CNNs) to improve the diagnostic clinical pathways for prostate cancer [1, 2]. These studies rely on multi-parametric (mp)-magnetic resonance imaging (MRI) data and usually use the diffusion weighted (DW)-MRI in its simplest form by considering the apparent diffusion coefficient (ADC) map. In this study, we focus on VERDICT (Vascular, Extracellular and Restricted Diffusion for Cytometry in Tumors) DW-MRI, which is an advanced microstructural imaging technique and has been proposed as an additional diagnostic tool for prostate cancer characterisation [3]. More specifically, we evaluate the diagnostic performance of the raw VERDICT DW-MRI data for automatic classification of prostate cancer using CNNs and compare it to the performance obtained using the ADC map and the raw DW-MRI data from the mp-MRI acquisition.Methods
Data acquisition
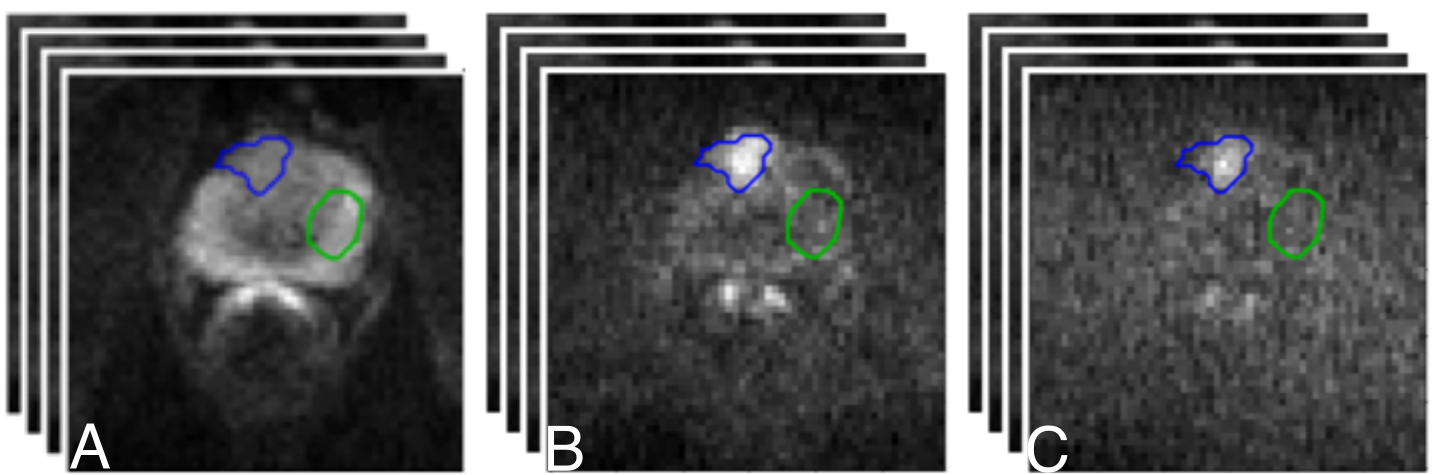
We acquired data from 18 patients on a 3T scanner (Achieva, Philips Healthcare, NL). All the patients underwent a standard mp-MRI [4] supplemented by VERDICT DW-MRI. VERDICT DW-MRI data was acquired with a pulsed-gradient spin-echo (PGSE) sequence using the optimised imaging protocol for VERDICT prostate characterisation with 5 b-values (90-3000 $$$ \mathrm{s/mm^2}$$$) in 3 orthogonal directions [5]. Also, images with b = 0 $$$ \mathrm{s/mm^2}$$$ were acquired before each b-value acquisition. Regarding the DW-MRI data from the mp-MRI acquisition, 4 b-values were acquired (0, 150, 500, 1000 $$$ \mathrm{s/mm^2}$$$), and subsequently, the ADC map was calculated by the scanner software. Two board certified radiologists contoured malignant and benign regions of interest (ROIs) on the registered VERDICT DW-MRI data and the ADC map.
Data analysis
We perform pixel-wise classification on malignant and benign ROIs on the VERDICT DW-MRI data, the ADC map and mp-MRI DW-MRI data using a convolutional encoder-decoder architecture. We consider two different classes (malignant, benign) and train the network using pixel-wise cross entropy loss
$$$\mathrm{CE= \sum_j l_j log(p_j) + (1-l_j) log(1-p_j)},$$$
where $$$\mathrm{p_j}$$$ is the probability that pixel $$$\mathrm{j}$$$ belongs to class 1 and $$$\mathrm{l_j}$$$ is the true label of pixel $$$\mathrm{j}$$$.
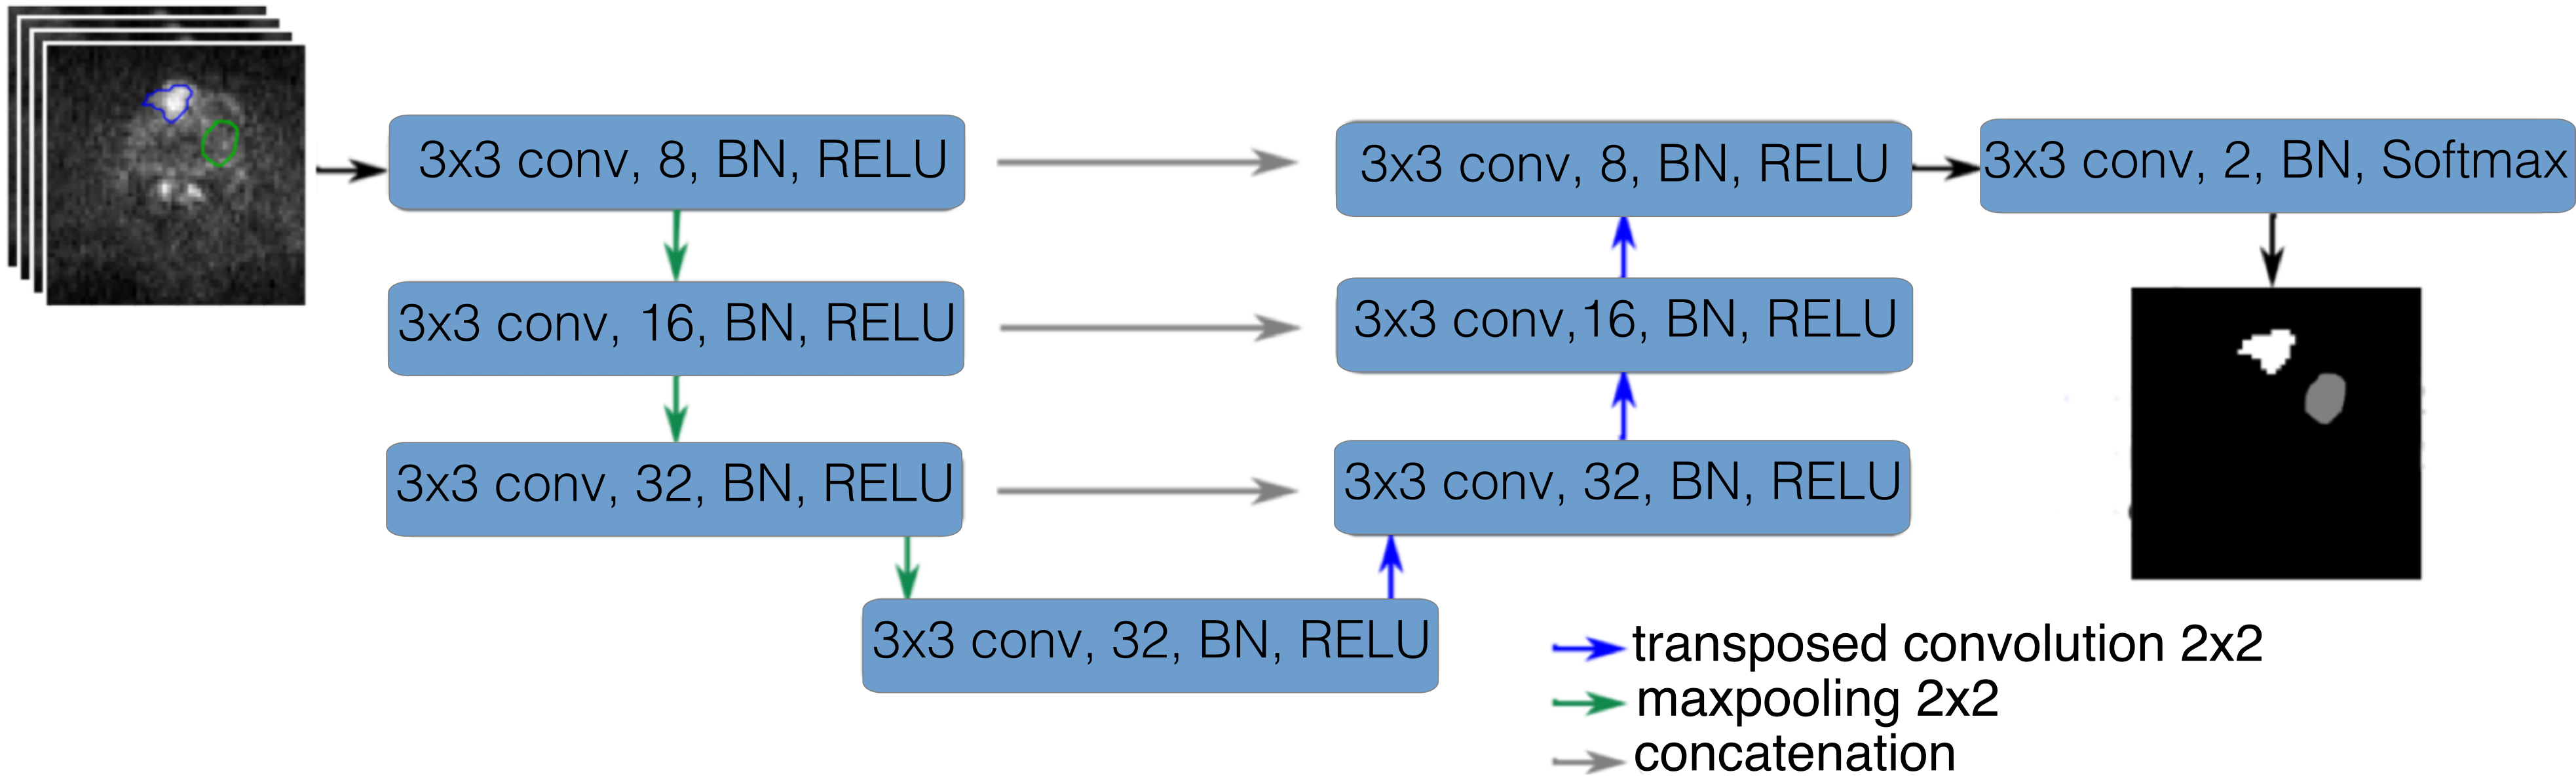
We use an encoder-decoder architecture (MRI-UNet) which is a modified version of the U-Net architecture [6] (Figure 2). MRI-UNet has fewer convolutional layers to avoid overfitting and has the following form: $$$\mathrm{\text{C}_8\text{-P-C}_{16} \text{-P-C}_{32}\text{-P-C}_{32}\text{-TC}_{32}\text{-C}_{32}\text{-TC}_{16}\text{-C}_{16}\text{-TC}_8\text{-C}_8\text{-C}_2}$$$, where $$$\mathrm{C_N}$$$ is a convolutional layer with N 3x3 filters, P is a 2x2 max-pooling layer and $$$\mathrm{TC_K}$$$ is a transposed convolutional layer with K 2x2 filters. Each convolutional layer is followed by batch normalisation (BN) [7] and a rectified-linear unit (ReLU) [8]. We implement the networks using Pytorch [9]. We employ a 10-fold cross validation approach to train and test the networks. We repeat each 10-fold cross validation 5 times and report the average performance. We train the networks for 200 epochs and select the model which has the smallest loss on a validation set (30% of the training set). We use stochastic gradient descent (SGD) with a mini-batch size of 32, a constant learning rate of 1e-5, a momentum of 0.9 and a weight decay of 1e-3.
Results
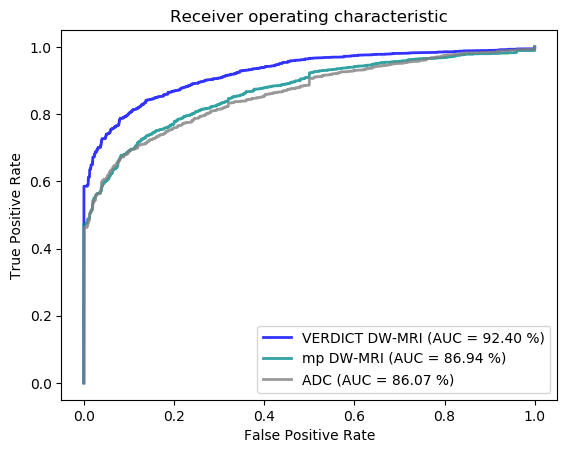
We train and test the network on labelled malignant and benign ROIs. Figure 3 shows the receiver operating characteristic (ROC) curves of MRI-UNet when training and test is performed on the raw VERDICT DW-MRI data, the ADC map and the raw DW-MRI data from the mp-MRI acquisition. The results show that MRI-UNet achieves better performance (an area under the curve (AUC) of 92.40%), when it is trained and tested on VERDICT DW-MRI data. When the network is trained and tested on the ADC map and the raw DW-MRI data from the mp-MRI acquisition, it achieves an AUC of 86.07% and 86.94% respectively.
Discussion
In this study we compare the classification performance obtained using the raw VERDICT DW-MRI data to those obtained using the ADC map and the raw DW-MRI data form the mp-MRI acquisition. The results indicate that VERDICT DW-MRI data combined with MRI-UNet achieves a higher performance and show promise as an alternative diagnostic tool for prostate cancer characterisation. However, the small number of patients in our cohort limits the current comparison. Future work will focus on a more thorough comparison using a larger number of patients.Acknowledgements
This research is funded by EPSRC grand EP/N021967/1. The Titan Xp used for this research was donated by the NVIDIA Corporation.References
- Kiraly, A.P., et al.: Deep convolutional encoder-decoders for prostate cancer detection and classification. MICCAI (2017)
- Mehrtash, A., et al.: Classification of clinical significance of MRI prostate findings using 3D convolutional neural networks. Proc. SPIE Int. Soc. Opt. Eng. (2017)
- Panagiotaki, E., et al.: Microstructural characterisation of normal and malignant human prostate tissue with vascular, extracellular, and restricted diffusion for cytometry in tumours magnetic resonance imaging. Invest. Radiol. 50, 218–227 (2015)
- Barentsz, J.O., et al: ESUR prostate MR guidelines 2012. Eur. Radiol. 22, 746–757 (2012)
- Panagiotaki, E., et al.: Optimised VERDICT MRI protocol for prostate cancer characterisation. ISMRM (2015)
- Ronneberger, O., et al.: U-Net: Convolutional networks for biomedical image segmentation. MICCAI (2015)
- Ioffe, S., et al.: Batch normalisation: accelerating deep network training by reducing internal covariate shift. ICML (2015)
- Nair, V., et al.: Rectified linear units improve restricted Boltzmann machines. ICML (2010)
- Paszke, A., et al.: Automatic differentiation in Pytorch. Autodiff Workshop, NIPS (2017)
Figures