4560
3D Radial Phase Encoded Flip Angle Imaging at Ultra-High Field Strength1Physikalisch-Technische Bundesanstalt (PTB), Braunschweig and Berlin, Germany, 2Division of Imaging Sciences and Biomedical Engineering, King's College London, London, United Kingdom
Synopsis
In this work a novel 3D flip angle (FA) mapping method is introduced which combines the advantages of the AFI pulse sequence (3D, low SAR) with the motion robustness of a radial phase encode acquisition scheme. Mapping the FA is needed for human body imaging at 7 tesla to improve image quality and assessment of quantitative results. Therefore, we combined an interleaved acquisition of two FIDs, S1 and S2, acquired for different repetition times TR1 and TR2 with radial phase encode trajectory. In this study we validated this new sequence with a body phantom and in two in-vivo scans. Similar results to cartesian reference scans were obtained and reasonable motion resolved abdominal FA maps were acquired.
Introduction
A major challenge at ultra-high fields (UHF) is the inhomogeneity of the transmit radio frequency fields (B1+) with its concomitant flip angle (FA) and contrast variations. Fast and reliable FA mapping sequences are an indispensable to mitigate this problem1,2. Among existing methods to measure the FA3-5 the actual flip angle imaging (AFI)5 has some advantages since it covers a 3D volume and generates low SAR. In the body, however, AFI is challenging, since its long acquisition times result in respiration induced artifacts, which affects FA quantification. Therefore, a different 2D technique has been presented recently for the heart, but SAR levels limit applications at 7T4. In this work, we propose a novel method to acquire 3D FA maps in the presence of respiratory motion, which is applicable at 7T. Our approach combines conventional AFI with a motion-robust radial phase-encode (RPE) sampling scheme6,7 that allows for self-navigation. The method was tested and validated in a body phantom and in-vivo. FA distributions were compared to reference FA maps obtained using a conventional cartesian AFI. Reasonable respiratory-motion resolved FA maps of the abdomen were acquired.Methods
RPE-AFI sequence description:
To enable AFI, a 3D RPE spoiled gradient-echo (GRE) sequence6,7 with golden-angle sampling increments was modified to allow the interleaved acquisition of two FIDs, S1 and S2, acquired for different repetition times TR1 and TR2 = nTR1 (n=3, 5) (Fig.1a+b). FA maps can be calculated as $$\alpha(r)=\frac{nr-1}{n-r}\,,$$ where $$$r=\text{S2}/\text{S1}$$$ and $$$n=\text{TR2}/\text{TR1}$$$5.
Phantom scans
The AFI-RPE sequence was tested at 3 Tesla (Magnetom Verio, Siemens, Germany) using a body-phantom filled with a polyvinylpyrrolidone (PVP)-water solution ($$$\sigma=0.56\,\text{S/m},\,\epsilon=55$$$). The resulting FA maps were quantitatively compared to the ones obtained with a 3D cartesian AFI sequence matched to the RPE-AFI. Cartesian and RPE-AFI were derived from different sequences. Nominal FA was 60° in all cases. Sequence parameters are listed in Tab.1.
In-vivo scan
Two healthy subjects (HS1 and HS2) were scanned according to a local IRB approved protocol. HS1 was scanned at 7T (Magnetom 7T, Siemens, Germany), and HS2 at 3T. In HS1, the RPE-AFI sequence was applied to the human brain (i.e. a region not affected by respiration) and compared to a cartesian matched AFI protocol (Tab.1).
For HS2, RPE-AFI was applied to the abdomen to quantify the FA in the presence of respiratory motion. To ensure sufficient k-space center update for self-navigation, a slab selective excitation was used in the RL direction in this preliminary work to achieve a temporal resolution of $$$\Delta t=1.2\,\text{s}$$$ but only central slices were used for FA comparisons. During reconstruction, self-navigation was used as in 7. Respiratory motion was derived from all readouts crossing k-space center and data was binned into three different respiratory motion states. Subsequently, a 3D image was reconstructed for each motion state using NUFFT8.
Evaluation
All acquired maps were manually masked, FA maps across scans were compared pixel wise in a ROI (Phantom: (50x50x100mm)³, Brain: (84x84x84mm)³) placed in the center of the phantom/brain. Wilcoxon signed rank tests were performed in the ROI. In the abdominal scan the mean FA was calculated in an ROI covering the human liver for exhale and inhale.
Results
Figure 2a+b shows the FA distributions in the body phantom obtained for both sequences and Bland-Altman plots showing voxel-wise FA differences. A linear trend towards a larger difference ($$$\alpha_\text{rpe}-\alpha_\text{cartesian}$$$) is observed in the body phantom with increasing mean flip angle as shown in Fig.2b. This effect is not observed in the FA maps obtained in the human brain at 7T (Fig.3). Here only a moderate mean difference of $$$\overline{\Delta\alpha}_\text{H}=-0.9°\pm3.4°$$$ was found between both AFI sequence variants but differences were statistically significant. Artefact free images for each of the two TRs were obtained from a free breathing abdominal scan and reasonable FA maps could be reconstructed for two motion states. However, differences in FA distribution between inhale and exhale are visible. The mean FA in an ROI covering the liver changed from $$$\bar{\alpha}_\text{exhale}=51°$$$ to $$$\bar{\alpha}_\text{inhale}=56°$$$ between exhale and inhale.Discussion
In this work, an RPE sampling scheme was modified with an AFI pulse sequence to acquire respiratory motion robust FA maps. Differences in mean values were observed particularly in the phantom scan between the sequences, which will be further investigated. However, despite significant FA differences found in the human body, the mean difference value of $$$\overline{\Delta\alpha}_\text{H}=-0.9°$$$ was moderate. The preliminary abdominal results show slight differences in FA between inhale and exhale, which has also been observed by ref. 9 and 10. Further investigation will include a modified acquisition scheme to allow for a higher update rate of self-navigator as well as higher acceleration factors. Further, applications to 7T will be investigated.Acknowledgements
Support of the German Research Foundation (DFG), project number GRK 2260, BIOQIC is acknowledged.References
1. Kerr, Etezadi-Amoli, Fautz, Vogel, Gross, Zhu, Pauly. Proc ISMRM 16, p. 617 (2008)
2. Padormo, Beqiri,Hajnal,Malik. NMR in Biomedicine 29,1145-1161 (2016)
3. Nehrke, Börnert. Magentic Resonance in Medicine 68, 1517-1526 (2012).
4. Weingärtner, Zimmer, Metzger, Uğurbil, Van de Moortele, Akçakay. Magentic Resonance in Medicine 78, 670-677 (2017).
5. Yarnykh. Magentic Resonance in Medicine 57, 192-200 (2007).
6. Prieto, Uribe, Razavi, Atkinson, Schaeffter. Magentic Resonance in Medicine 68, 514-526 (2010).
7. Buerger, Clough, King, Schaeffter, Prieto. Trans Med Imaging 31, 805-815 (2012).
8. Jackson, Meyer, Nishimura, Macovski. IEEE Transactions on Medical Imaging10, 473–478,(1991).
9. Nehrke, Bornert. Proc. ISMRM : 3356 (2012)
10. Schmitter, Wu, Uğurbil, Van de Moortele. Magnetic Resonance in Medicine 74, 1291-1305
Figures
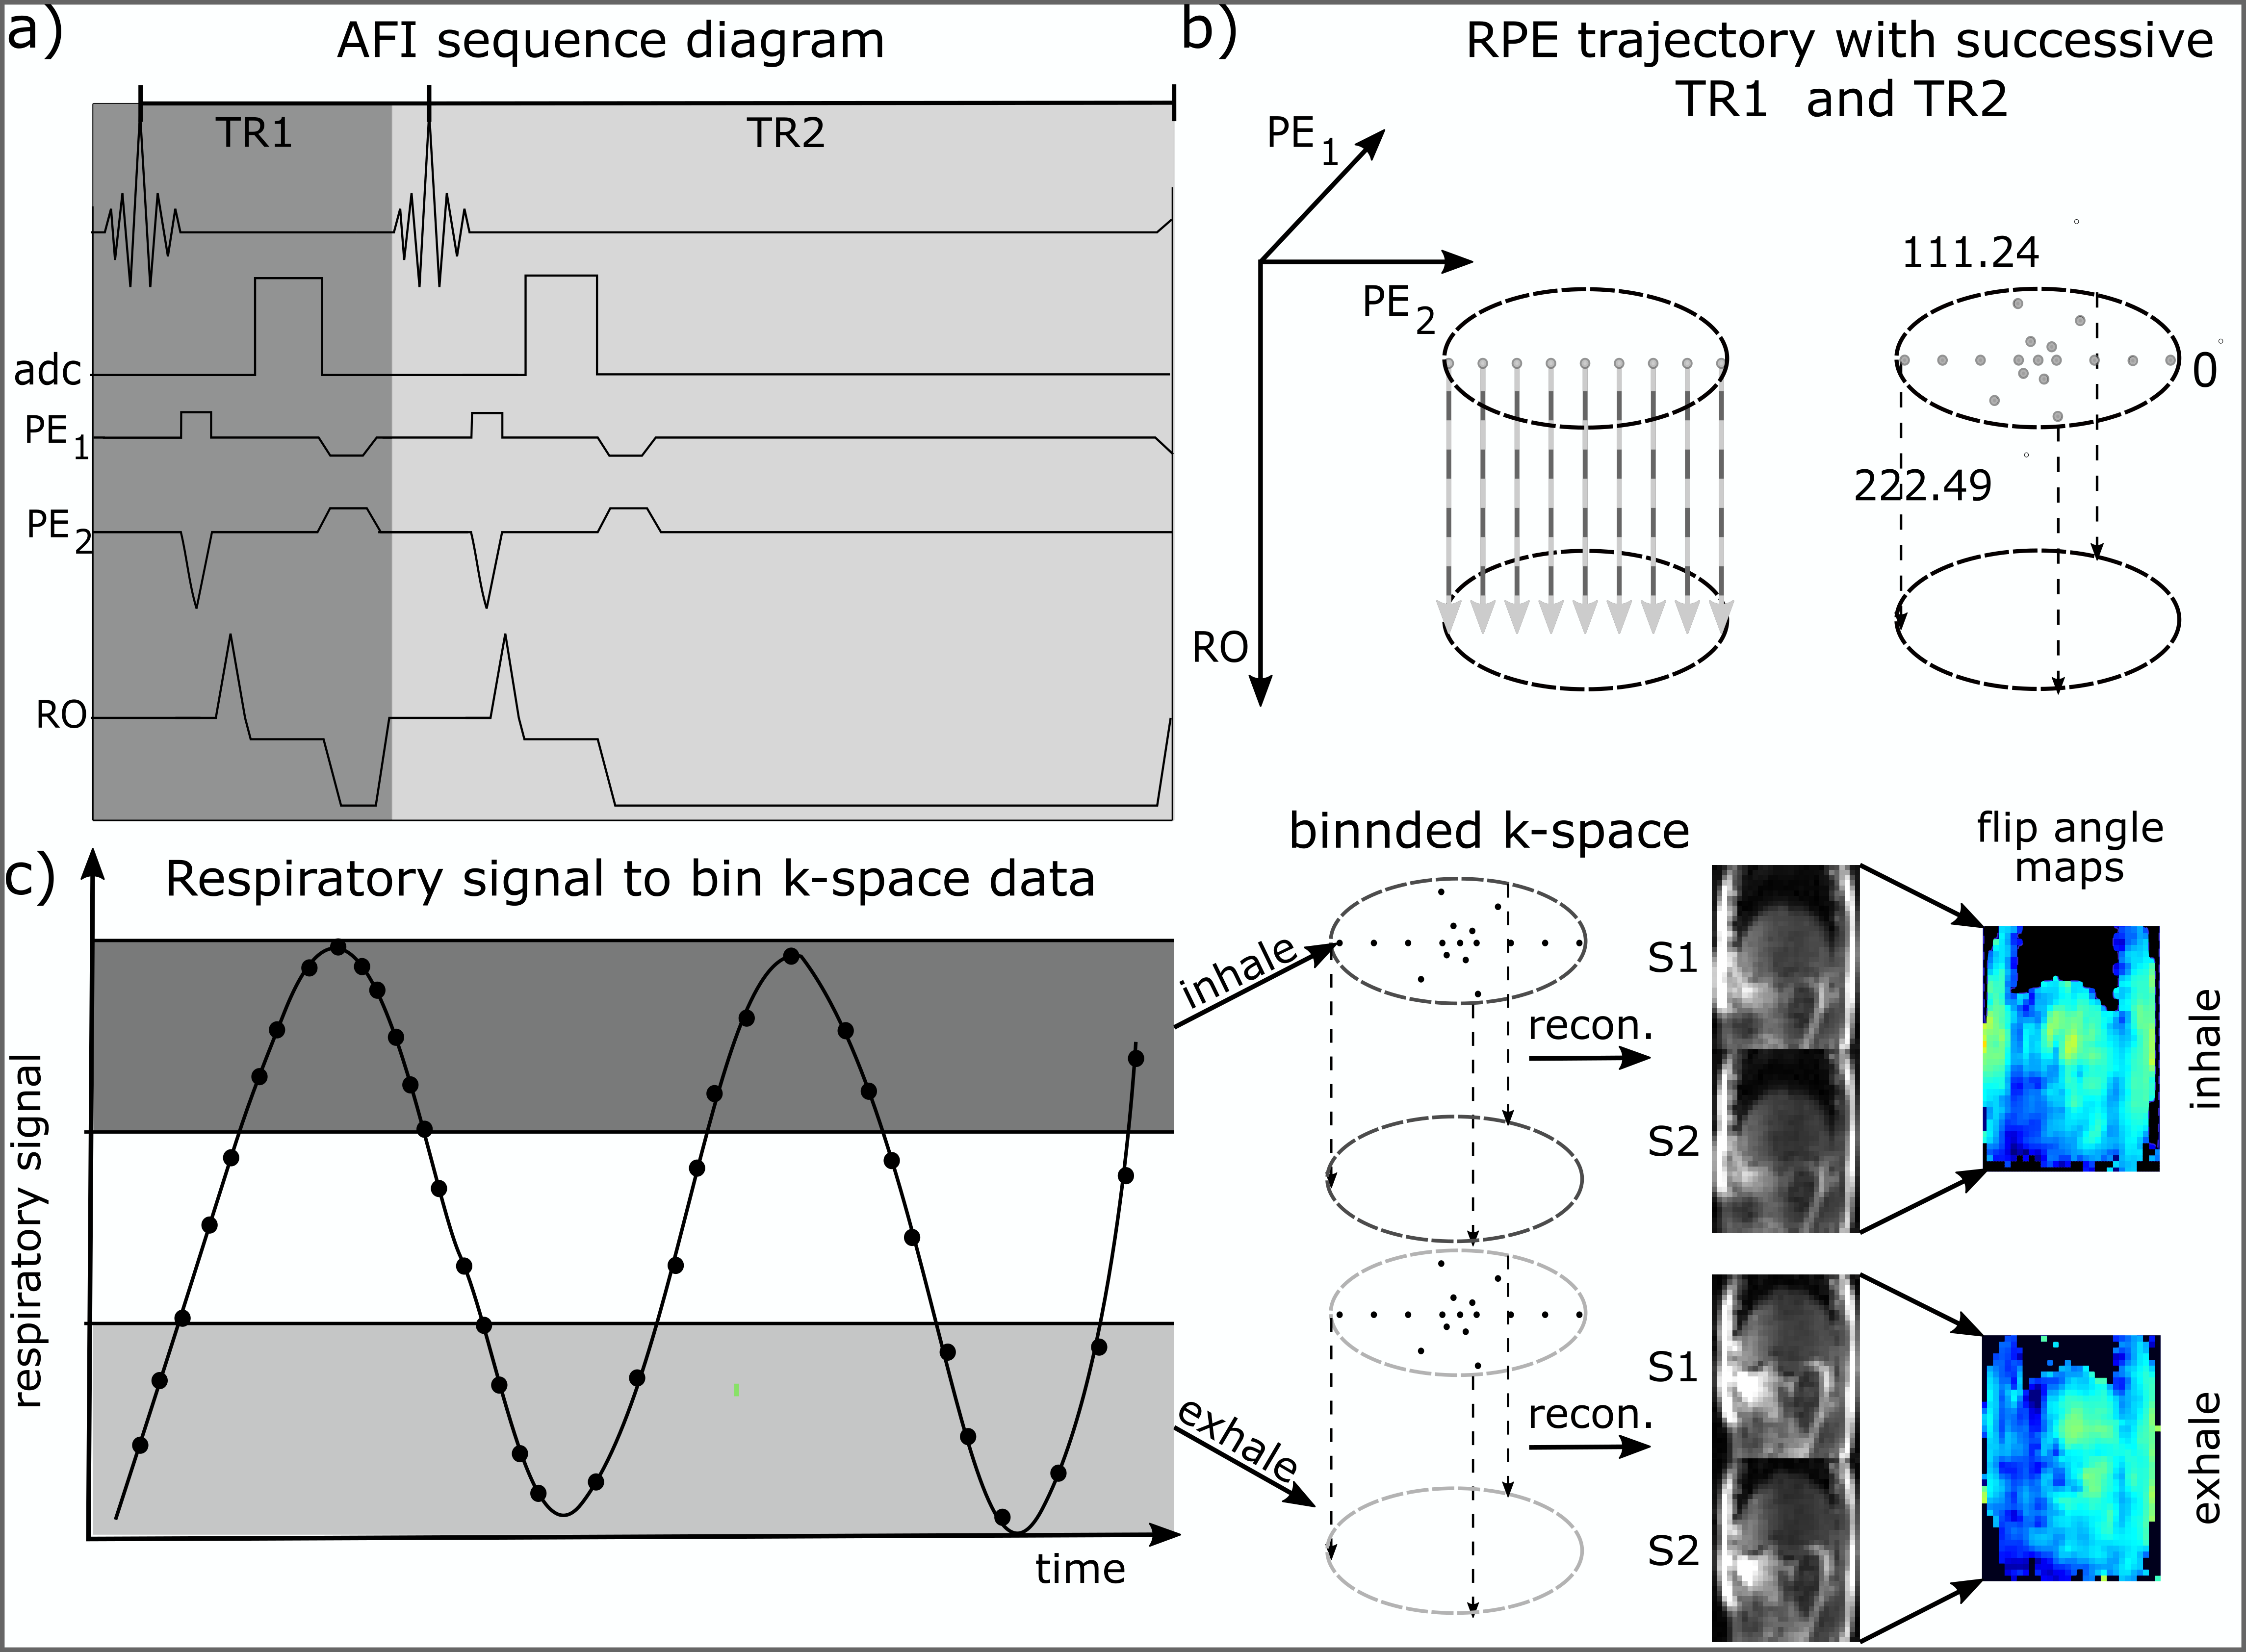
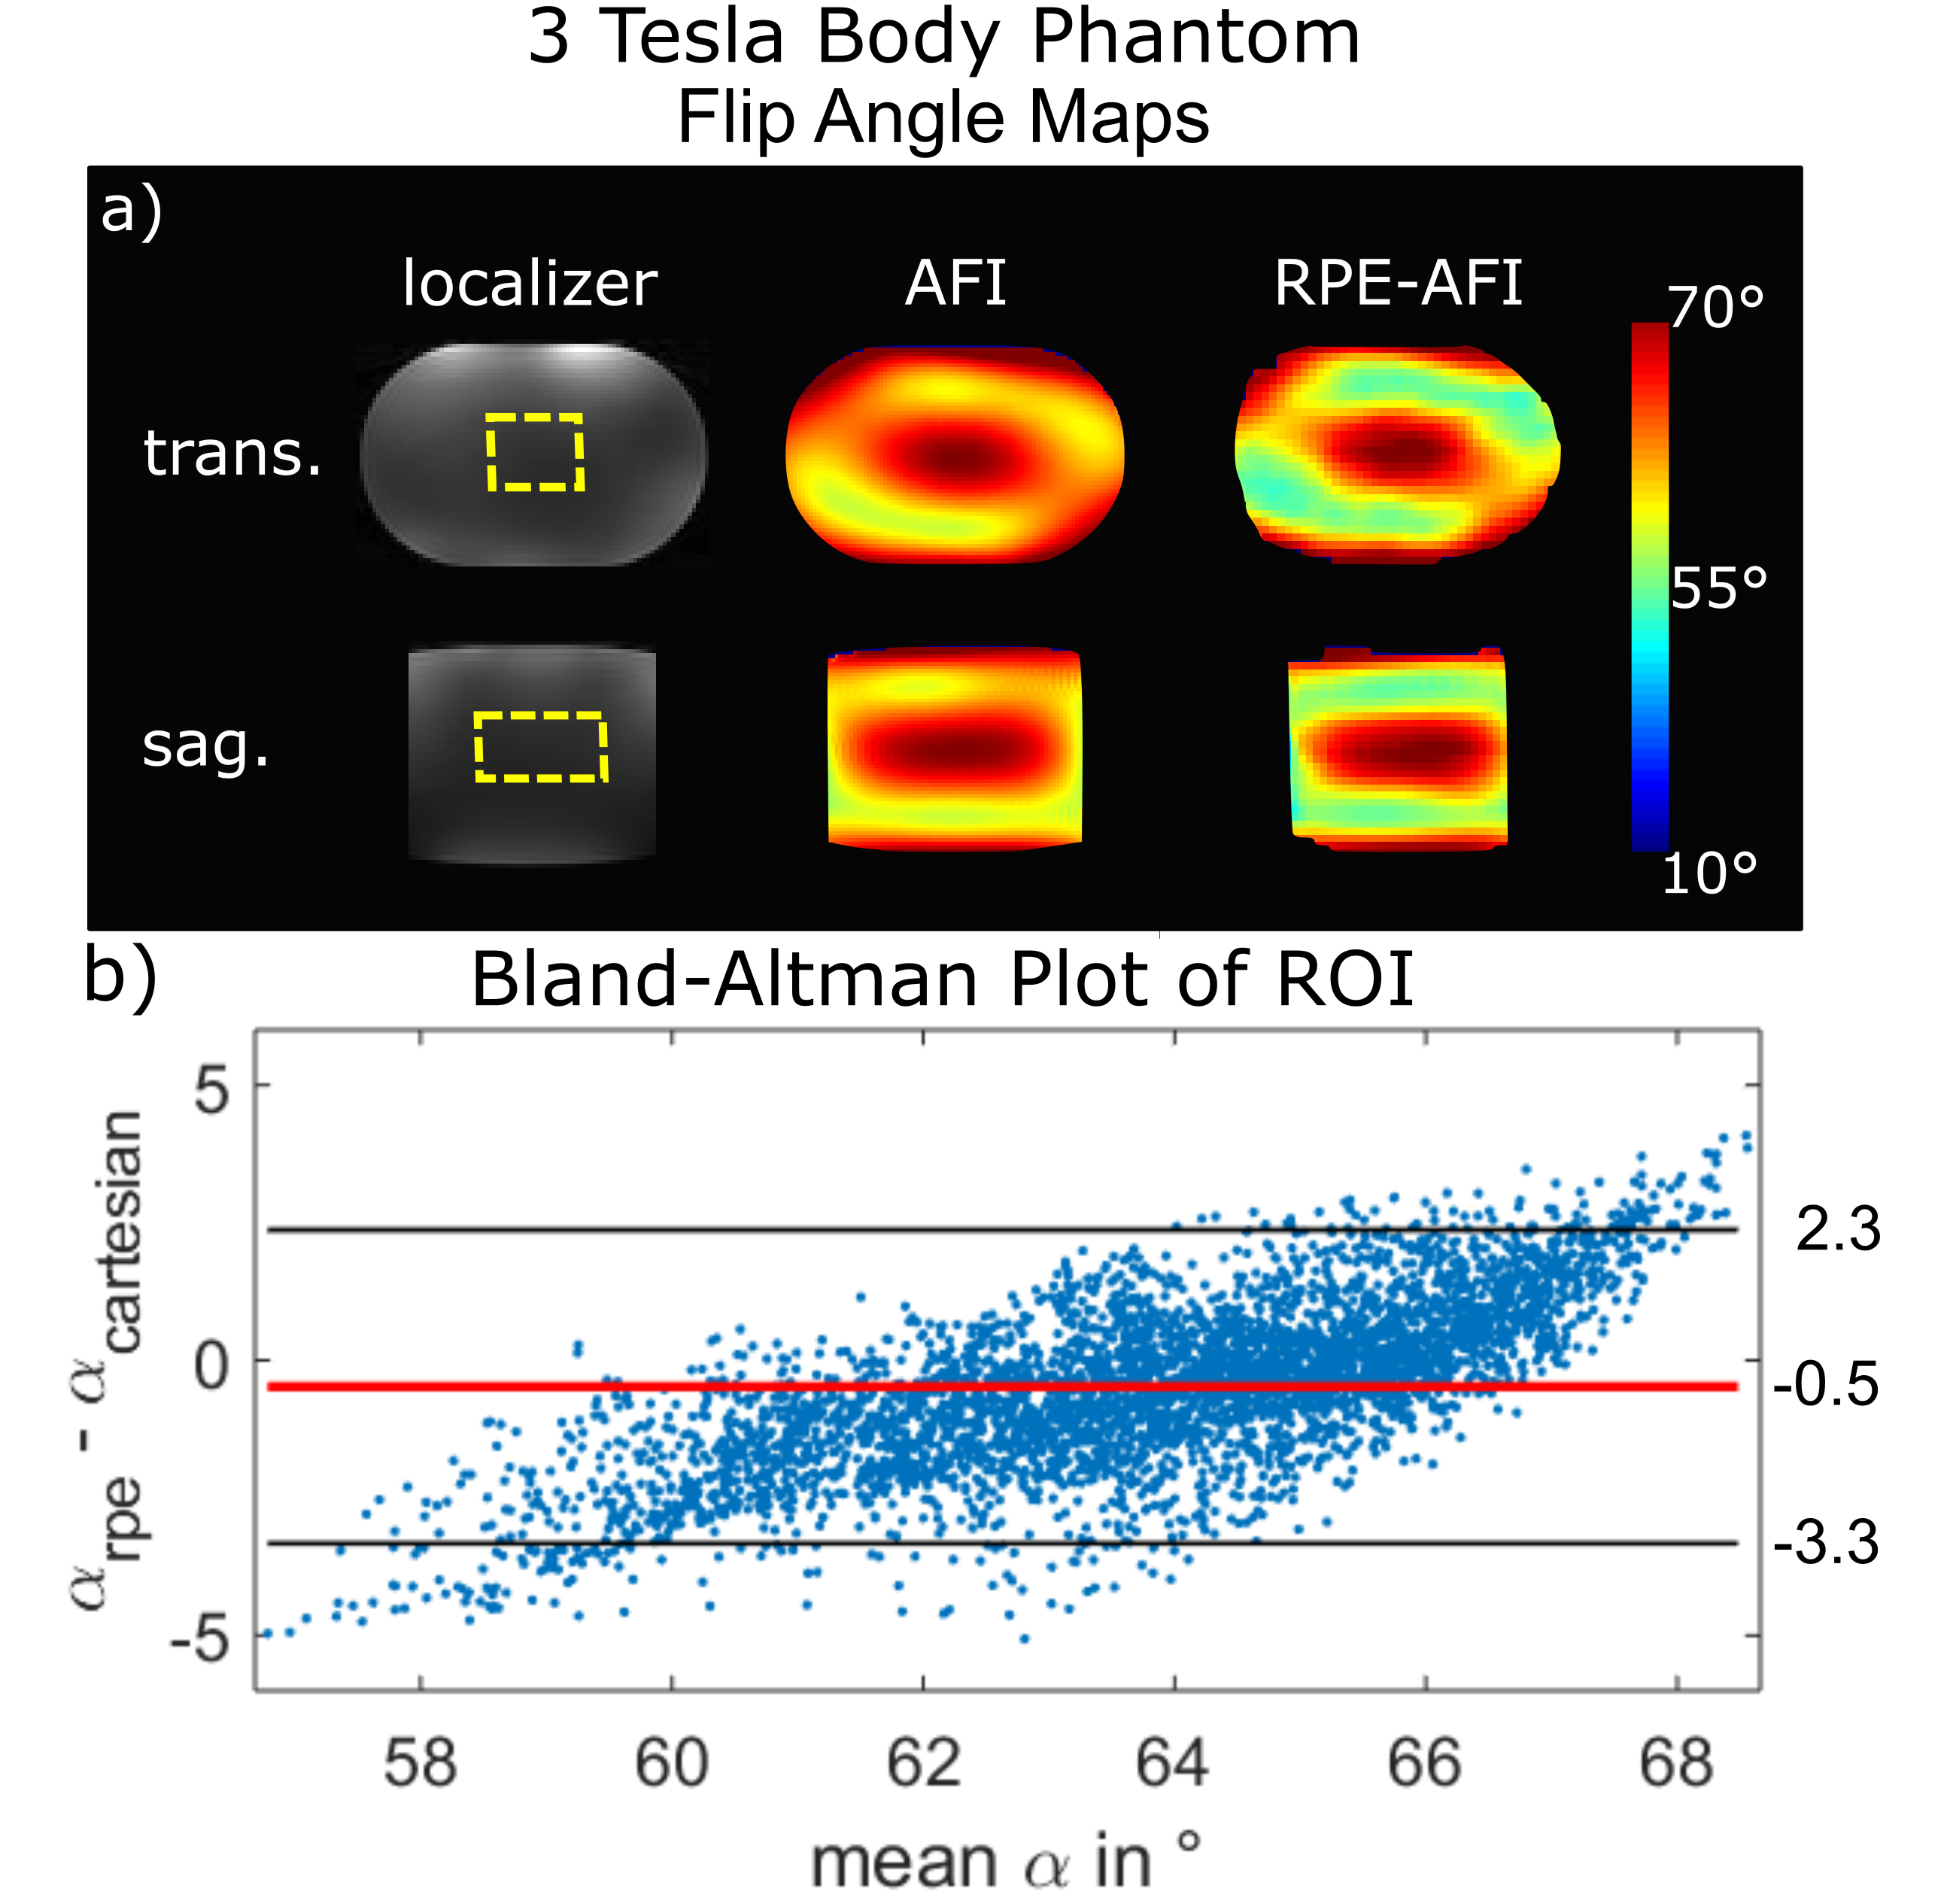
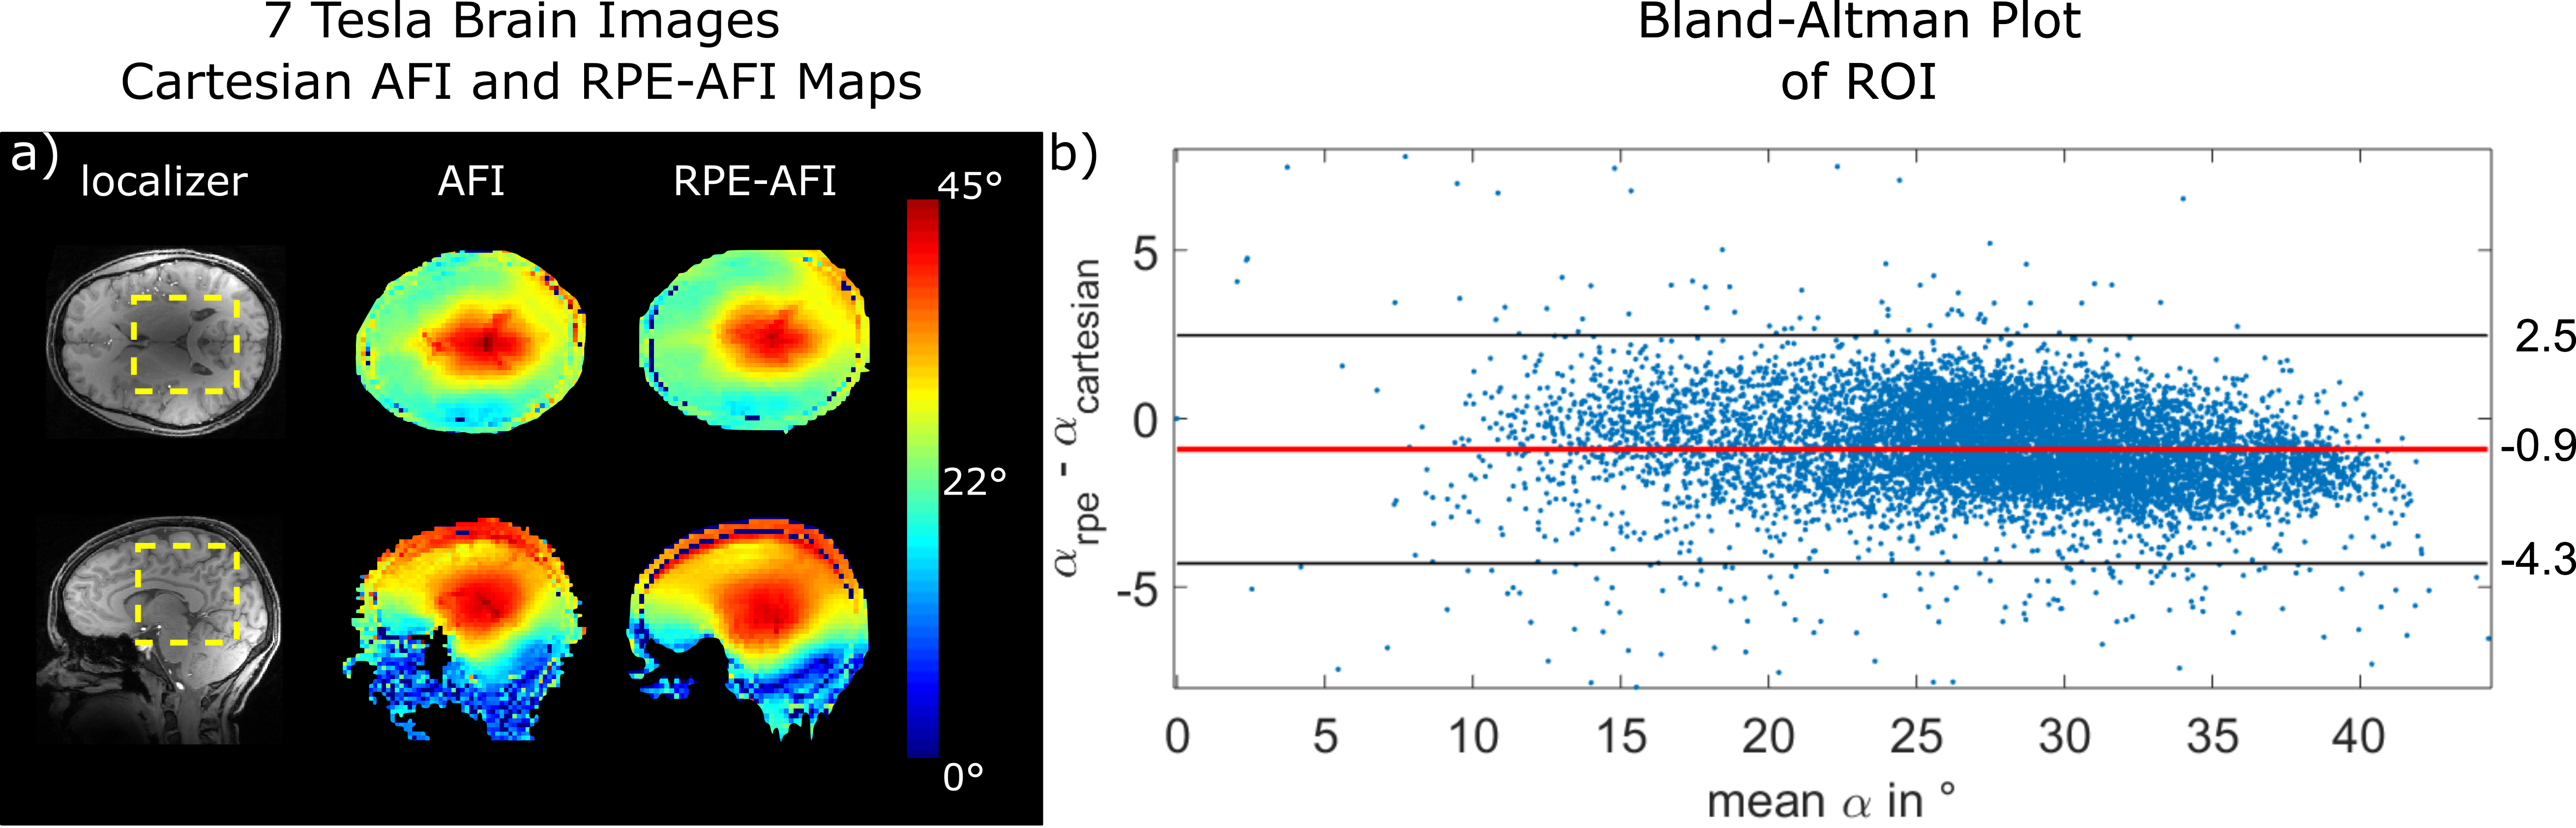
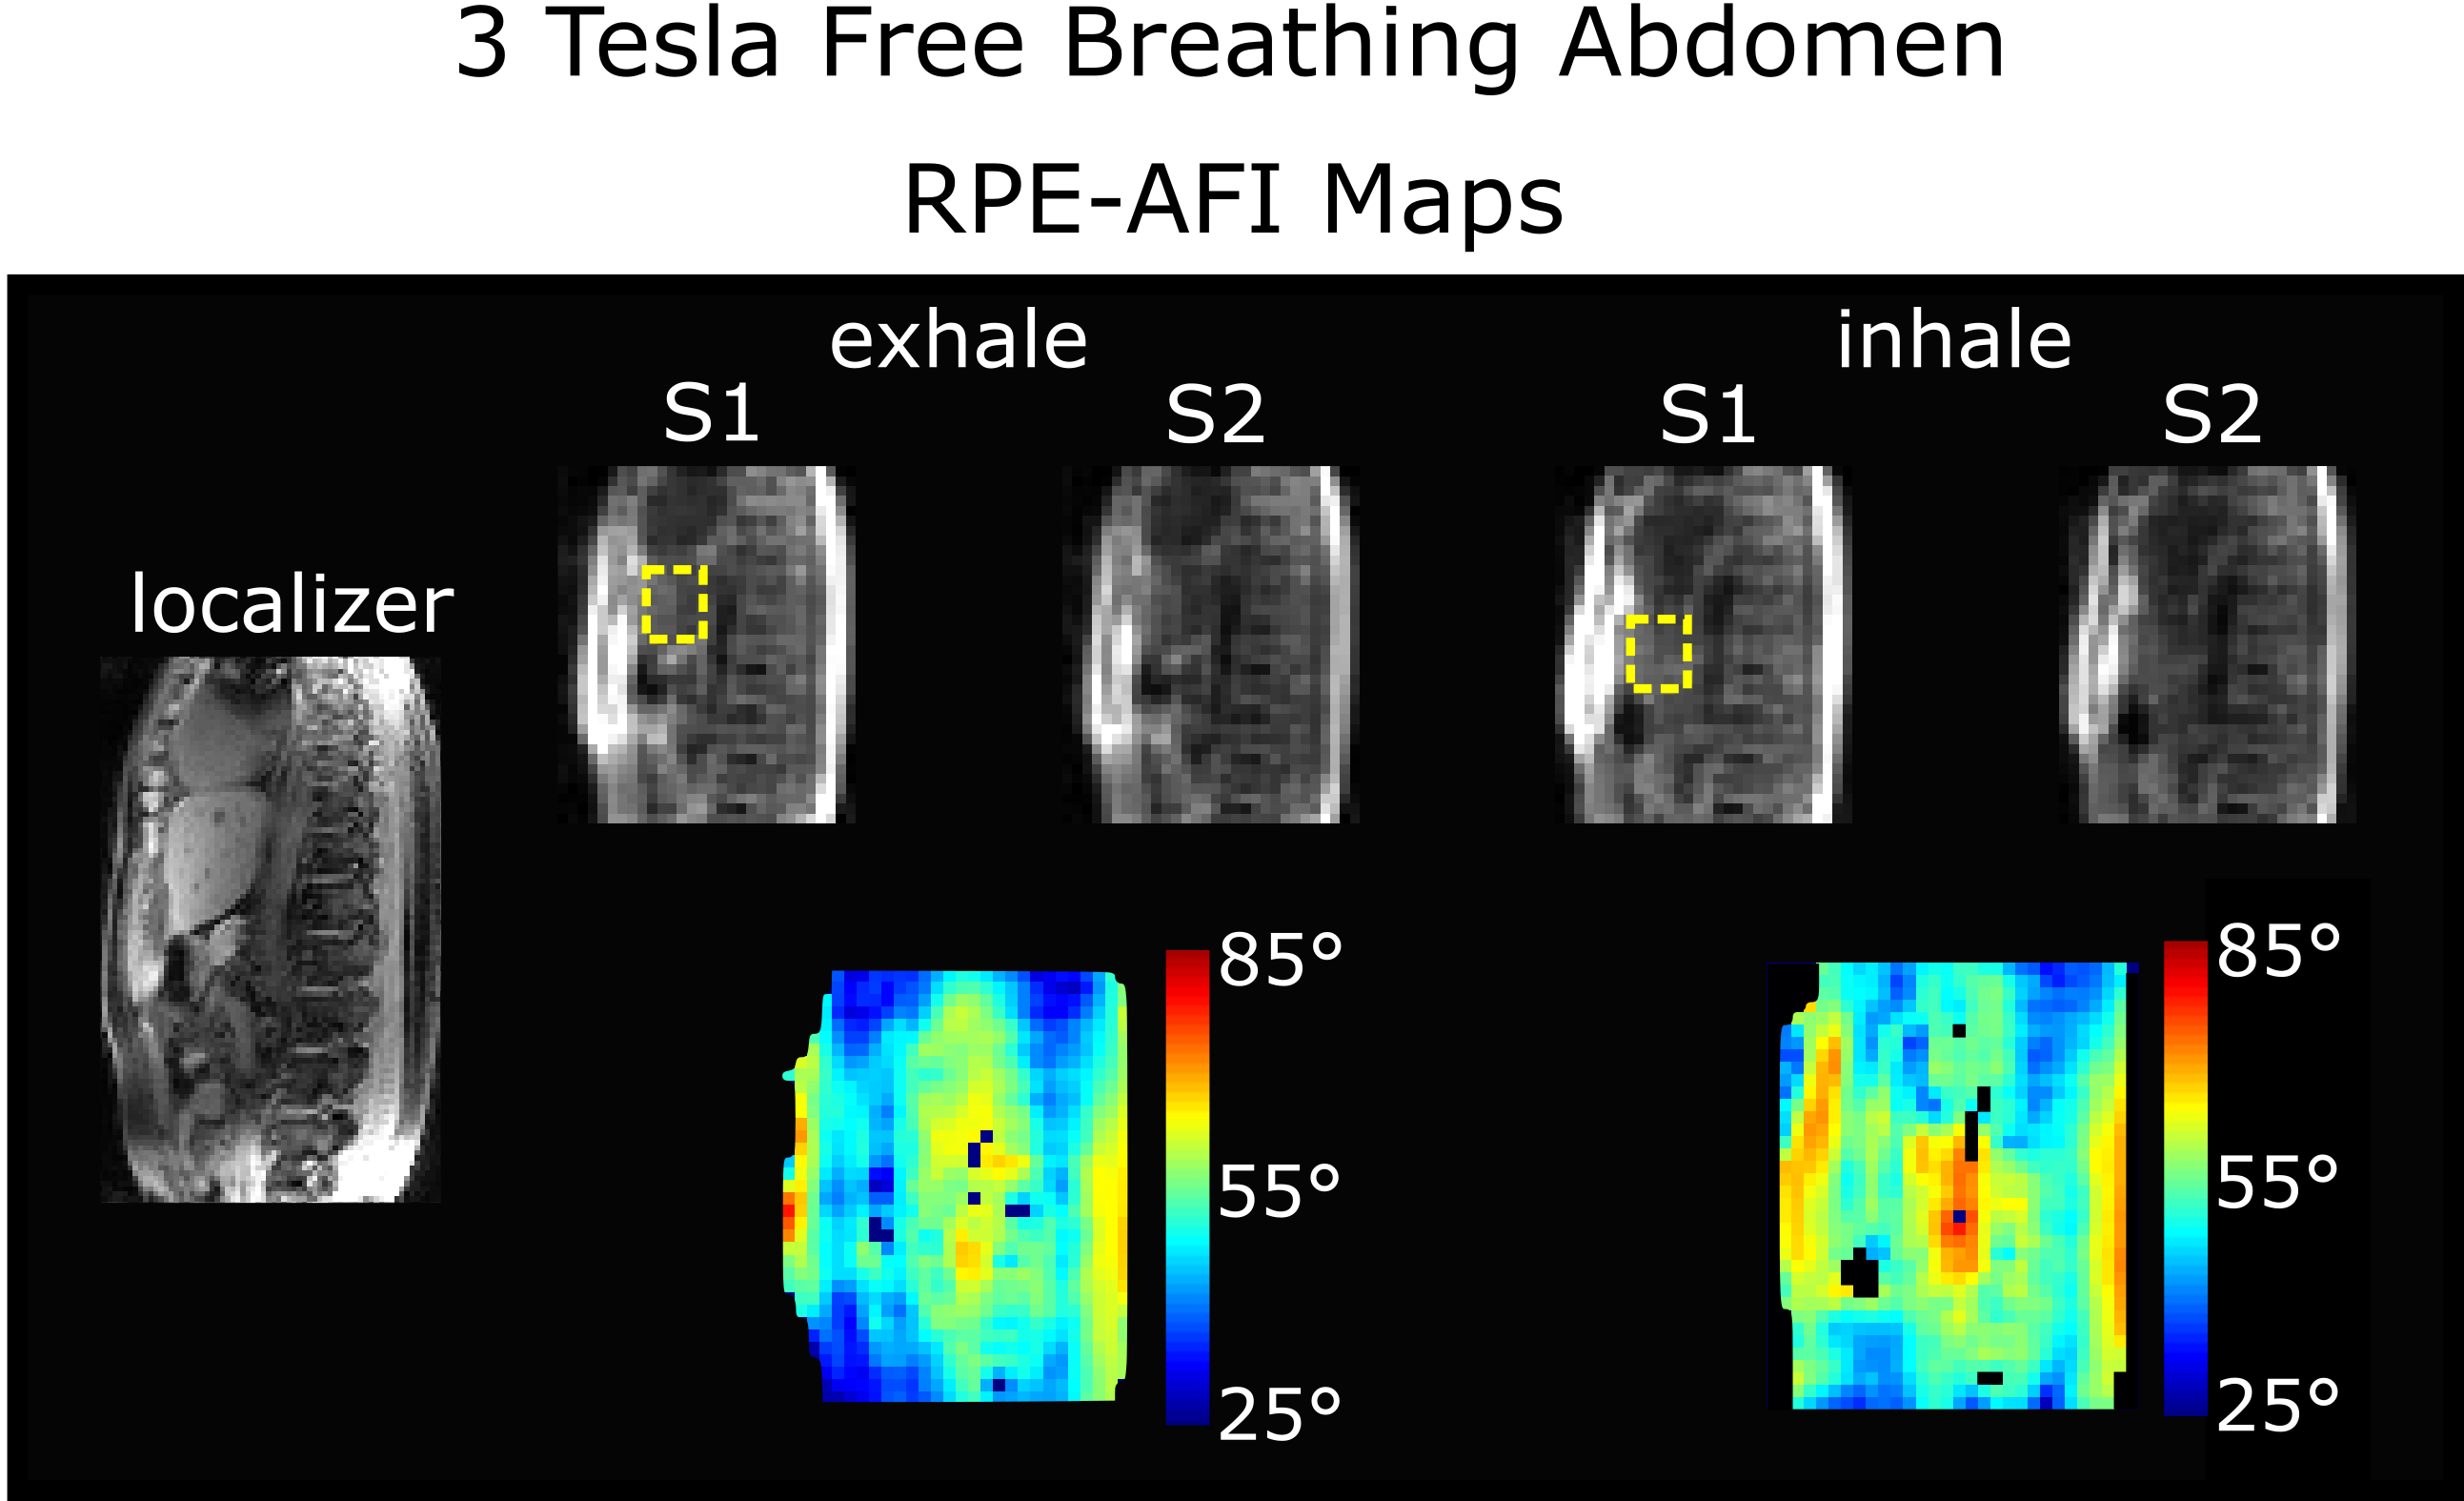
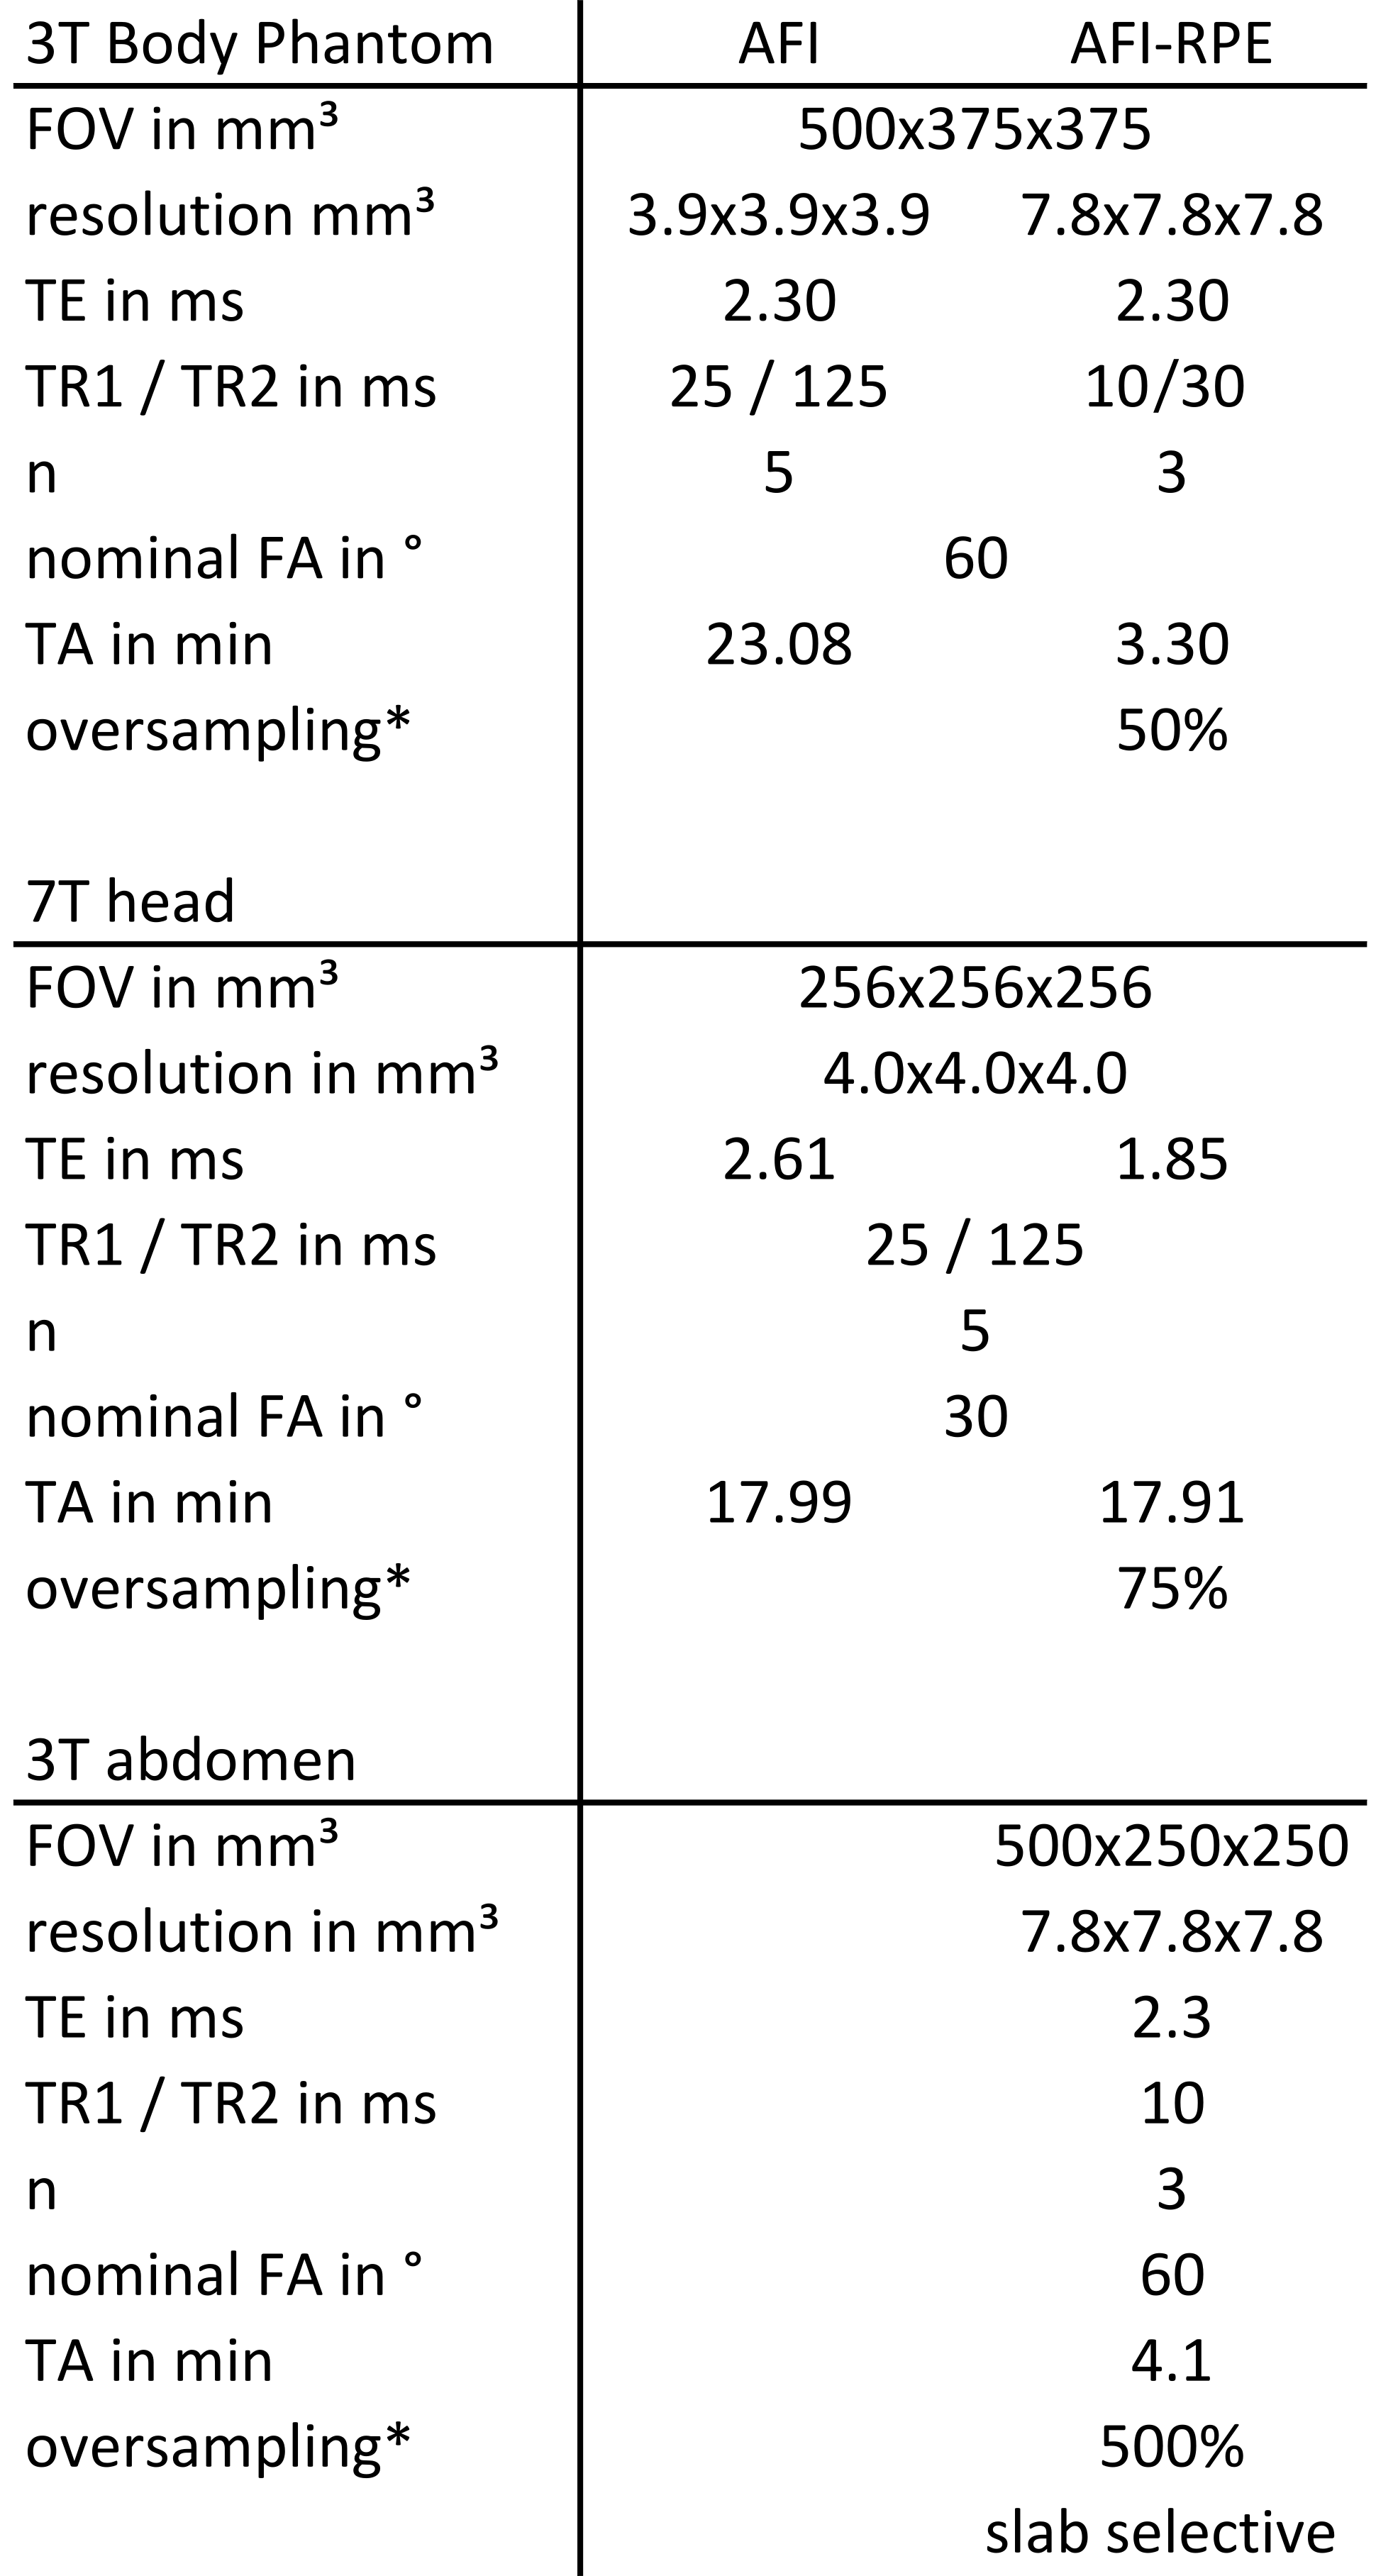
Table 1 Sequence parameter for cartesian AFI and RPE-AFI sequence. Body phantom, 7 Tesla brain and 3 Tesla abdomen examination.
*percentage
of additionally aquiered phase encode points with respect to nyquist criterion