4463
MR imaging of a 3D-printed bioreactor with a dedicated radiofrequency coil for cellular level validation of quantitative MR metrics1National Institute of Standards and Technology, Boulder, CO, United States, 2Department of Physics, University of Colorado Boulder, Boulder, CO, United States, 3Department of Mechanical Engineering, University of Colorado Boulder, Boulder, CO, United States
Synopsis
Quantitative MRI methods have the potential to push the clinical standard of care towards quantitative diagnosis. However, controlled systems are needed to study the effects of underlying cellular properties on the MRI signal to validate quantitative MRI measures. To meet this need, our group previously developed an MR-compatible bioreactor to monitor cell behavior using MRI validated with optical microscopy. The present work develops a dedicated RF coil for improved MR imaging of the bioreactor and uses it to explore the effects of cell culture on T1 and T2 in our system.
Introduction
Quantitative MRI methods such as diffusion and relaxation mapping have the potential to push the clinical standard of care from qualitative assessment to quantitative diagnosis 1. Due to the relatively large voxel size of MRI compared to the size of a cell, it is difficult to relate the signal in a single voxel to underlying tissue properties. Controlled systems are needed to study the effects of cellular distribution on the MRI signal and validate quantitative MRI measures. To meet this need, our group previously developed an MR-compatible bioreactor to monitor cell behavior using MRI validated with optical microscopy 2. This system was limited in SNR by a non-dedicated volume coil and had not yet been used for quantitative MR imaging. The present work develops a dedicated 34 mm diameter Helmholtz radiofrequency (RF) coil for improved MR imaging of the bioreactor and uses it to explore the effects of cell culture on T1 and T2 relaxation in our bioreactor system.Methods
Dedicated Helmholtz Coil:
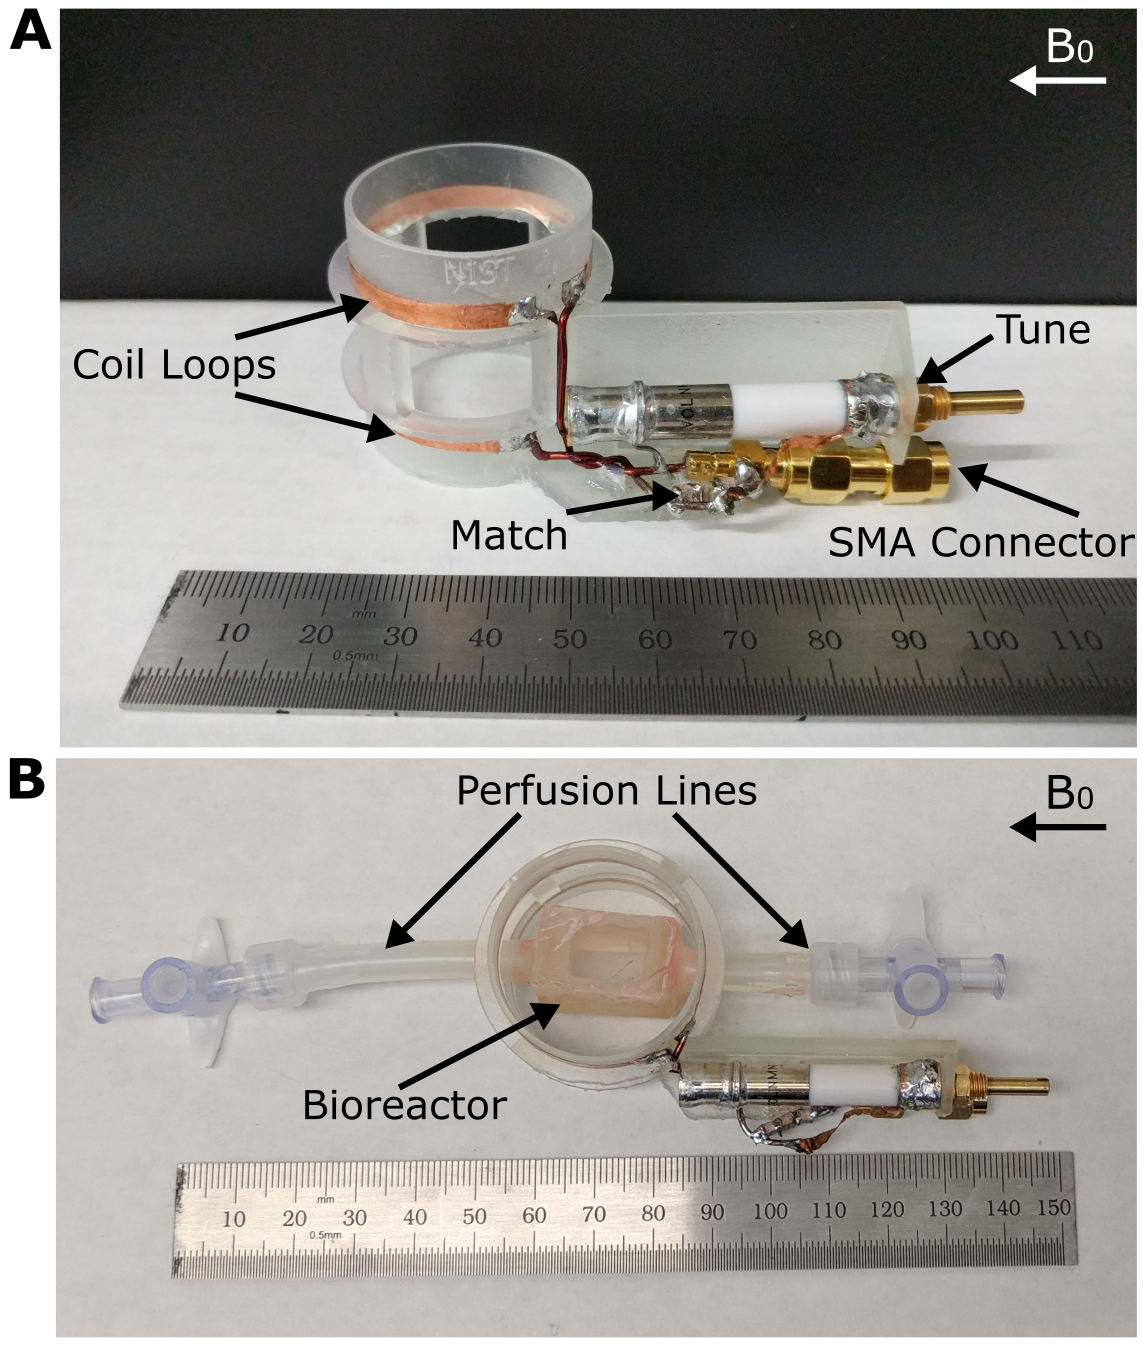
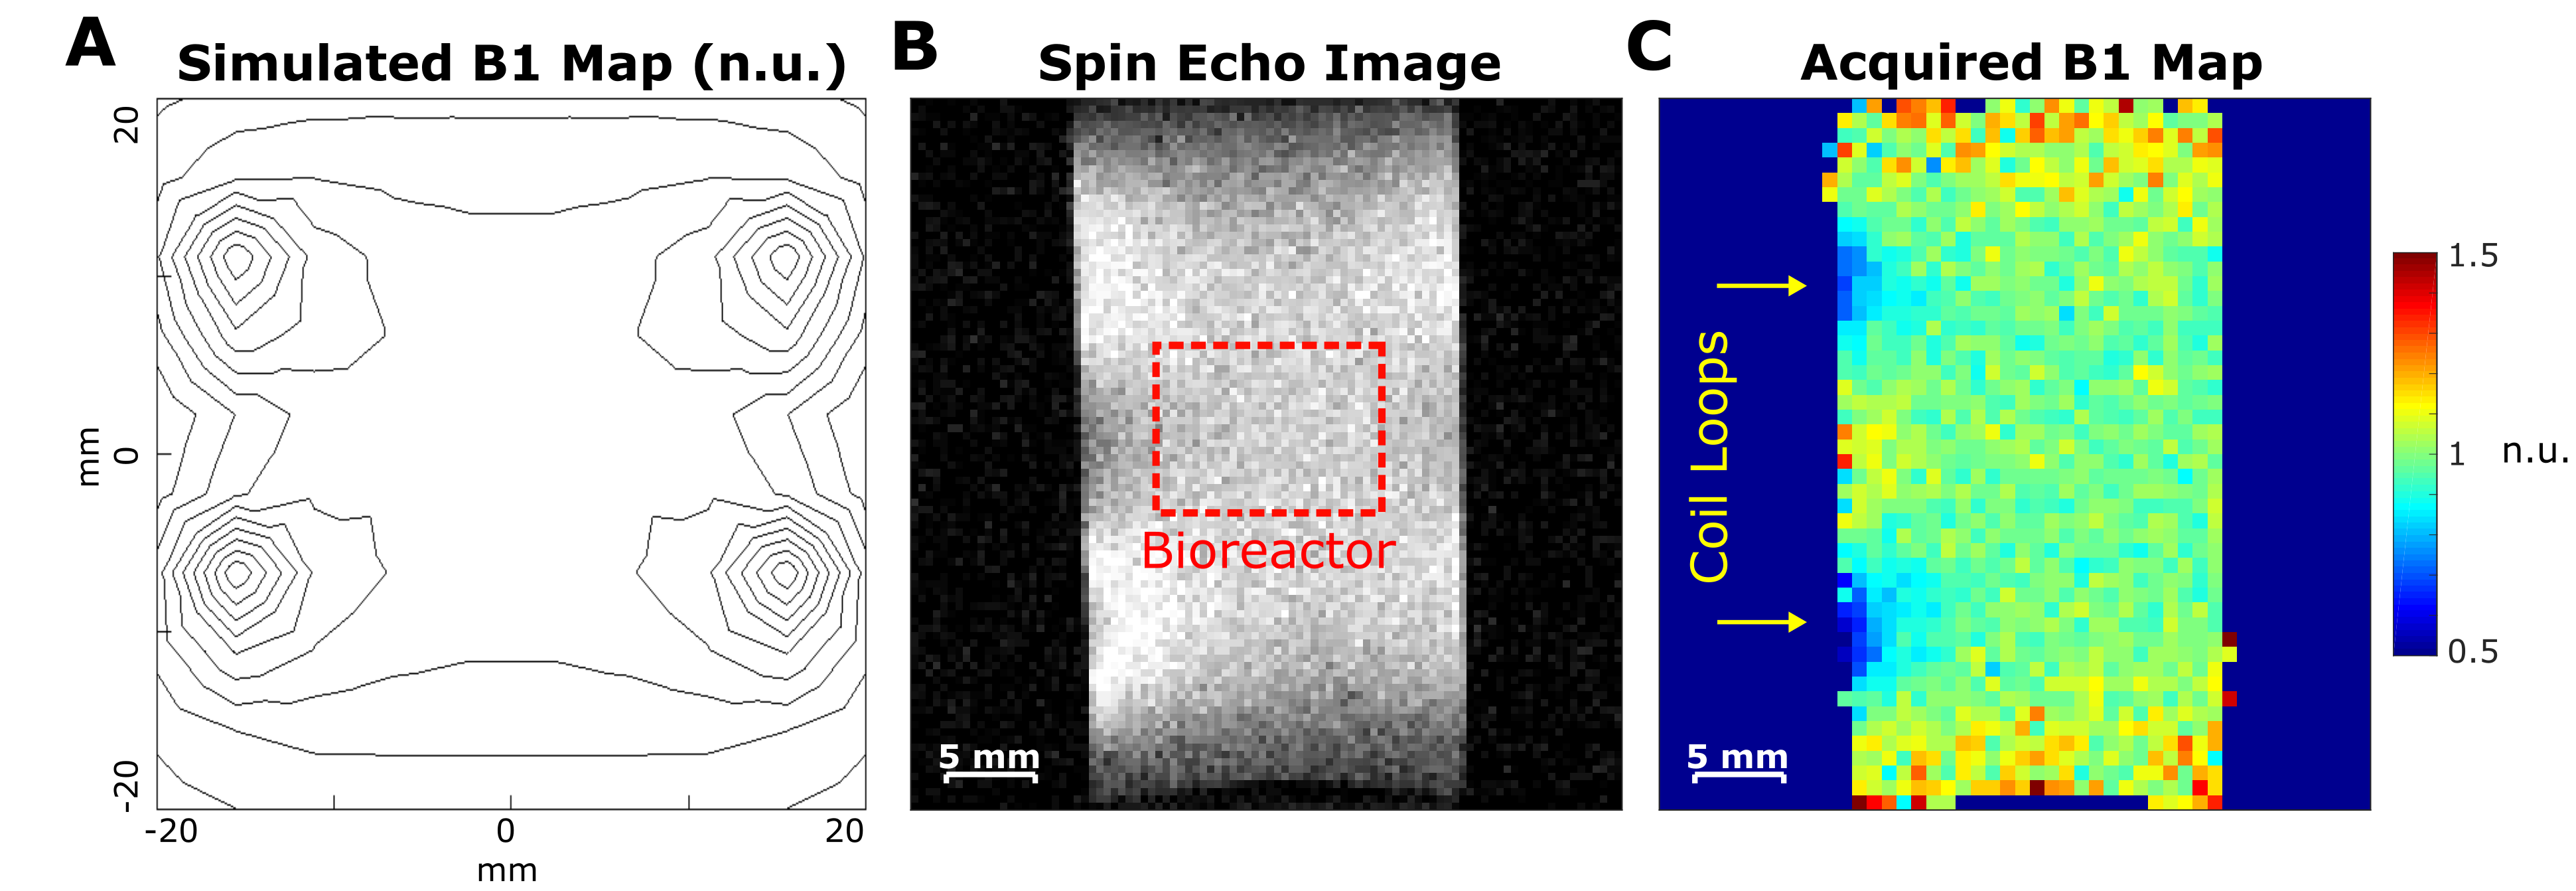
A coil former was designed with CAD software (Autodesk Inc, San Rafael, CA, USA) and 3D-printed out of a clear photopolymer resin (Formlabs, Somerville, MA, USA). The coil is composed of two 34 mm diameter parallel loops of 3 mm wide copper tape, spaced 17 mm apart. The loops were connected in series with insulated 1 mm diameter copper wire, matched to 50 Ohms with non-magnetic chip capacitors (0.33 pF), and tuned to 126.9 MHz with a variable capacitor (2-15 pF). The expected B1 field from this configuration was simulated (BiotSavart, Ripplon, BC, Canada) and compared to B1 maps obtained with the constructed coil in a water tube at 3T.
Quantitative MRI of bioreactors:
Three bioreactors were 3D-printed out of biocompatible resin and filled with 1% functionalized hyaluronic acid/PEG-diacrylate hydrogel 3. Two of the bioreactors were seeded with bovine chondrocytes and perfused with saline 4. Cells proliferated for four days after which cells in one bioreactor were fixed with paraformaldehyde. All bioreactors were imaged at room temperature on a 3T scanner (Agilent, Santa Clara, CA, USA) with the developed MR coil. T1 maps were acquired using an inversion recovery sequence and T2 maps were acquired using a multi-echo fast-spin-echo sequence.
Results
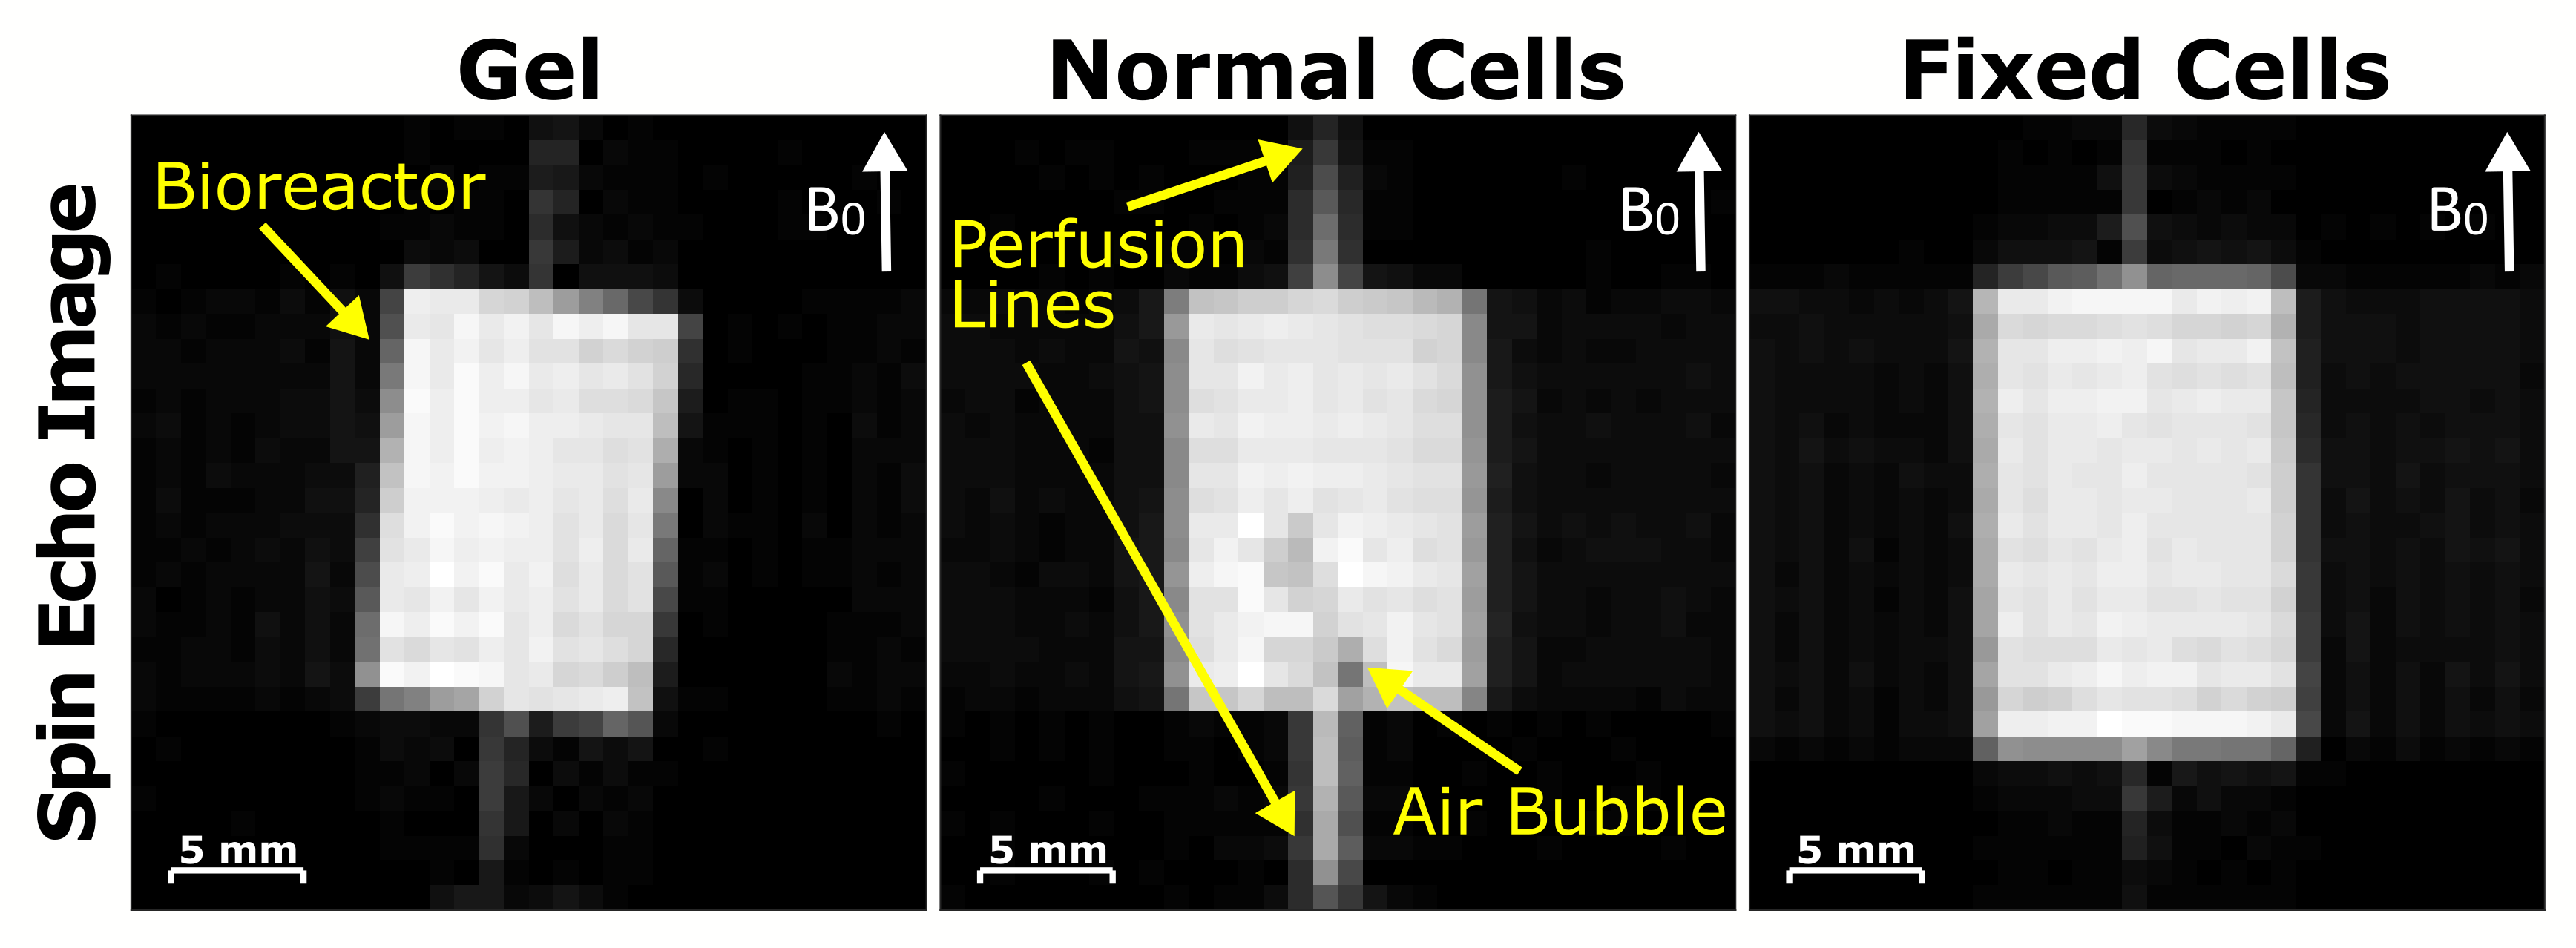
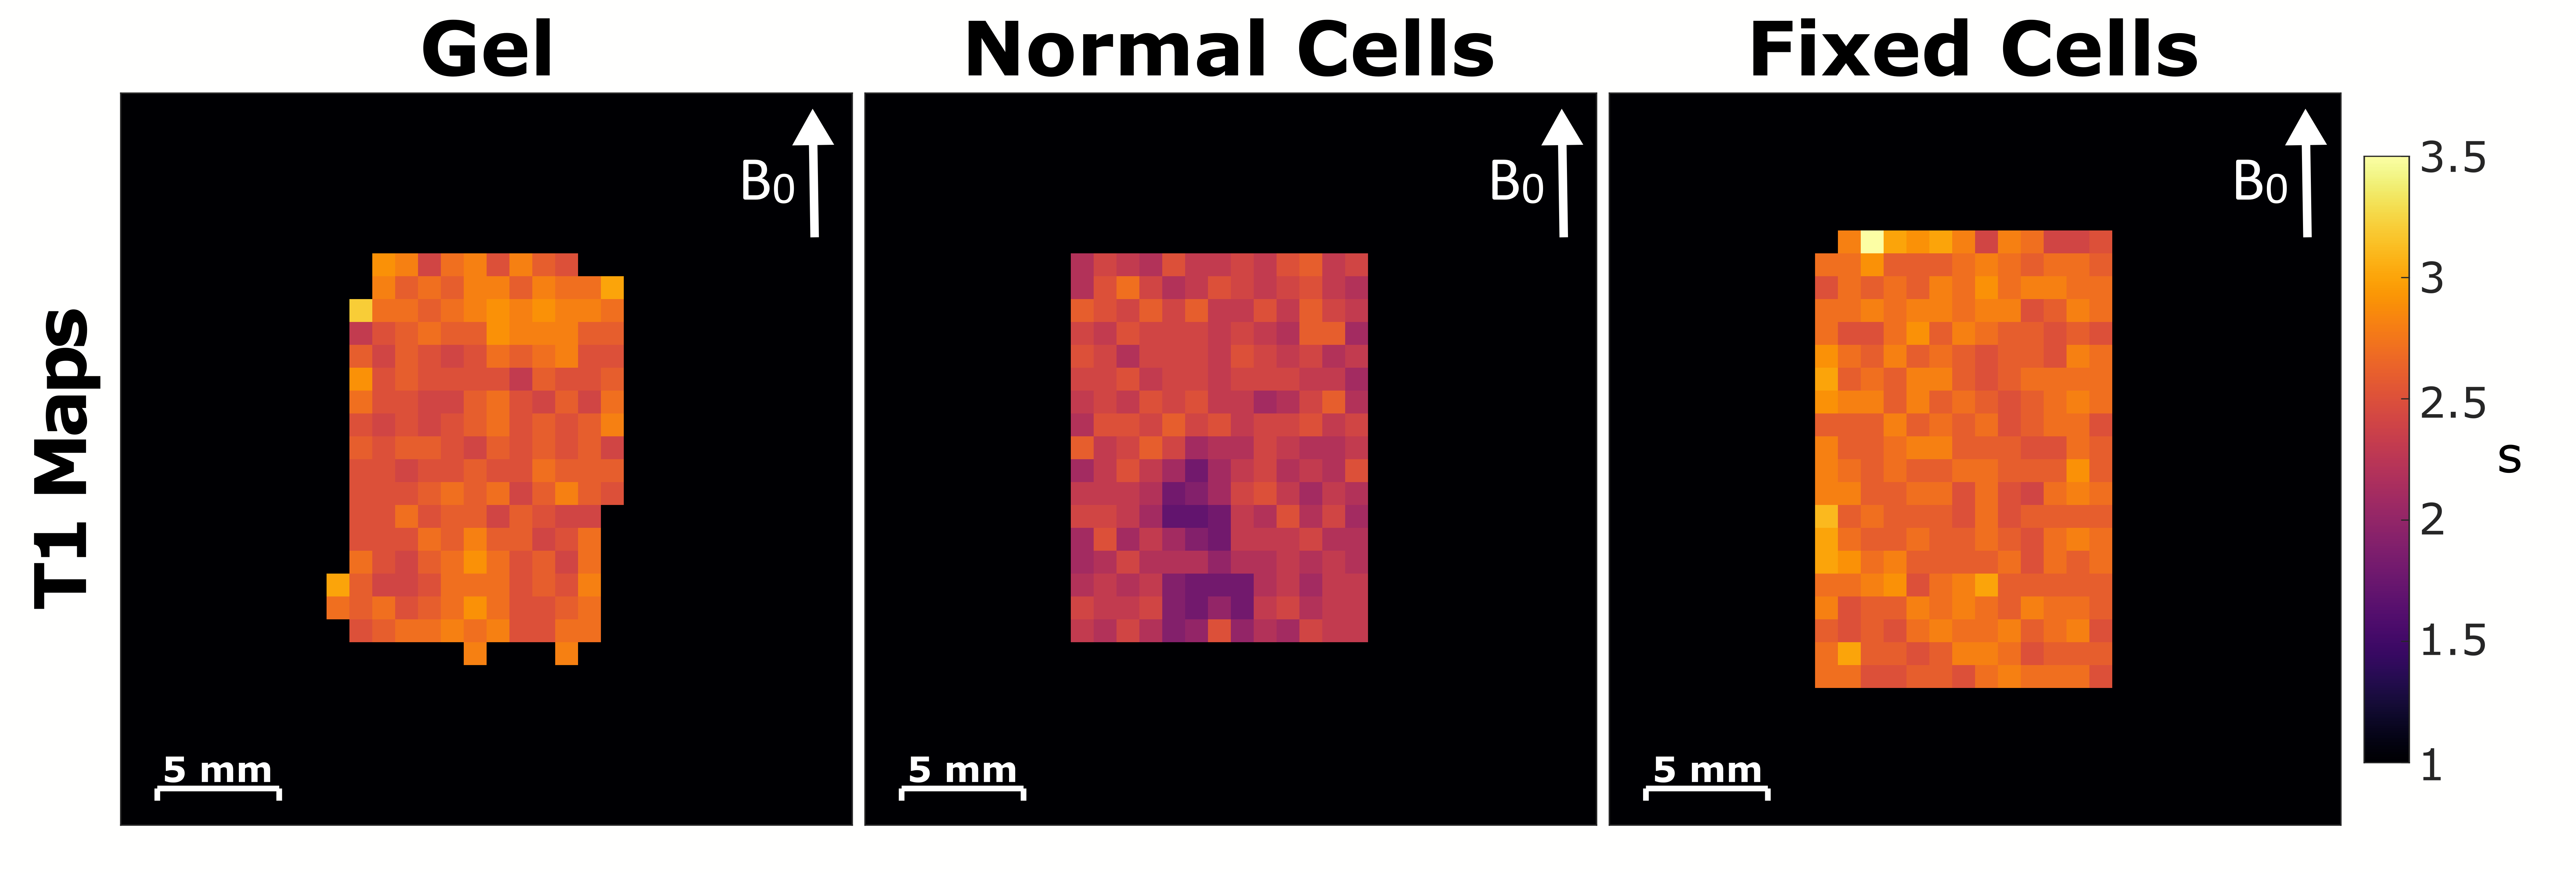
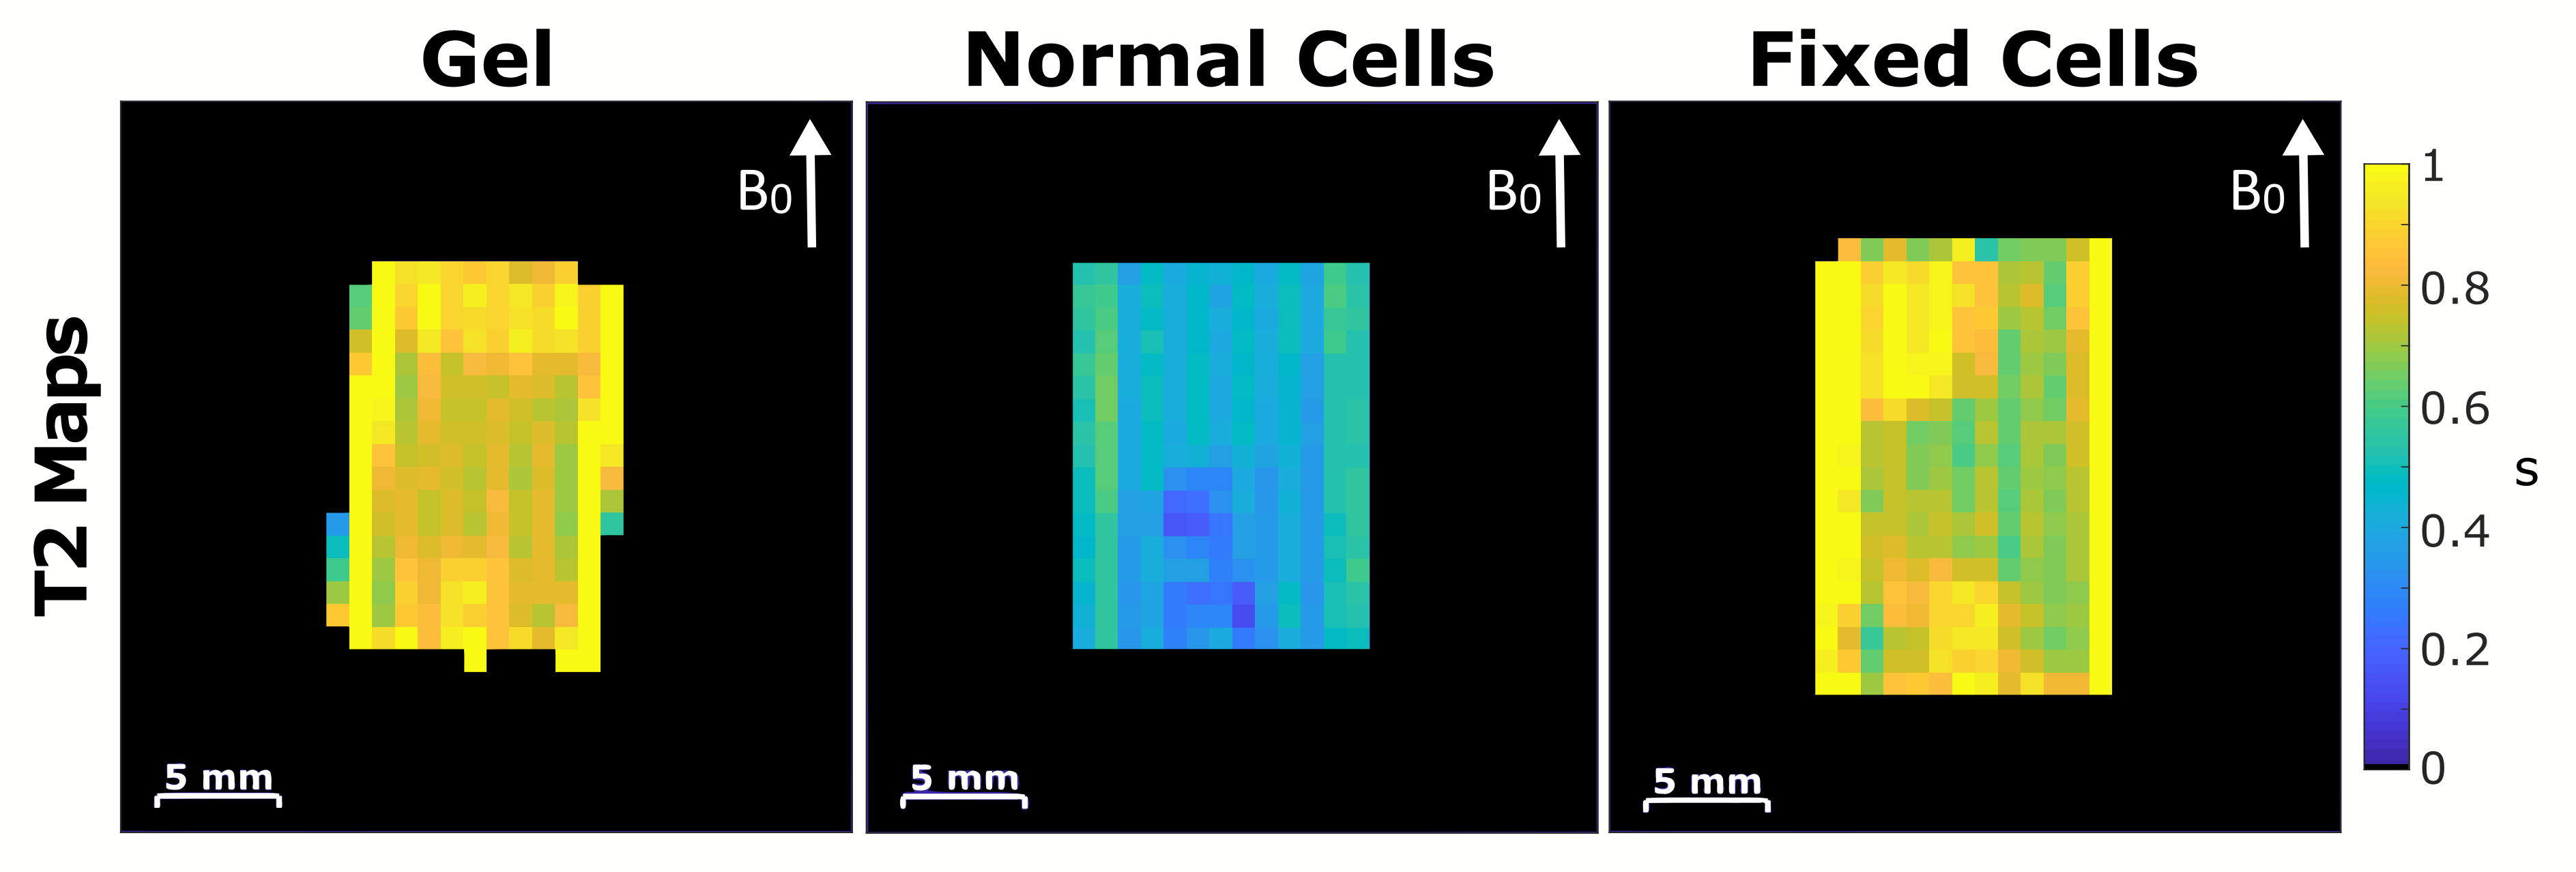
The designed Tx/Rx RF coil and bioreactor containing bovine chondrocytes can be seen in Figure 1. The bioreactor fits between the Helmholtz loops and can connect to heated perfusion lines. Figure 2 compares simulated B1 maps to those acquired in a water tube with the constructed coil. Both the simulated and acquired maps show a uniform B1 throughout the area between the two loops where the bioreactor would be located. Figure 3 displays spin echo images acquired of all three bioreactors. Good uniformity in signal is seen throughout the bioreactor volume. Figure 4 shows T1 maps acquired of the three bioreactors. On average, the normal cells have a lower T1 than fixed cells and gel alone. Little difference is seen between the bioreactor with fixed cells and gel alone. Inhomogeneities in the normal cells T1 map can be seen due to the presence of an air bubble. The average value of the normal cell bioreactor was computed using top half of the image to avoid the artifact. Figure 5 shows T2 maps acquired of the three bioreactors. The normal cells had a lower T2 on average than the fixed cells and gel alone. Similar to T1, the artifact due to the air bubble was avoided in computation of the normal cells T2 map. The fixed cells displayed inhomogeneous signal across the volume, with areas showing T2 values comparable to both the gel and normal cells.
Discussion
The addition of cells to the bioreactor caused the T1 and T2 to decrease with respect to the values of the gel alone. This is consistent with literature, which demonstrates that increased tissue structure results in a decrease in relaxation rates 5. Differences between normal cells and fixed cells were observed, likely due to the disruption of cellular membrane characteristics by the fixation method 6. Further work is needed to validate the inhomogeneity of the T2 in fixed cells.Conclusions
We have developed a dedicated RF coil with homogenous field for improved imaging of our MR-compatible 3D-printed bioreactor. The coil successfully acquired relaxation maps of bioreactors containing hydrogel, normal cells, and fixed cells. Differences in T1 and T2 were seen between the gel alone, normal cells, and fixed cells. Further work will focus on validation of these results with optical microscopy and performing studies on live cell cultures.Acknowledgements
This project was internally funded by the National Institute of Standards and TechnologyReferences
[1] Keenan et al. Quantitative magnetic resonance imaging phantoms: A review and the need for a system phantom. Magnetic Resonance in Medicine. 2018; 79
[2] Carnicka et al. Developing 3D perfusion bioreactor for MRI and optical imaging. ISMRM 2018. p.3223
[3] Unterman et al. Hyaluronic Acid-Binding Scaffold for Articular Cartilage Repair. Tissue Eng Part A. 2012;18(23-24)
[4] Novak T et al. In Vivo Cellular Infiltration and remodeling in a decellularized ovine osteochondral allograft. Tissue Engineering Part A. 2016; 22(21-22)
[5] Bottomley et al. A Review of Normal Tissue Hydrogen NMR Relaxation-Times and Relaxation Mechanisms from 1-100 MHz: Dependence on Tissue-Type, NMR Frequency, Temperature, Species, Excision, and Age. Medical Physics. 1984;11(4)
[6] Birklet al. Effects of formalin fixation and temperature on MR relaxation times in the human brain. NMR Biomedicine. 2016;29(4)
Figures